ETH/USD Daily — Support Bounce Setup in a Strong Downtrend
Chart Analysis:
Market Structure:
ETH is clearly in a bearish trend on the daily timeframe. Lower highs and lower lows are intact after a sharp rejection from the major supply zone around 3,300–3,400 (yellow zone).
Impulsive Sell-Off:
The recent move down is strong and aggressive, suggesting capitulation-style selling rather than a slow grind. This often precedes at least a technical relief bounce.
Key Support Zone (Red): ~1,900–2,000
Price has tapped into a well-defined demand/support area, where buyers previously stepped in. The long lower wicks here hint at buying interest and absorption.
Proposed Entry:
The marked entry is based on a support reaction, not a trend reversal. This is a counter-trend long, so it’s tactical, not positional.
Target Zone (Green): ~2,450–2,550
This zone aligns with:
Prior structure support → resistance flip
Likely liquidity resting above
Mean reversion after an extended drop
Bias & Expectations:
Short-term: Bullish relief bounce toward the green zone
Medium-term: Still bearish unless ETH reclaims and holds above ~2,600–2,700
Expect high volatility—clean V-shaped recoveries are rare in this context
Risk Note:
If price loses the 1,900 support decisively, the setup is invalidated and opens the door for continuation toward lower psychological levels.
📌 Summary:
This chart shows a high-risk, counter-trend bounce play off major daily support, targeting a logical resistance zone above. Good for disciplined traders, not for blind bottom-catching.
Ethsignals

$ETH in a descending impulse wave headed to $,681On the ETH chart, I see an impulse wave headed down to $1,681. It started at the peak on 23 Aug 2025 and Wave 3 completed almost at the 1.618 @ $2,619. Wave 5 will complete at the 2.618 @ $1,681, which aligns with the bottom of the wedge in place since Jun 2022 (and which also tagged the April 2025 bottom)

#ETH ON THE EDGE DELTAIN:ETHUSD.P
ETH is on the edge of the cliff. If it breaks below this level, we can see a significant downward move to $2200 easily and worst case of $1500 & $1400.
Long term investors can accumulate on the supports. Follow me for more.
This indicator is provided for educational and informational purposes only.
It does not constitute financial advice, investment recommendations, or trade signals.
The creator and Systematic Traders Club are not responsible for any financial losses resulting from the use of this indicator.
Trading and investing involve risk. Always do your own analysis and use proper risk management.

#ETH/USD Buy Trade Setup.Here’s an up-to-date ETH/USD Buy trade outlook (technical + fundamental) to help you assess whether positioning for a Upside makes sense right now.
Thank You......

#ETH one final hope?
One last hope for a bounce back.
If the price fails to break and hold above $3050, then we may see a downside move. The direction is still not clear.
Disclaimer:
This idea is provided for educational and informational purposes only.
It does not constitute financial advice, investment recommendations, or trade signals.
The creator and Systematic Traders Club are not responsible for any financial losses resulting from the use of this indicator.
Trading and investing involve risk. Always do your own analysis and use proper risk management.

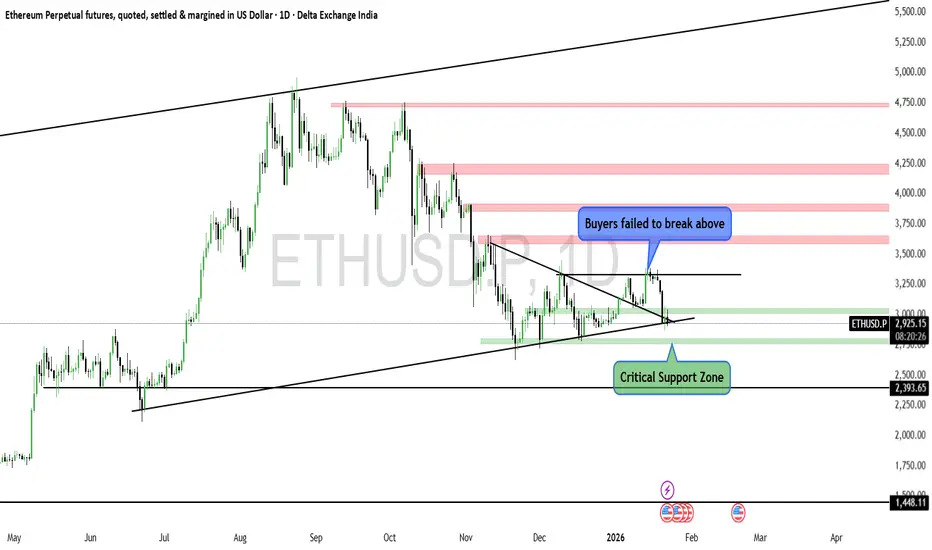
#ETH lost the bullish momentum?
Seems like ETH failed to break the previous high.
But the trend is still not reversed. Until it holds the "Critical Support" level, we can consider side way movement.
If it breaks below the critical support then the downside may continue.
This indicator is provided for educational and informational purposes only.
It does not constitute financial advice, investment recommendations, or trade signals.
The creator and Systematic Traders Club are not responsible for any financial losses resulting from the use of this indicator.
Trading and investing involve risk. Always do your own analysis and use proper risk management.
Etherium 1 hour chart analysisEtherium simple chart analysis.
upside ethrium price more resistance
lowside ethrium prime little support.
and now Ethrium Prime Sideways.

ETH 1H Outlook: Key Support Retest With Potential Downside RiskKey observations:
1. Support Level Under Pressure
ETH is retesting this support multiple times.
The annotation suggests: “SUPPORT IF BREAKS THEN WE CAN SEE MORE DOWNWORD” — meaning a breakdown could trigger further selling.
2. Downside Targets
If the current support fails, the next liquidity zones highlighted are:
FVG (Fair Value Gap) around $2,950–$2,900
Extreme POI zone around $2,880–$2,850
Major support at $2,787 (marked as “next support”).
3. Upside Scenario
If support holds, ETH could bounce toward:
$3,078
$3,134
High resistance around $3,225
4. Market Structure
Several CHoCH and BOS labels indicate mixed structure, showing recent weakness but with potential for rebound if buyers defend support strongly.

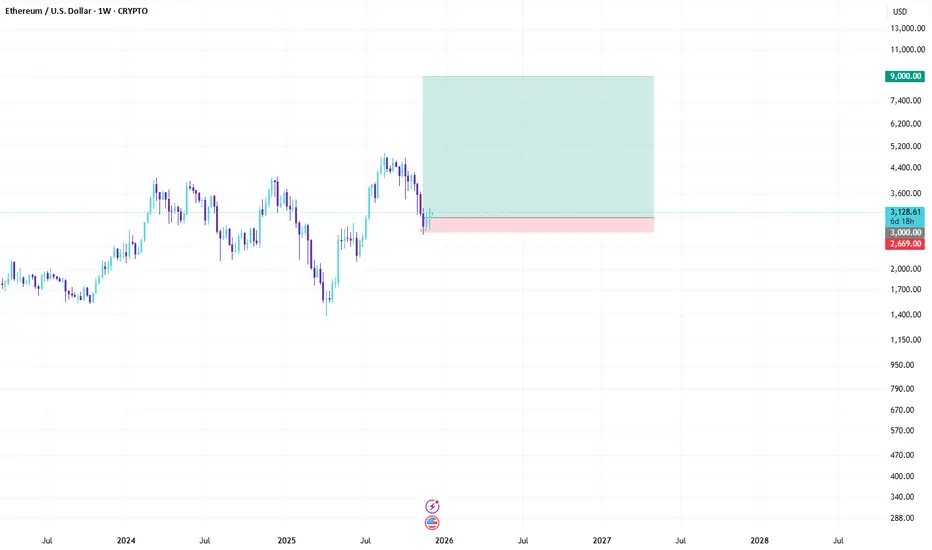
ETH Bullish Outlook: Tokenization Boom to $9K in 2026CRYPTO:ETHUSD
Asset: ETH/USD
Timeframe: Weekly
Hey traders! 🚀 Ethereum's dipping into December around $3,100 after some post-ATH consolidation, but the setup screams reversal. Fundstrat's Tom Lee is calling for a monster rally to $9,000 by 2026, fueled by tokenization exploding across finance. That's nearly 190% upside—ETH's about to steal the spotlight from BTC!
Key Analysis:
Macro Tailwinds: ETH's riding BTC's coattails but with extra juice from spot ETF inflows and real-world asset tokenization. As Wall Street piles in, expect ETH to decouple upward—watch for Nasdaq sync and weakening USD to amplify the move.
Technical Setup: Rock-solid support at $2,800, the recent higher low that's holding like a champ. Daily RSI oversold, bullish MACD crossover brewing, and on-chain metrics show whales accumulating. Smash $3,500 resistance, and we're blasting toward $4,500 next.
Risks: Near-term volatility if broader risk assets falter, but ETF demand and layer-2 scaling keep the floor intact for the long haul.
Trade Signal:
Entry: Long ETH/USD at $3,000 (confirmation above $2,800 support).
Target 1: $4,000 (short-term, ~30% gain).
Target 2: $9,000 (Tom Lee tokenization target by mid-2026).
Stop Loss: $2,700 (below key support to guard the downside).
Risk/Reward: 1:4+ on the primary target. Position size: 1-2% of portfolio.
Chart snapshot: Weekly candles forming a bullish pennant at $2,800, with Fibonacci retracement eyeing $9K extension. Overlay ETH ETF flows for that institutional vibe! (Pro tip: Compare with BTC dominance to spot ETH's breakout edge.)
Idea by Signal Squad
Published: December 8, 2025
What do you think, squad? ETH outpacing BTC in 2026, or more sideways grind? Drop your takes below—let's squad up! #ETH #CryptoSignals #SignalSquad
Weekly Analysis BTC with Sell and Buy scenarios..Here is the weekly analysis of BTC including various topics of ICT, Price action etc.
Note – if you liked this analysis, please boost the idea so that other can also get benefit of it.
Also follow me for notification for incoming ideas.
Also Feel free to comment if you have any input to share.
Join me on live stream for real time update.
Disclaimer: This analysis is for educational purposes only and does not constitute investment advice. Please do your own research (DYOR) and check with your financial advisor before making any trading decisions.

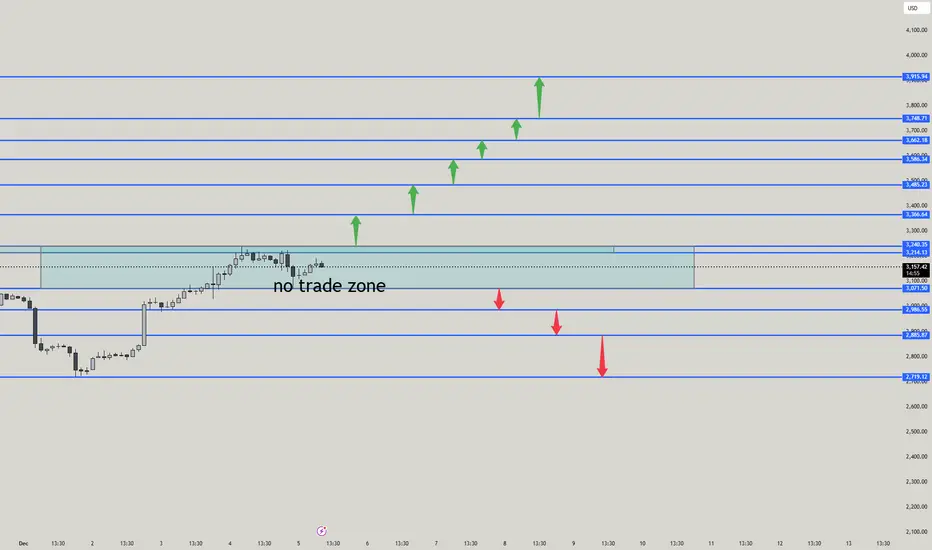
ETHUSD – Pure Price Action Analysis ETHUSD – Pure Price Action Analysis (Buy | Sell | TP | SL | No-Trade Zone)
🚫 NO-TRADE ZONE (Ranging / Indecision Area)
The shaded box between $3,140 – $3,245 is your no-trade zone.
Reason:
Market is consolidating
No strong direction
Liquidity building
Smart money accumulation area
👉 Inside this box = avoid entries.
Wait for breakout + retest.
✅ BUY SETUP (Breakout → Retest → Long)
Buy Entry Levels
1️⃣ Buy above $3,245 (clean breakout & retest)
2️⃣ Safer buy above $3,290 (strong momentum zone)
Buy-Side Targets (TP)
🎯 TP1 → $3,366
🎯 TP2 → $3,428
🎯 TP3 → $3,502
🎯 TP4 → $3,602
🎯 TP5 → $3,748
🎯 TP6 → $3,915 (high probability supply zone)
STOP LOSS for Buy
🛑 SL → Below breakout candle
Safer → Below $3,200
❌ SELL SETUP (Breakdown → Retest → Short)
Sell Entry Levels
1️⃣ Sell below $3,100
2️⃣ Aggressive sells at each retest shown by red arrows.
Sell-Side Targets (TP)
🎯 TP1 → $2,986
🎯 TP2 → $2,885
🎯 TP3 → $2,719 (major demand zone)
STOP LOSS for Sell
🛑 SL → Above the retest candle
Safer → Above $3,140
🔥 BEST HEADING FOR THIS ANALYSIS
ETHUSD – Breakout Trading Plan | Buy–Sell Zones | TP–SL | No-Trade Zone
📌 SUMMARY (Very Clear)
🚫 No-Trade Zone:
$3,140 – $3,245
✅ Buy only if price breaks → retests → holds above $3,245
TP → 3,366 / 3,428 / 3,502 / 3,602 / 3,748 / 3,915
SL → Below 3,200
❌ Sell only if price breaks → retests → fails below $3,100
TP → 2,986 / 2,885 / 2,719
SL → Above 3,140
ETHUSD Complete Price Action Roadmap (Buy, Sell, Pullback Zones)ETHUSD PRICE ACTION ANALYSIS
Current Market Condition
Price has created a Higher High (HH) directly inside a major supply zone around 3240–3260.
Strong impulse rally from the LL → HL → HH structure (bullish trend).
Price is now overextended into resistance → likely for a pullback.
🔥 1. SELL SETUP (Rejection from Supply Zone)
Price is already inside a big supply zone (3,240 – 3,260).
📍 Sell Entry
3240 – 3255 (inside the blue supply zone)
🛑 SL (Safe Stop)
3275
🎯 TP Targets
1️⃣ 3196
2️⃣ 3071
3️⃣ 2966
4️⃣ 2885 (demand zone)
🟢 2. BUY SETUP (Breakout + Retest)
Only buy if price closes above 3275.
📍 Buy Entry
Above 3275 + retest of 3250–3260
🛑 SL
3220
🎯 TP
1️⃣ 3340
2️⃣ 3380
3️⃣ 3450
🟢 3. PULLBACK BUY (Best & Safe Buy Zone)
Look for price to retrace into demand areas.
📍 Pullback Buy Zones
Zone A:
3196 – 3170
Very strong FVG + demand
SL: 3140
TP: 3240 → 3275
Zone B (Bigger Pullback):
3071 – 3050
Clean structure support + liquidity level
SL: 3010
TP: 3150 → 3240 → 3300
🔻 4. PULLBACK SELL (If price breaks down)
Only if price breaks 3196 and retests.
📍 Pullback Sell Entry
3190 – 3205 retest
🛑 SL
3230
🎯 TP
1️⃣ 3071
2️⃣ 2966
3️⃣ 2885
🚫 5. NO-TRADE ZONE
3210 – 3240
Reason:
This is the mid-range of supply zone
Candles are mixed
Not safe to buy or sell until rejection or breakout
⭐ FINAL SUMMARY (Keep for Your Chart)
🔥 SELL (Current Best Setup)
Entry: 3240–3255
SL: 3275
TP: 3196 → 3071 → 2966 → 2885
🟢 BUY (Breakout)
Entry: above 3275 (retest 3250–3260)
SL: 3220
TP: 3340 → 3380 → 3450
🟢 PULLBACK BUY
Zone A: 3196–3170 (SL 3140)
Zone B: 3071–3050 (SL 3010)
TP: 3240 → 3275 → 3300
🔻 PULLBACK SELL
If price breaks 3196
Entry: 3190–3205
SL: 3230
TP: 3071 → 2966 → 2885
🚫 NO-TRADE ZONE: 3210–3240

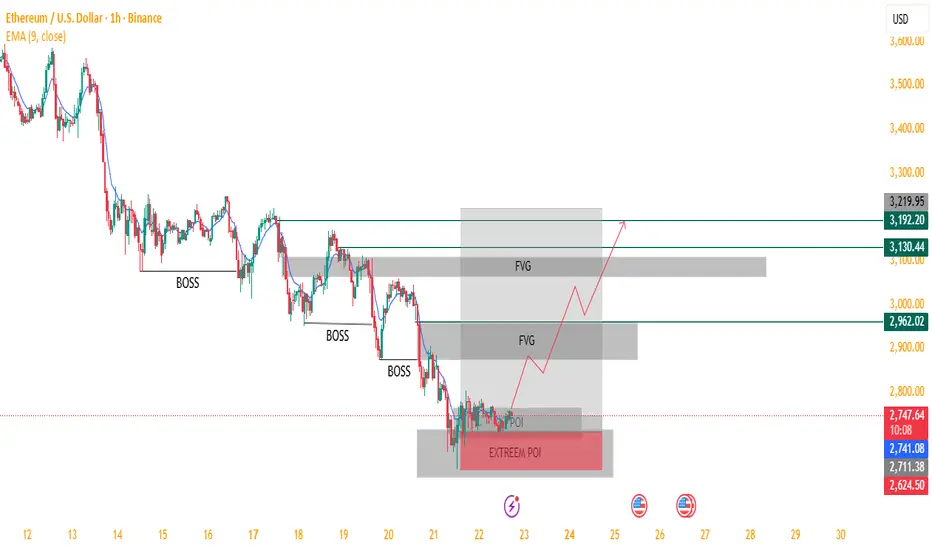
ETH/USD – Potential Bullish Reversal from Extreme POI !Analysis:
The chart suggests Ethereum is currently trading inside a strong Extreme Point of Interest (POI) after a series of Breaks of Structure (BOSS) to the downside. Price has entered a demand zone that may trigger a bullish reversal.
Key observations:
Downtrend Structure: Multiple BOSS confirmations show sustained bearish momentum leading into the Extreme POI.
Extreme POI (Demand Zone): Price is consolidating inside a deep demand area marked in red, indicating potential accumulation by buyers.
POI Reaction Expected: If price maintains support here, a bullish reversal is likely.
Fair Value Gaps (FVG):
Two major FVGs above act as logical bullish targets for price inefficiency fill.
Projected Price Path:
The drawn projection suggests:
Short-term bounce from POI
Breakout structure upward
Continuation toward higher FVG fills around $2,962, $3,130, and possibly $3,192 – $3,220.
Bias:
▶ Bullish, as long as price remains above the Extreme POI.
A breakdown below would invalidate the setup and continue the downtrend.
This is a strong smart-money style setup with a clean narrative:
Demand → Break of structure → FVG fill → Higher targets.
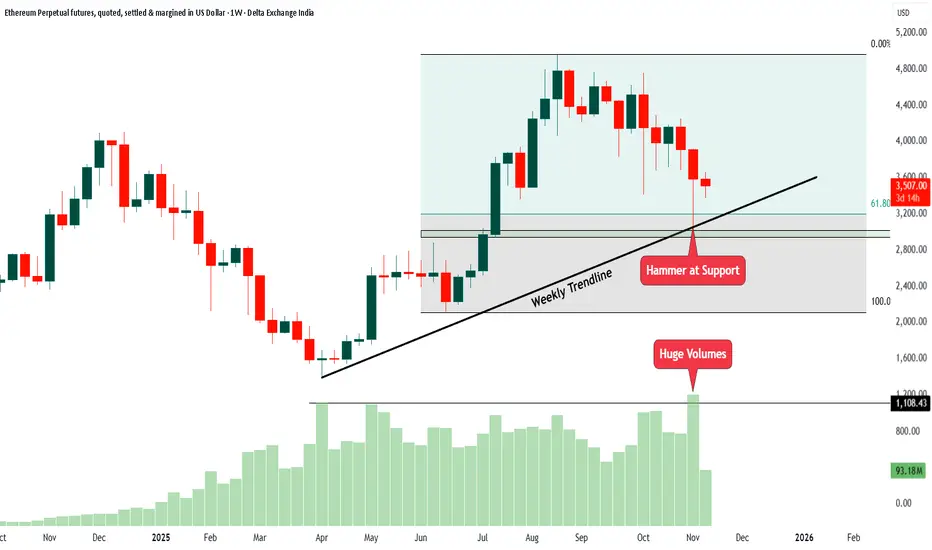
ETH Weekly Chart Analysis1. The price has been respecting a weekly trendline for many months. This trendline acts like a support line where buyers usually come in.
2. Recently, the price fell towards this same trendline and created a hammer candle. A hammer at support often shows that sellers pushed the price down, but buyers stepped in strongly and pulled it back up. This is usually a sign of buying interest.
3. The hammer candle formed exactly near the support zone and the Fibonacci 61.8 percent area. This area often works as a strong reversal point.
4. When the hammer candle formed, the volume was very high. Huge volume at support means big players were actively buying at lower levels.
5. The price is still inside a wide range between recent highs and lows. It has not broken out yet, but the support reaction is positive.
In simple words, the chart is showing a strong bounce setup from support with a hammer candle and high volume. This is a sign that buyers may try to take control again as long as the price stays above the trendline and support area.
LONG ETH for 5000$ETH showing signs of Inside bar on daily timeframe. LONG here for a 5000$+ target.

ETHUSD | Technical Analysis 25/08/2025Hi,
ETH can form inverted head and should and go upside upto 5100+. Time period can be 4 to 5 days.
Disclaimer: This is only for educational purpose.
Thanks

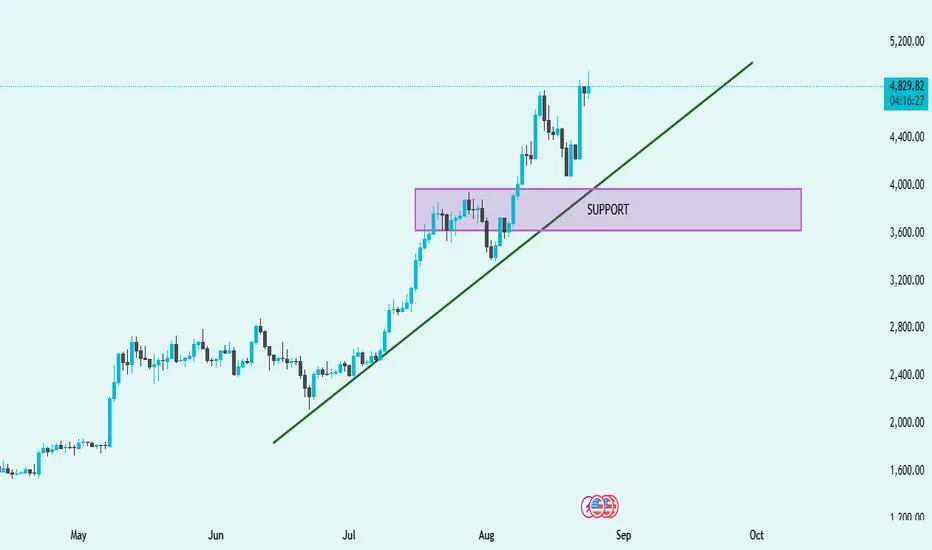
ETH/USD Technical Analysis – Strong Uptrend with Key Support📈 ETH/USD Technical Analysis – Strong Uptrend with Key Support
Trend Direction ➡️
The chart shows a clear bullish trend supported by an upward sloping trendline (green). Price action is consistently forming higher highs and higher lows, confirming strong upward momentum.
Support Zone 🟪
The highlighted support area (3,600 – 4,000) has been tested successfully. Price bounced strongly from this zone, showing buyers are actively defending this level.
Breakout & Momentum 🚀
After retesting support, ETH broke above the recent consolidation and is now trading around 4,843, pushing towards new highs. This signals bullish continuation if volume supports the move.
Trendline Confirmation 📐
The trendline has acted as a dynamic support multiple times. As long as ETH trades above it, the bullish trend remains intact.
Outlook 🔮
If ETH stays above 4,800, the next potential target could be 5,200+.
If price breaks below the trendline and the 3,600 support zone, bearish correction may begin.
✅ Summary: ETH is in a strong bullish trend 🚀, supported by both the trendline and key support zone. Short-term outlook remains bullish as long as 4,800 holds.
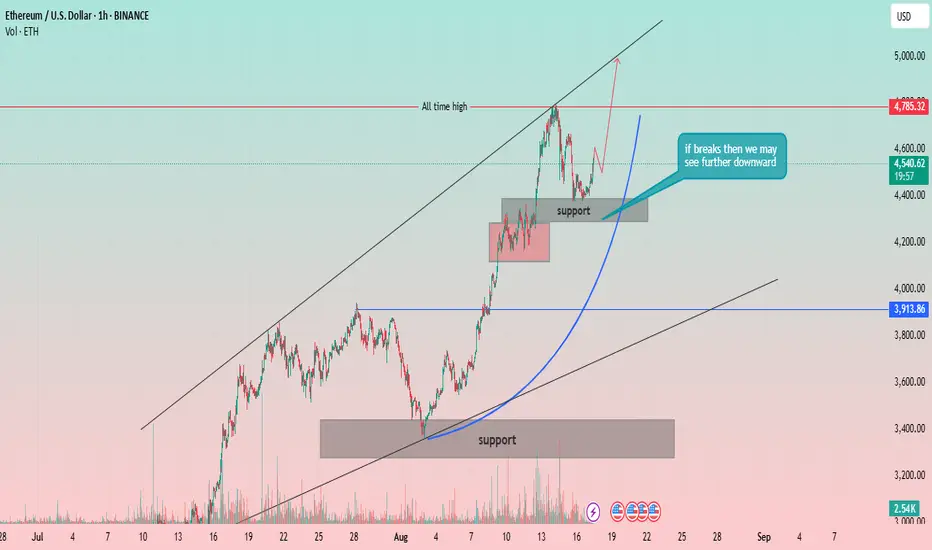
Ethereum (ETH) 1H Chart: Re-testing the All-Time High?Strong Uptrend Channel: The price of Ethereum has been moving within a well-defined ascending channel, indicated by two parallel black trendlines. This strong channel suggests a sustained bullish momentum.
All-Time High: A significant resistance level is marked as the "all-time high" at approximately 4,785.32 USD. The price has recently tested this level.
Support Levels:
Major Support Zone: A broad support zone is identified between approximately 3,300 USD and 3,450 USD. This zone has previously acted as a strong base for a price rally.
Recent Support Zone: A smaller, more recent support zone is marked around 4,200 USD. The price has consolidated within this area after its recent push towards the all-time high.
Price Action and Projections:
The price recently reached a peak near the all-time high and has since pulled back, consolidating within the recent support zone.
A key annotation states, "if breaks then we may see further downward." This highlights the importance of the 4,200 USD support zone. A break below this level could indicate a potential deeper retracement, possibly towards the lower trendline of the channel or the major support zone.
A parabolic arc is drawn (blue line), suggesting a potential trajectory for the price to continue its move higher from the current level, with a goal of re-testing or breaking the all-time high.
Volume: The chart includes a volume indicator, showing significant volume spikes during the major rallies and drops, confirming strong market interest and participation.
Eth tp hit and now going for short with low slLast chart tp hitted perfectly
NOW looking for shorts again and this is nothing those are catch the full runnnn
Must share this more coming
ETH Long Setup: Key Support Zone at $2,453.72The $2,453.72 zone on CRYPTOCAP:ETH looks promising for our next potential long setup.
It’s a key support level and holds significant liquidity—definitely a zone worth watching.
This is not financial advice. Always trade at your own risk.

Ethereum Accumulation Zones Huge Dip Incoming- Ethereum is currently trading at 2262, down more than 22%
- Ethereum has two important areas to look at, and some important zones like 2110 & the OTEs 1694-1880$
- From an accumulation perspective, I would like to wait for ETH to purge either below the Inefficient gap or start going sideways at the buying zones
- To confirm this bias, we also need to make sure we consider taking a look at USDT D as well once it tops out, ETHs bottom will be near
- Manage risk properly and try to only trade in Spot

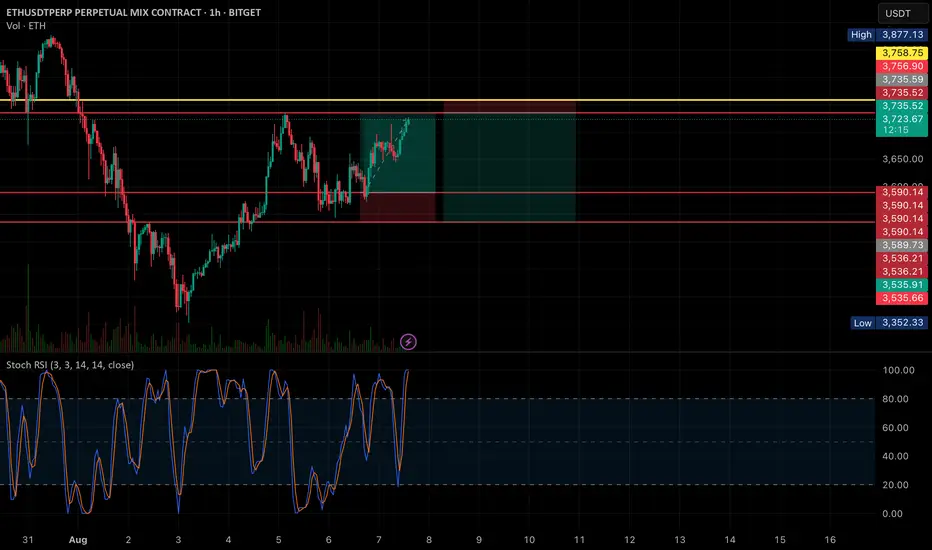
"Bearish Reversal Opportunity Following Supply Zone Rejection"1. Double Top Formation (Resistance Level Identified)
The chart displays a clear double top structure at the 2,760–2,800 USDT level.
This level has acted as a strong supply zone (highlighted in red), where price previously reversed, indicating heavy selling interest.
Current price action has retested this resistance zone and shown signs of rejection.
2. Liquidity Sweeps & False Breakouts
On the left side of the chart, an aggressive downward wick (marked with a blue arrow) suggests a liquidity sweep below a key low before strong bullish momentum returned.
This type of price action indicates smart money involvement, designed to remove weak hands before pushing price higher.
3. Accumulation Phases (Sideways Consolidation)
Multiple accumulation ranges are highlighted with blue rectangles.
These ranges show horizontal consolidation, where price builds up energy before breakout.
The most recent breakout led to a vertical rally toward the resistance zone, signaling an end of the accumulation and a start of distribution.
4. Double Bottom Support Structure
Identified near the 2,480 level, marked by red circles.
This level has historically acted as demand/support, evidenced by multiple bounces from this price zone.
Now highlighted with a grey zone, it is projected to act as the next key support area.
5. Bearish Projection
A large black arrow suggests a forecasted bearish move from the current high (~2,800) back to the support zone (~2,480).
This aligns with the idea of a mean reversion or pullback after a strong bullish impulse.
---
Conclusion & Trade Idea:
🔻 Bias: Bearish (Short-term)
The chart presents a classic reversal pattern with a double top at a well-defined supply zone.
Entry could be considered after confirmation of rejection from this level.
🧠 Trade Plan Suggestion:
Entry: Short near 2,780–2,800 after bearish confirmation (e.g., bearish engulfing candle or break of structure).
Target: 2,480 (support zone).
Stop Loss: Above 2,820 (recent high).
Risk-Reward: Approximately 1:2.5 or better depending on execution.

They saw a breakdown. I saw entry precision.ETH just did what it always does before a shift — it delivered into value.
Price rejected from 2,550 cleanly, took out weak buyers, and revisited the same HVN where prior accumulation began. That wasn’t a breakdown — it was completion.
I’m looking at the 2,488.11 zone — right at the 0.786 retracement — as the launchpad. It aligns with a low-volume tail, creating the exact imbalance Smart Money uses to reprice.
Above, I’m watching for a reversion to the mean at 2,511.9 (0.5), followed by a reaction at 2,532 — the last inefficient node before the supply wall at 2,550 gets filled again.
If we break through 2,550 clean, this becomes a much larger redistribution leg. But we trade it one delivery at a time.
Execution setup:
🎯 Entry: 2,488.11–2,474.0
🔑 Target 1: 2,511.9
🎯 Target 2: 2,550
❌ Invalidation: 2,474.0 clean break and continuation — wait for new structure
Nothing about this setup was noisy.
Just price completing its job.
I don’t chase the move. I meet it where it begins.
