ETHUSD SHOWING A GOOD DOWN MOVE WITH 1:8 RISK REWARDETHUSD SHOWING A GOOD DOWN MOVE WITH 1:8 RISK REWARD
DUE TO THESE REASON
A. its following a rectangle pattern that stocked the market
which preventing the market to move any one direction now it trying to break the strong resistant lable
B. after the break of this rectangle it will boost the market potential for break
C. also its resisting from a strong neckline the neckline also got weeker ald the price is ready to break in the outer region
all of these reason are indicating the same thing its ready for breakout BREAKOUT trading are follws good risk reward
please dont use more than one percentage of your capitalfollow risk reward and tradeing rules
that will help you to to become a bettertrader
thank you
Ethusdanalysis

ETHUSD SHOWING A GOOD UP MOVE WITH 1:8 RISK REWARDBTCUSD SHOWING A GOOD
UP MOVE WITH 1:8 RISK REWARD
DUE TO THESE REASON
A. its following a rectangle pattern that stocked the market
which preventing the market to move any one direction now it trying to break the strong resistant lable
B. after the break of this rectangle it will boost the market potential for break
C. also its resisting from a strong neckline the neckline also got weeker ald the price is ready to break in the outer region
all of these reason are indicating the same thing its ready for breakout BREAKOUT trading are follws good risk reward
please dont use more than one percentage of your capitalfollow risk reward and tradeing rules
that will help you to to become a bettertrader
thank you

ETHUSD SHOWING A GOOD UP MOVE WITH 1:8 RISK REWARD ETHUSD SHOWING A GOOD UP MOVE WITH 1:8 RISK REWARD
DUE TO THESE REASON
A. its following a rectangle pattern that stocked the market
which preventing the market to move any one direction now it trying to break the strong resistant lable
B. after the break of this rectangle it will boost the market potential for break
C. also its resisting from a strong neckline the neckline also got weeker ald the price is ready to break in the outer region
all of these reason are indicating the same thing its ready for breakout BREAKOUT trading are follws good risk reward
please dont use more than one percentage of your capitalfollow risk reward and tradeing rules
that will help you to to become a bettertrader
thank you

ETHUSD Bull Trap? - Final Breakdown Setup Is Almost Locked InETH is still stuck inside a clear falling channel, and the entire pattern is behaving like a corrective downtrend. The recent bounce from 2620 looks sharp, but it’s still just a counter-trend move. Nothing here screams trend reversal yet.
Wave 3 ending at 2620 , and now the price is rising for a Wave 4 retracement. Wave 4 usually moves back toward the mid-channel and tests previous breakdown zones.
The red box around 3200–3300 is the key trap zone. This is where sellers can return because Wave 4 must not enter Wave 1 territory, which sits higher. As long as ETH stays under that invalidation level, the bearish structure remains fully intact.
The move looks like a classic (a)-(b)-(c) correction inside Wave 4. Once this corrective bounce completes, the chart suggests ETH will resume the downward path. The channel alignment and wave symmetry both support a final Wave 5 drop.
If the bearish count plays out, ETH could slide toward 2400 – 2300 in Wave 5 before a major bottom forms. That’s the zone where sellers exhaust and buyers take control again. Until ETH breaks the invalidation level with strength, downside remains the more probable outcome.
Stay Tuned!
@Money_Dictators

ETHUSD: Reversal or Another Bull Trap?Look at this:
ETH played the trap perfectly. After pushing into the 3200–3400 resistance zone, price failed to sustain above it and rolled over, confirming that the move was distribution, not strength. Sellers stepped in exactly where a Wave 4 rally should fail.
The rejection was followed by a clean breakdown of the parallel rising channel, which shifts the short-term bias back in favor of the bears. That channel was the last structure holding the corrective bounce together. Once it broke, the bullish case weakened sharply.
This drop reinforces the view that the move up from 2620 was only a Wave 4 correction, not the start of a new trend. With Wave 4 likely complete, ETH appears to be transitioning into Wave 5 of the broader corrective decline.
As long as price remains below the broken channel and prior resistance, downside continuation remains the dominant scenario. The structure opens the door for a retest of 2620 , with a deeper extension toward 2465 if selling pressure accelerates.
Until ETH reclaims the channel with strength and acceptance, this remains a sell-the-bounce environment. The warning came at the trap zone, and the market is now following through.
Stay Tuned!
Money Dictators,
R.D :)

ETHUSD SHOWING A GOOD UP MOVE WITH 1:10 RISK REWARDETHUSD SHOWING A GOOD
UP MOVE WITH 1:10 RISK REWARD
DUE TO THESE REASON
A. its following a rectangle pattern that stocked the market
which preventing the market to move any one direction now it trying to break the strong resistant lable
B. after the break of this rectangle it will boost the market potential for break
C. also its resisting from a strong neckline the neckline also got weeker ald the price is ready to break in the outer region
all of these reason are indicating the same thing its ready for breakout BREAKOUT trading are follws good risk reward
please dont use more than one percentage of your capitalfollow risk reward and tradeing rules
that will help you to to become a bettertrader
thank you

ETHUSD SHOWING A GOOD UP MOVE WITH 1:8 RISK REWARD ETHUSD SHOWING A GOOD
UP MOVE WITH 1:8 RISK REWARD
DUE TO THESE REASON
A. its following a rectangle pattern that stocked the market
which preventing the market to move any one direction now it trying to break the strong resistant lable
B. after the break of this rectangle it will boost the market potential for break
C. also its resisting from a strong neckline the neckline also got weeker ald the price is ready to break in the outer region
all of these reason are indicating the same thing its ready for breakout BREAKOUT trading are follws good risk reward
please dont use more than one percentage of your capitalfollow risk reward and tradeing rules
that will help you to to become a bettertrader
thank you

ETH/USD Bullish Breakout & FVG Buying Zone StrategyETH/USD Chart Analysis (30m TF)
🔹 Trend & Structure
Price was moving inside a descending channel (support & rejection lines).
Recently broke above the channel, showing bullish momentum.
🔹 Key Levels & Zones
FVG Buying Zone: $4,283 – $4,353 (potential entry zone).
EMA70 ($4,393) acting as immediate support/resistance.
EMA200 ($4,468) is the next strong resistance.
Target Point: $4,667 (upside target after breakout).
🔹 Strategy
📈 Look for buy entries inside the FVG zone ($4,283 – $4,353).
🎯 Target: $4,667
🛑 Stop-loss: Below $4,283 to protect capital.
⚡ Setup suggests a bullish continuation if the buying zone holds.

ETHUSD Entry at $2,422 with Target at $2,521and Support at 2,3921. Entry Point: ~2,422.2
This is the suggested buy area based on a recent bounce from the support zone.
2. Support Zone (Purple Box):
Bottom boundary: ~2,392.4
Top boundary: ~2,408.4
Price has bounced multiple times here, showing strong buying interest.
3. Resistance Point: ~2,463.9
A clear horizontal resistance line, previously tested.
4. EA Target Point: ~2,522.1
A bullish target if the price breaks above the resistance level.
---
🔶 Highlighted Patterns / Markers
Orange Circles: Indicate key swing highs and lows — possibly used to identify double tops/bottoms or rejection/wick zones.
Blue Arrows: Illustrate the anticipated move from:
Entry (2,408.1) → Resistance (2,463.9) → Target (2,521.2)
Target gain = +111.7 USD (+4.64%)
---
🔻 Stop Loss Level
Set just below the support box at ~2,392.4
Protects from false breakouts or deeper pullbacks.
---
📈 Strategy Outlook
Bullish Bias: The setup expects a breakout from the current price range.
Risk-Reward Ratio: Appears favorable — tight stop and wide target.
Confirmation Needed: A solid breakout and hold above 2,423–2,425 may be the early confirmation signal.
---
📌 Summary
Element Value
Entry Point ~2,422.2
Stop Loss ~2,392.4
Resistance ~2,463.9
Target (TP) ~2,521.2
R:R Ratio Approx. 3:1
Bias Bullish

Ethereum - Technical Analysis Overview week of May 19–25, 2025Predicting Ethereum's (ETH) price movement for the week of May 19–25, 2025, involves analysing recent technical indicators, market sentiment, and external factors. Below is a concise technical analysis based on available data, focusing on key indicators and potential price trends. Note that cryptocurrency markets are highly volatile, and this analysis is not financial advice—always conduct your own research.
#Technical Analysis Overview
Current Price (as of May 17, 2025): Approximately $2,550, at the time of posting
Market Sentiment: Neutral to bullish, with mixed signals from technical indicators and a Fear & Greed Index.
Recent Performance: ETH has risen 29.61% over the past week and 16.61% over the past month, showing strong short-term momentum but facing potential resistance at 2,750 - 3,050
#Volume and Volatility:
Recent trading volume has surged (from $22.02B to $42.95B daily), indicating strong market interest.
Volatility remains high (17.61% over the past 30 days), suggesting potential for sharp price swings.
For support and resistance please refer the chart

ETH/USD Breakout Trading Setup – Long Entry with 16% Target PoteEntry Point: $1,593.08
Target Point: $1,807.83
Stop Loss: $1,472.68
Risk/Reward Ratio: Roughly 2.1:1
Indicators Used:
EMA 30 (Red Line) at $1,593.08 (near entry point)
EMA 200 (Blue Line) at $1,605.09
Analysis:
1. Consolidation Phase:
ETH is in a sideways range after a prior downtrend, consolidating within the purple support zone.
This zone (~$1,555 to ~$1,593) has been tested multiple times, suggesting a strong base.
2. Bullish Breakout Anticipation:
The setup expects a breakout above consolidation, targeting a 16.11% move to $1,807.83.
A breakout strategy is being applied, assuming ETH will reverse from this consolidation area a

ETH/USD Bearish Reversal Setup – Targeting $1,470 After ResistanPair: Ethereum / U.S. Dollar (ETH/USD)
Exchange: Coinbase
Timeframe: 15 minutes
Indicators:
EMA 30 (red line): ~1635.82
EMA 200 (blue line): ~1585.79
🟣 Key Levels & Zones
Resistance Zone (Purple Rectangle Top): Around $1,647 – previously tested and rejected.
Support Zone (Purple Rectangle Bottom): Around $1,470 – marked as the "EATARGET POINT".
Current Price: ~$1,645
📉 Bearish Breakdown Setup
Chart Pattern: There’s a potential double top or distribution zone forming near the resistance.
Projection: The price is expected to break below the smaller support zone and drop to the target zone around $1,470.67, representing an 11.13% drop.
Measured Move Tool: Indicates a bearish price target if the price breaks down from the current consolidation.
✅ Confluence
Price is currently hovering under resistance.
EMAs show short-term bullish momentum but could flatten if breakdown confirms.
Support near $1,635 is being tested – a break below could trigger the expected drop.
⚠️ Trading Implications
Short Setup: A trader might look to enter short around $1,647 if breakdown confirmation occurs.
Stop Loss: Just above the resistance zone (~$1,650+).
Take Profit: Near $1,470 zone.

BUY ETHEREUM ⧫ - 1DEthereum has been one of our favorite and strong project, from the past few months it has been continue increasing, thus not giving a chance to buy at cheap, but now is the time to build some positions as the price drops to $3300 (nearly 6%) from the recent highs. Considering this Bull market, Ethereum will make new all time highs .
Must use stop loss in trading , this is my personal view and not a financial advice. Cryptocurrency market is highly volatile and thus can lead to financial loss, kindly #DYOR.

eth analysis for a month where it goeseth analysis for a month where it goeseth analysis for a month where it goes

This is the first case which should be on eth like cup and handlThis is the first case which should be on eth like cup and handle follow and make a new high to 7k to 10k in the next few months so eth has potential to make 10x to 20x returns in the next few months

My Pick for this year Crypto ??? is Ethereum (ETH)ive used schiff picthfork, trend based fib extension, chart pattern , support resistance to get this level and conclusion
NOTE ; This could be long term call, buy eth at cmp my stop loss will be 1100 and target will be 2000 & 3500

ETHUSD Longs view points for December and jan 2024ETHUSD Longs view points for December and jan 2024
ETHUSD above the 2120-40 is the golden zone for longs .
2120-2140 important because so many times to break at this points ....if break upside then long side party enjoy 😂😂
Up trending frp0om downside .(1530)


ETHEREUM (ETHUSD) breaoutbeautiful breakout can lead to a long bull run. Triangle breakout and also flag breakout at the end very strong conviction.

Reaching at 1800$ETHUSD is forming a correction & expecting to reach at 1800$ & has potential movement to the upside.

Ethereum/USD Uptrend movement potential with RISK:REWARD 2.46Ethereum/USD Uptrend movement potential with RISK:REWARD 2.46
Symbol Ethereum/US dollar
Time frame :4 hours
Analysis :There is a break out from the symmetrical Triangle and the price is rallying on the up side .So, We will check the condition for Uptrend movement .Moving average ,MACD and PIVOT point condition is checked for uptrend movement. BUy call above 2025 which stop loss 1856 and we can expect a target of 2433.
HOPE our analysis is adding value to your Trading Journey.
NOTE: Published Ideas are for ‘’EDUCATIONAL PURPOSE ONLY’’ trade at your own risk.
NOTE: RESPECT The risk. SL should not be more than 2% of the capital.
Happy Trading

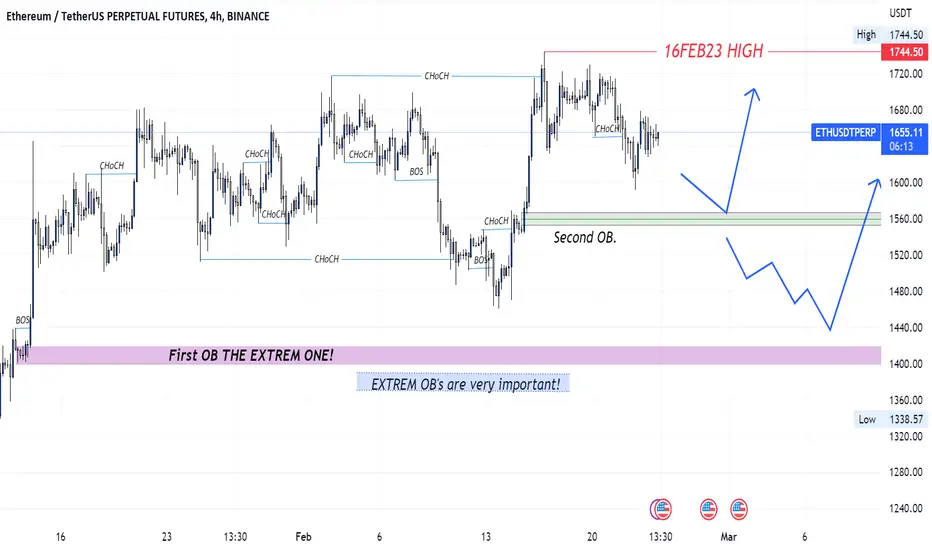
THIS IS ETHEREUM TETHERUSETHEREUM is in UP trend moving UP since 01JAN23 on 14JAN23 we can see HUGE BULL CANDLE and I found my BOS so I marked my OB first OB on 4H.
On 15FEB23 saw couple of BIG BULL CANDLE and that's my second OB.
ETHEREUM market showing BIG CANDLES with BIG WICKS!
If market break second OB and went down then what? NO WORRIES!!!
Because we have EXTREME OB already and never underestimate the Extreme OB so our first OB is UNMITIGATE since 13JAN23 once first OB mitigate we can go for LONG and we can use Trailing SL.
eth death is still on play if u r on long be carefullbearish flag pattern on higher time frame
eth death is still on play if u r on long be carefull
if eth falls matic shiba & all eth based coins will fall
eth to fall all time low BINANCE:ETHUSDT BITSTAMP:ETHUSD CRYPTOCAP:ETH
