ETHUSD SHOWING A GOOD DOWN MOVE WITH 1:8 RISK REWARDETHUSD SHOWING A GOOD DOWN MOVE WITH 1:8 RISK REWARD
DUE TO THESE REASON
A. its following a rectangle pattern that stocked the market
which preventing the market to move any one direction now it trying to break the strong resistant lable
B. after the break of this rectangle it will boost the market potential for break
C. also its resisting from a strong neckline the neckline also got weeker ald the price is ready to break in the outer region
all of these reason are indicating the same thing its ready for breakout BREAKOUT trading are follws good risk reward
please dont use more than one percentage of your capitalfollow risk reward and tradeing rules
that will help you to to become a bettertrader
thank you
Ethusdshort

ETHUSD - Are Bears Ready for the Fall?ETHUSD on the 4H timeframe is clearly in a corrective downtrend, not a healthy bullish structure. The price action fits an Elliott Wave decline where wave 3 already completed near 2620 , followed by a weak and overlapping recovery that looks like wave 4. That recovery stayed inside a falling channel and never showed impulsive strength, which already tells you buyers are weak. More importantly, wave 4 is flirting with wave 1 territory, which puts the entire bullish hope on thin ice.
Right now, ETH is at a make or break zone. If this move is just a fake breakdown, price must quickly reclaim the channel and hold above recent highs. If not, then this is likely wave 5 of C, and downside continuation becomes the dominant scenario. The structure favors a final flush toward the 2380 to 2350 area, where wave 5 projection and channel support align. Anyone blindly bullish here is ignoring structure. This is not a buy the dip market, it is a wait for confirmation or respect the downtrend market.

ETHUSD Bull Trap? - Final Breakdown Setup Is Almost Locked InETH is still stuck inside a clear falling channel, and the entire pattern is behaving like a corrective downtrend. The recent bounce from 2620 looks sharp, but it’s still just a counter-trend move. Nothing here screams trend reversal yet.
Wave 3 ending at 2620 , and now the price is rising for a Wave 4 retracement. Wave 4 usually moves back toward the mid-channel and tests previous breakdown zones.
The red box around 3200–3300 is the key trap zone. This is where sellers can return because Wave 4 must not enter Wave 1 territory, which sits higher. As long as ETH stays under that invalidation level, the bearish structure remains fully intact.
The move looks like a classic (a)-(b)-(c) correction inside Wave 4. Once this corrective bounce completes, the chart suggests ETH will resume the downward path. The channel alignment and wave symmetry both support a final Wave 5 drop.
If the bearish count plays out, ETH could slide toward 2400 – 2300 in Wave 5 before a major bottom forms. That’s the zone where sellers exhaust and buyers take control again. Until ETH breaks the invalidation level with strength, downside remains the more probable outcome.
Stay Tuned!
@Money_Dictators

ETHUSD: Reversal or Another Bull Trap?Look at this:
ETH played the trap perfectly. After pushing into the 3200–3400 resistance zone, price failed to sustain above it and rolled over, confirming that the move was distribution, not strength. Sellers stepped in exactly where a Wave 4 rally should fail.
The rejection was followed by a clean breakdown of the parallel rising channel, which shifts the short-term bias back in favor of the bears. That channel was the last structure holding the corrective bounce together. Once it broke, the bullish case weakened sharply.
This drop reinforces the view that the move up from 2620 was only a Wave 4 correction, not the start of a new trend. With Wave 4 likely complete, ETH appears to be transitioning into Wave 5 of the broader corrective decline.
As long as price remains below the broken channel and prior resistance, downside continuation remains the dominant scenario. The structure opens the door for a retest of 2620 , with a deeper extension toward 2465 if selling pressure accelerates.
Until ETH reclaims the channel with strength and acceptance, this remains a sell-the-bounce environment. The warning came at the trap zone, and the market is now following through.
Stay Tuned!
Money Dictators,
R.D :)

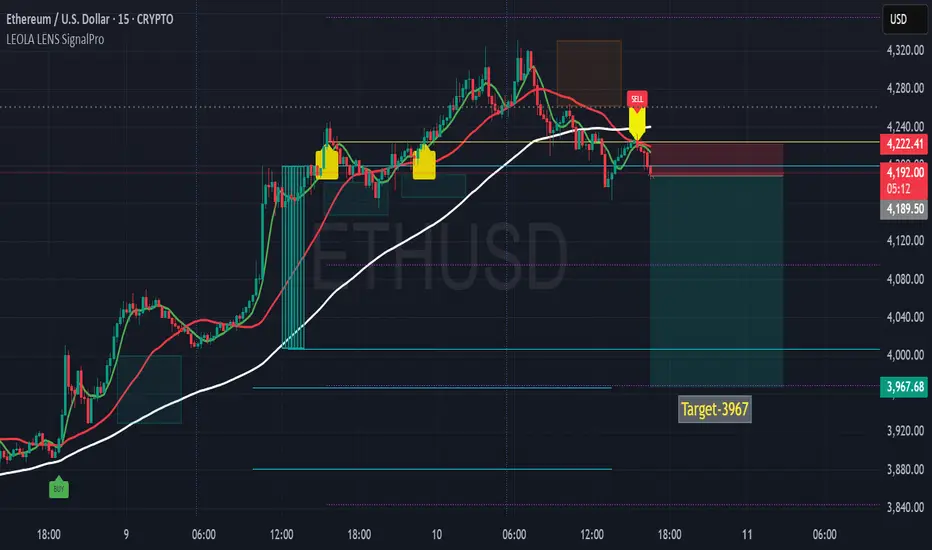
ETHUSD-15MIN SHORT Setup After Supply RejectionThis chart highlights a potential short trade opportunity on ETHUSD following rejection at the overhead supply zone.
Technical Notes:
Yellow caution markers signaled earlier high-probability trend shift points.
Price tested the zone near 4,240, where prior selling pressure emerged.
The recent SELL marker aligned with a break below the moving average, confirming bearish bias.
Liquidity levels below remain untested, offering a possible draw toward the 3,967 target.
Stop-loss placed above recent highs to maintain favorable risk-to-reward.
Bias: Bearish toward target area unless price reclaims and sustains above supply zone.
Disclaimer: This analysis is for educational purposes only and does not constitute financial advice. Trading and investing involve risk, and past performance is not indicative of future results. Always conduct your own research before making trading decisions.
ETH/USD Bearish Reversal Setup – Targeting $1,470 After ResistanPair: Ethereum / U.S. Dollar (ETH/USD)
Exchange: Coinbase
Timeframe: 15 minutes
Indicators:
EMA 30 (red line): ~1635.82
EMA 200 (blue line): ~1585.79
🟣 Key Levels & Zones
Resistance Zone (Purple Rectangle Top): Around $1,647 – previously tested and rejected.
Support Zone (Purple Rectangle Bottom): Around $1,470 – marked as the "EATARGET POINT".
Current Price: ~$1,645
📉 Bearish Breakdown Setup
Chart Pattern: There’s a potential double top or distribution zone forming near the resistance.
Projection: The price is expected to break below the smaller support zone and drop to the target zone around $1,470.67, representing an 11.13% drop.
Measured Move Tool: Indicates a bearish price target if the price breaks down from the current consolidation.
✅ Confluence
Price is currently hovering under resistance.
EMAs show short-term bullish momentum but could flatten if breakdown confirms.
Support near $1,635 is being tested – a break below could trigger the expected drop.
⚠️ Trading Implications
Short Setup: A trader might look to enter short around $1,647 if breakdown confirmation occurs.
Stop Loss: Just above the resistance zone (~$1,650+).
Take Profit: Near $1,470 zone.

ETHUSD SHOWING A GOOD DOWN MOVE WITH 1:7 RISK REWARDETHUSD SHOWING A GOOD DOWN MOVE WITH 1:7 RISK REWARD
DUE TO THESE REASON
A. its following a rectangle pattern that stocked the market
which preventing the market to move any one direction now it trying to break the strong resistant lable
B. after the break of this rectangle it will boost the market potential for break
C. also its resisting from a strong neckline the neckline also got weeker ald the price is ready to break in the outer region
all of these reason are indicating the same thing its ready for breakout BREAKOUT trading are follws good risk reward
please dont use more than one percentage of your capitalfollow risk reward and tradeing rules
that will help you to to become a bettertrader
thank you

$ETH Short Selling (High Risk Short-term Trade)$ETH Short Selling (High Risk Short-term Trade)
EP:1644.17
SL: 1682.17
TP1: 1580.27
TP2: 1527.77
RRR: 1.69

💎 ETHUSDT : 200% Profit Potential in Next 6 Months💣💣💣💣last 2-3 weeks we seen huge buying in ETH coin, in upcoming months its going pump very hard.
entry and targets are given on the chart. Please Like and comment if there are any queries.
#bitcoin #altcoinseason #altcoin #altnews

ETHUSD Demand Zone 3929/ 3979
Buyers momentum are strong in past
strong bullish candlestick inverted hammer at support 4040
strong major support zone 3923
eth usd is minor bullish but major bearish
trend changed totally in last few days. upcoming days are bearish

ETH Head & Shoulder Pattern TA target $2059.65Eth is forming a Head and Shoulder pattern and it breakout already.
Testing the Horizontal green line was the confirmation, the technical target is $2059.65 but there is falling support line according to that I thing target is around $2155.46.
I show a Bearish Divergence ( Between Blue Vertical line).
Comment down your opinion about this pattern.


ETHEREUM Still goin good ETHEREUM as we shared, has given a good reversal from the support zone. Fibonacci 38.2% level and 200 MA has acted as a strong support.
Stay updated about Crypto news and different stock analysis on my blog & website
(Coinexpress.tech)

ETHUSDT(Support line breakout)ETHUSD (4H CHART) Technical Analysis
Support Breakout
ETH/USDT currently trading at $1442
Short Entry-level: $1470 - 1430
Stop loss: above $1670
Target 1: $1200
Target 2: $1045
Target 3: $915
Max Leverage: 2X
ALWAYS KEEP STOP LOSS...
Follow our Tradingview Account for more Technical Analysis Update, | Like, Share and comment your thoughts.

ETHUSD short at 369.22, Resistance at trendlineI will short ETHUSD because :
It is facing a strong resistance at the trend line .
Its not been able to break that trend line .
The price is again at the resistance trend line and may fall.
If it breaks the resistance trend line then we will be looking to buy.
Entry : 369.22
First Target : 365
Second Target : 361
Stop loss : 370

Divergence, for short term ETH might fall. There is a divergence between RSI and Price.. there might be a drop in price to 210'ish levels.

ETHEREUM to $84?ETHUSD had a nice pullback to the LOB V of the last crash. Although, It is struggling at the SnR zone. Secondly,The uptrend channel has been broken and sellers have arrived. A nice short to $84?


How's the 100$ Shitcoin ETH is going to perform?Not too much to say here. A non-leveraged trade on ETH/USD pair after looking at these bearish signs. We believe that it's going downtown harder this time.
A short between 170-175$ with stop above 195$.
Targets will be 150-130-110-90$.
The next volume break should be a Bearish one let's see.
In the long run we should remain Bullish for our top crypto investments.


