ETHEREUM 2026 ATH Price Forecast | Bitcoin Halving Cycle AnalysiThis study observes Ethereum’s historical behavior relative to Bitcoin halving events. The purpose is to highlight recurring market structure patterns, not to provide financial or investment advice.
Observed Historical Cycles
2016 Bitcoin Halving
~70% drawdown in ETH
~546 days of sideways accumulation
Followed by a multi-year expansion phase (~22,800% peak move)
2020 Bitcoin Halving
~75% drawdown in ETH
~546 days of consolidation
Subsequent expansion to ~$4,693 (+2,600% approx.)
2024 Bitcoin Halving (Current Cycle)
~66% drawdown observed
~609 days of consolidation (ongoing)
Market structure remains comparable to prior accumulation phases
Key Observation
ETH trading within the $2,600–$3,000 range aligns with previous long-term accumulation zones seen before historical expansion phases.
Forward-Looking Scenario (Cycle-Based Projection)
If historical rhythm continues, the next expansion window may extend into 2026, with hypothetical price zones often discussed by market participants between:
$10,000
$15,000
$18,500+
These levels represent cycle-based projections, not price guarantees.
Conclusion
Ethereum has historically followed a pattern of deep drawdowns, prolonged consolidation, and later expansion after Bitcoin halving events. Whether this cycle continues to rhyme remains to be confirmed by future market behavior.
This analysis is for educational and informational purposes only. Always conduct independent research and risk assessment.
ETHUSDT

$ETH at a Critical HTF Support Inflection.CRYPTOCAP:ETH at a Critical HTF Support Inflection.
$2,890 is the Structural Demand level.
Acceptance above this level Preserves Bullish Market Structure.
If Support Holds → Upside Continuation Toward $3,650 and $4,250.
Failure to Hold → Bullish Thesis Invalidated.
Binary Zone. Directional Expansion Pending.
NFA & DYOR

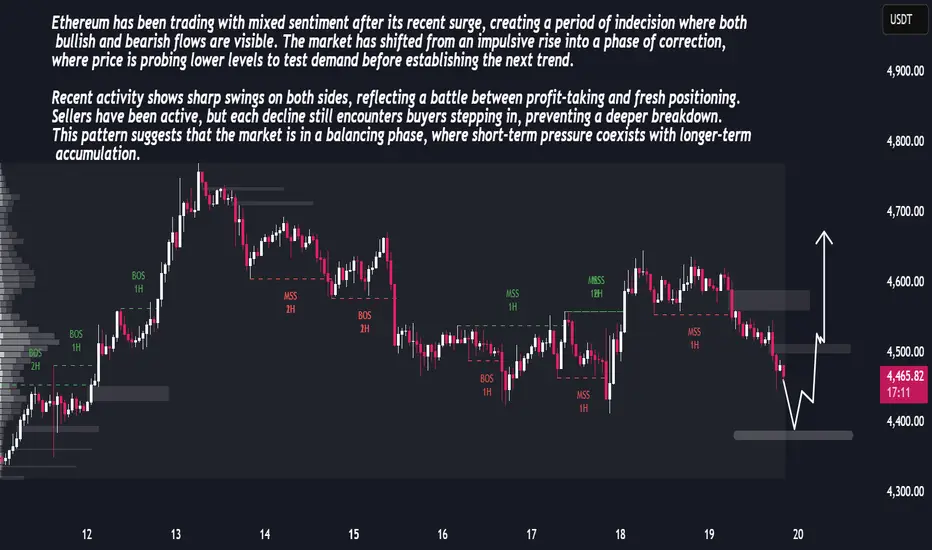
"ETH/USDT Forecast""ETH/USDT Forecast"
The market shows evidence of strong participation earlier, where price moved with speed and consistency, reflecting clear intent. That phase established direction and control without prolonged hesitation.
As price progressed, momentum began to ease. Movement slowed, reactions became more frequent, and volatility compressed. This change indicates a shift from active pressure to evaluation, where participants reduced aggression and allowed price to stabilize.
The subsequent recovery unfolded in a measured and uneven manner. Advances were short, overlapping, and lacked continuation, suggesting limited commitment behind higher prices. Opposing flow remained active, preventing expansion.
Currently, price behavior is defined by balance and compression. Activity reflects positioning rather than resolution. Until behavior shifts from overlap to decisive movement, the market remains in a waiting state, with continuation favored once imbalance returns.

ETHUSD Bull Trap? - Final Breakdown Setup Is Almost Locked InETH is still stuck inside a clear falling channel, and the entire pattern is behaving like a corrective downtrend. The recent bounce from 2620 looks sharp, but it’s still just a counter-trend move. Nothing here screams trend reversal yet.
Wave 3 ending at 2620 , and now the price is rising for a Wave 4 retracement. Wave 4 usually moves back toward the mid-channel and tests previous breakdown zones.
The red box around 3200–3300 is the key trap zone. This is where sellers can return because Wave 4 must not enter Wave 1 territory, which sits higher. As long as ETH stays under that invalidation level, the bearish structure remains fully intact.
The move looks like a classic (a)-(b)-(c) correction inside Wave 4. Once this corrective bounce completes, the chart suggests ETH will resume the downward path. The channel alignment and wave symmetry both support a final Wave 5 drop.
If the bearish count plays out, ETH could slide toward 2400 – 2300 in Wave 5 before a major bottom forms. That’s the zone where sellers exhaust and buyers take control again. Until ETH breaks the invalidation level with strength, downside remains the more probable outcome.
Stay Tuned!
@Money_Dictators

ETH/USDT Bullish Reversal SetupETH/USDT Bullish Reversal Setup
The chart shows a clear transition in ETH as price moves from a prolonged distribution-driven decline into a developing accumulation range. After weeks of consistent bearish structure, the market finally printed multiple upside shifts, signaling that sell-side pressure is weakening and liquidity behavior is changing.
The recent impulsive rally out of the discounted range confirms that buyers are actively defending lower levels. Price is now pulling back toward a short-term demand pocket formed during the breakout. This area represents the first meaningful accumulation zone after the market broke a series of internal swing points.
As long as price maintains stability within this demand block, the structure favors continuation toward the next major liquidity cluster above. The next upside draw is positioned around the 3,440–3,500 region, where previous inefficiencies and unmitigated zones converge. That region also holds resting buy-side liquidity, making it the logical target for a future expansion move.
The current market behavior suggests that ETH is in the early phase of a bullish repricing cycle. A controlled pullback into the highlighted zone—followed by a reaction—would confirm continuation and attract momentum buyers aiming for the higher liquidity magnet.
Overall, this chart reflects a shift in narrative: sellers are losing dominance, the market is building a fresh bullish structure, and the path of least resistance is gradually tilting upward as long as the demand zone remains protected.

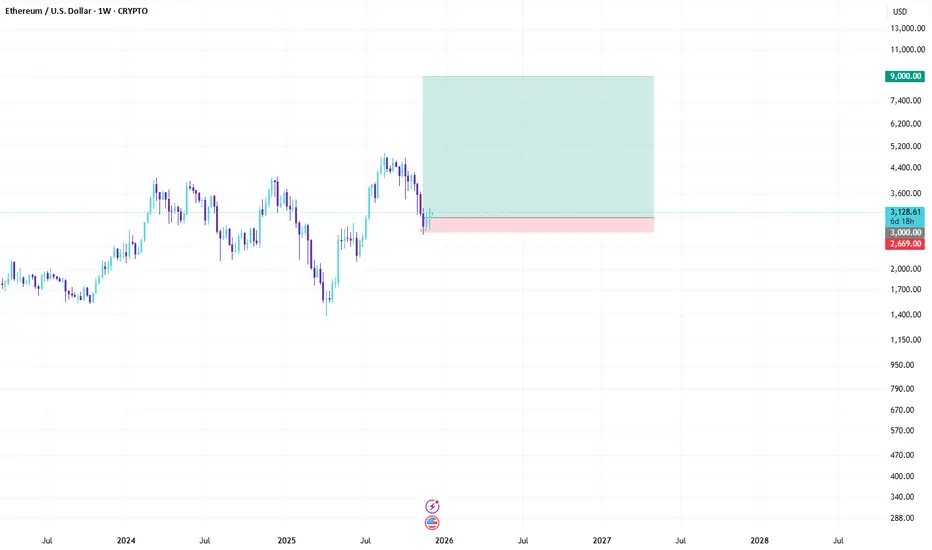
ETH Bullish Outlook: Tokenization Boom to $9K in 2026CRYPTO:ETHUSD
Asset: ETH/USD
Timeframe: Weekly
Hey traders! 🚀 Ethereum's dipping into December around $3,100 after some post-ATH consolidation, but the setup screams reversal. Fundstrat's Tom Lee is calling for a monster rally to $9,000 by 2026, fueled by tokenization exploding across finance. That's nearly 190% upside—ETH's about to steal the spotlight from BTC!
Key Analysis:
Macro Tailwinds: ETH's riding BTC's coattails but with extra juice from spot ETF inflows and real-world asset tokenization. As Wall Street piles in, expect ETH to decouple upward—watch for Nasdaq sync and weakening USD to amplify the move.
Technical Setup: Rock-solid support at $2,800, the recent higher low that's holding like a champ. Daily RSI oversold, bullish MACD crossover brewing, and on-chain metrics show whales accumulating. Smash $3,500 resistance, and we're blasting toward $4,500 next.
Risks: Near-term volatility if broader risk assets falter, but ETF demand and layer-2 scaling keep the floor intact for the long haul.
Trade Signal:
Entry: Long ETH/USD at $3,000 (confirmation above $2,800 support).
Target 1: $4,000 (short-term, ~30% gain).
Target 2: $9,000 (Tom Lee tokenization target by mid-2026).
Stop Loss: $2,700 (below key support to guard the downside).
Risk/Reward: 1:4+ on the primary target. Position size: 1-2% of portfolio.
Chart snapshot: Weekly candles forming a bullish pennant at $2,800, with Fibonacci retracement eyeing $9K extension. Overlay ETH ETF flows for that institutional vibe! (Pro tip: Compare with BTC dominance to spot ETH's breakout edge.)
Idea by Signal Squad
Published: December 8, 2025
What do you think, squad? ETH outpacing BTC in 2026, or more sideways grind? Drop your takes below—let's squad up! #ETH #CryptoSignals #SignalSquad
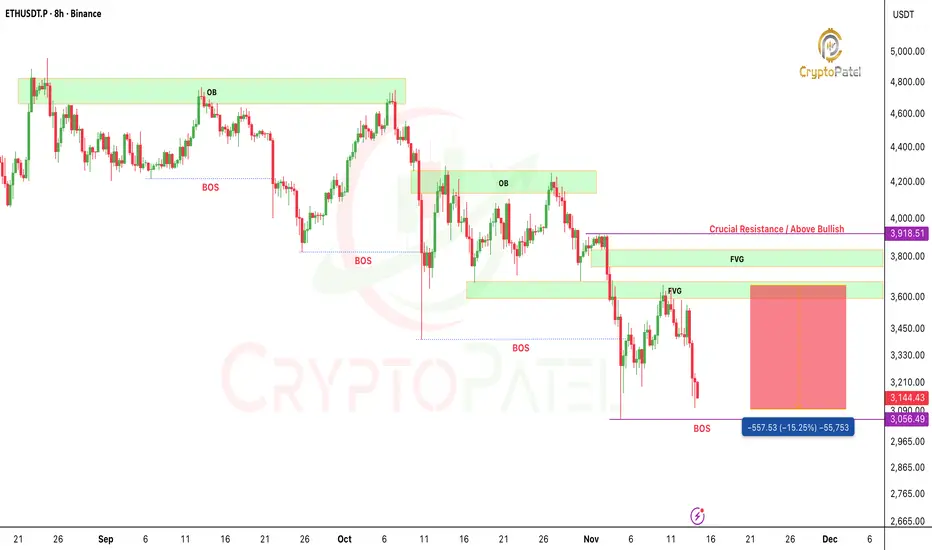
ETH Premium OB & FVG Zones – ChoCh Could Hit at $3,660ETH Premium OB & FVG Zones – ChoCh Could Hit at $3,660
Market remains in a Bearish Structure with steady LH → LL and clean BOS down. The current upward move is just a retracement into premium.
Key Zones:
FVG: $3,250–3,350 – First Reaction Zone for Short Entries
Bearish OB: $3,600–3,660 – Prime Supply Zone for Shorts
Shorting Strategy:
If you are Shorting ETH, these are the best levels to scale in.
Caution:
Any HTF candle closing above $3,660 Bearish OB signals a ChoCh. Exit shorts immediately, Trend flips bullish, opening the path toward new ATH.
Below $3,660 → bearish continuation likely
Above $3,660 → trend flip, bullish momentum expected
Until the OB break happens, bias stays bearish.
NFA & DYOR

ETH Could Skyrocket to $7.8K After FUSAKA Upgrade: History ShowsCRYPTOCAP:ETH Could Skyrocket to $7.8K After FUSAKA Upgrade – History Shows
The last Ethereum Pectra Upgrade on 7 May 2025 triggered a massive move:
✅ +55% in 35 days
✅ +168% in 109 days
What’s next?
The FUSAKA Upgrade is scheduled for 3 December 2025. If history repeats:
👉 Target 35 days post-upgrade: $4,500 (7 Jan 2026)
👉 Target 109 days post-upgrade: $7,800 (22 Mar 2026)
Note: This is Purely Fractal Analysis Based on Pectra. Always DYOR – Markets can behave differently, and “Sell the News” Scenarios Happen.
Get ready for a potential ETHEREUM rally!
NFA & DYOR

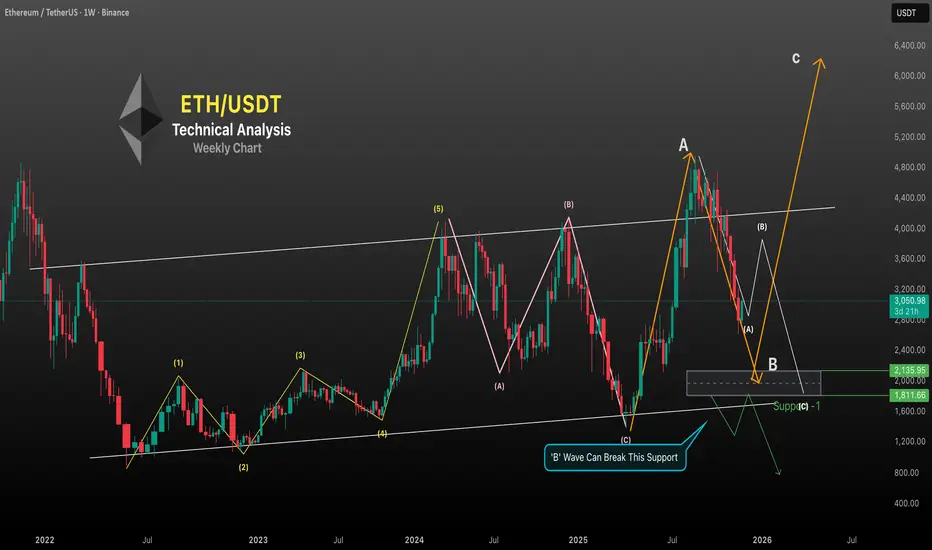
Ethereum – Elliott Wave Analysis (Weekly Chart)
#Phase 1:
Impulse Wave (1–5) Completed
ETH completed a 5-wave impulsive structure from the 2022 lows to the 2024 top:
Wave (1) – Initial reversal from the bear market bottom
Wave (2) – Deep corrective pullback
Wave (3) – Strong expansion wave (typically the largest, as shown here)
Wave (4) – Sideways consolidation within the channel
Wave (5) – Final push into the upper resistance of the long-term channel
This 5-wave structure completed near the $4,093 region.
#Phase 2:
ABC Corrective Pattern Playing Out
After the 5-wave completion, ETH entered a large ABC correction:
(A) Wave
A sharp drop from the top, marking the start of correction.
(B) Wave
A lower-high retracement that couldn’t break above the multi-year channel resistance — classic sign of a corrective rally.
(C) Wave
This wave completed near the lower boundary of the long-term channel (shown on your chart), fulfilling the ABC structure.
#Phase 3:
New Cycle – Larger ABC Structure Forming
After completing the previous ABC cycle, ETH started a new higher-degree correction:
Wave A (up)
A strong rally to ~4,956 created the larger-degree Wave A.
Wave B (current)
Price is now declining in a steep Wave B structure.
Your highlighted grey demand zone ($1,800–$2,200) is the most likely B-wave target.
Notes Must Read
B-waves often break support briefly, creating a sentiment trap
#Phase 4:
Wave C – The Big Expansion (2026?)
After Wave B finishes inside $1,800–$2,200, ETH is likely to start a massive Wave C.
Wave C is typically:
Impulsive
Equal to Wave A or 1.618× Wave A
Target 🎯 $6,000 – $6,400 region
This matches the Elliott Wave rule where Wave C often extends strongly after a deep B-wave.
~Disclaimer~
High Risk Investment
Trading or investing in assets like crypto, equity, or commodities carries high risk and may not suit all investors.
Analysis on this channel uses recent technical data and market sentiment from web sources for informational and educational purposes only, not financial advice. Trading involves high risks, and past performance does not guarantee future results. Always conduct your own research or consult a SEBI-registered advisor before investing or trading.
This channel, Render With Me, is not responsible for any financial loss arising directly or indirectly from using or relying on this information.
ETHEREUM ANALYSIS UPDATE:ETHEREUM ANALYSIS UPDATE:
Exactly as projected, CRYPTOCAP:ETH bounced perfectly from the 0.5 FIB retracement at $2,622.
That level has now transformed into a strong structural support, increasing the probability of an upside continuation and a potential run toward a new All-Time High.
But remember 👇
If Ethereum breaks below $2,622 (0.5 FIB), the market will likely hunt liquidity into the 0.618 Golden Zone or the Bullish Order Block before launching toward the $10K macro target.
Big dips = Big accumulation discounts. Stay strategic, not emotional.
1️⃣ $2,622 (0.5) – First Defense ✅
2️⃣ $2,256 (0.618) – Golden Zone
3️⃣ $1,821 (0.786) – Nuclear Support
NFA & DYOR

$ETH UPDATE – FVG FILLED & STRUCTURE CLEANEDCRYPTOCAP:ETH UPDATE – FVG FILLED & STRUCTURE CLEANED
CRYPTOCAP:ETH just bounced perfectly from the $2,880 FVG and the entire downside imbalance is now fully filled, meaning no remaining bearish FVGs below.
Structure is clean… Ethereum is now technically READY for upside continuation.
Only one concern:
👉 Bullish OB zones: $2,622 & $2,256
If we dip into these OB levels → that’s the BEST accumulation zone for a $10K–$15K ETH target in the next cycle.
Don’t miss any major dip on Ethereum imo.
Smart money accumulates when the chart is clean and now it is. 🚀
NFA & dYOR

#ETHEREUM Technical Update: $3000 Hit Exactly as Mapped#ETHEREUM Technical Update: $3000 Hit Exactly as Mapped
CRYPTOCAP:ETH has tapped the $3000 zone, exactly as projected when price was breaking down from the $4000 bearish breakdown + retest.
We’re now ~30% down from the short-entry region.
If you shorted, you booked heavy profits.
If you didn’t, at least you avoided longing the top above $4000+
This is where the prime accumulation zone begins.
Key levels to watch:
🔵 $3000: First accumulation zone + bullish OB (Possible bounce reaction from here.)
🔽 Next support: $2400
Major Accumulation Zones:
0.5 FIB: ~$2621
0.618 FIB: ~$2255
If ETH sweeps into these FIB/FVG pockets, that becomes the high-discount, prime long-term accumulation zone.
Macro view unchanged: Long-term Target: $10K–$15K
Stay patient. Stick to structure. Accumulate smart, not emotional.
NFA & DYOR

Warning: $ETH Is About to Hit Its Most Critical Zone of 2025!Warning: CRYPTOCAP:ETH Is About to Hit Its Most Critical Zone of 2025!
Macro Structure
ETH remains macro bullish, currently in a healthy correction after rejecting the premium zone near $4,960.
The strong displacement from $1,577 (0.618 Fib) confirmed bullish structure, but price is now retracing into discount levels.
Key Fibonacci Levels
Measured from $879 → $4,960, ETH is deeply entering ICT discount territory:
0.382 – $3,048 (Tested)
0.500 – $2,622
0.618 – $2,256 ← Top probability zone
0.786 – $1,821
FVG & OB Zones (Major Decision Area)
1️⃣ Unfilled FVG → $2,875
👉 This is the most important decision point right now.
👉 High probability that ETH will fill this FVG.
👉 If price holds above this FVG, bullish continuation becomes very strong.
👉 If ETH fails to hold $2,875, expect the correction to deepen.
2️⃣ Next Major Support
Bullish OB: $2,622 – $2,256
→ Perfect confluence of Order Block + 0.5/0.618 Fib.
👉 This is the strongest demand zone on the entire chart and a top accumulation area.
Expectations
Most likely:
ETH fills the $2,875 FVG, then either bounces → resumes uptrend
or
breaks down → moves into $2,250–$2,620 OB to accumulate before the next macro leg.
Targets After Correction: $4,058 / $4,960 / $5,800 / $7,200 (1.618 extension)
Conclusion
ETH remains strongly bullish on HTF.
Watch $2,875 FVG as the key decision level.
If lost → $2,250–$2,620 OB becomes the premium accumulation zone before ETH heads toward new ATH.
NFA. DYOR.

ETHEREUM Bearish Target achieved CRYPTOCAP:ETH has tapped the $3150–$3110 zone, a clean 15% move from our premium setup.
Perfect FVG fill + redistribution structure.
Huge profits for those who executed. Liquidity continues to lead.
NFA & DYOR
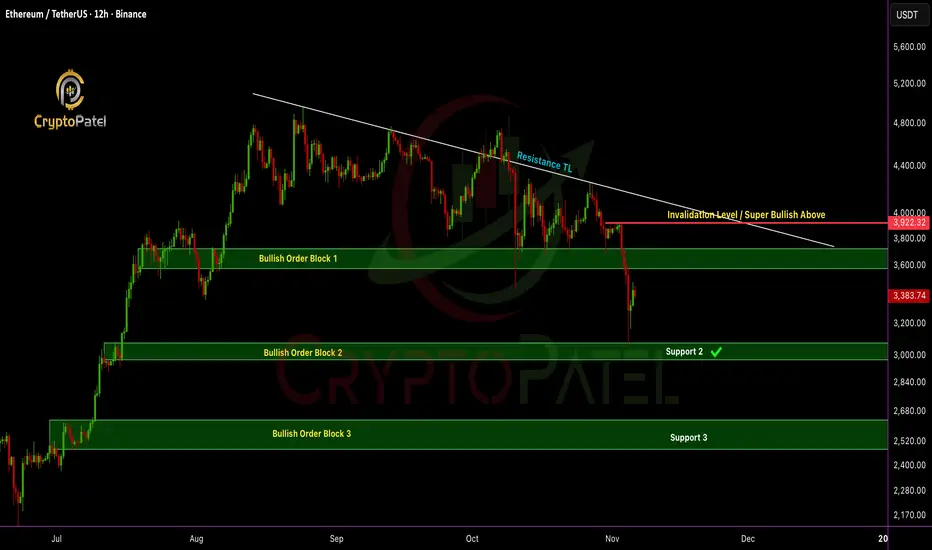
ETH/USDT dumped 20% after my analysisETHEREUM Update: Price just hit the bullish order block at $3,057 and bounced exactly as predicted ✅
Quick recap:
✅ Short-term: I’m bearish below $3,920, next potential leg down $2,500–$2,200 if $3,000 support breaks.
✅ Medium-term: Holding $3,000 support is key, could spark the next bullish wave.
✅ Long-term: Still super bullish & Target remains $10K–$15K ETH
Paper hands panic. Legends load the blood & hold.
Which one are you? 👇
NFA & DYOR
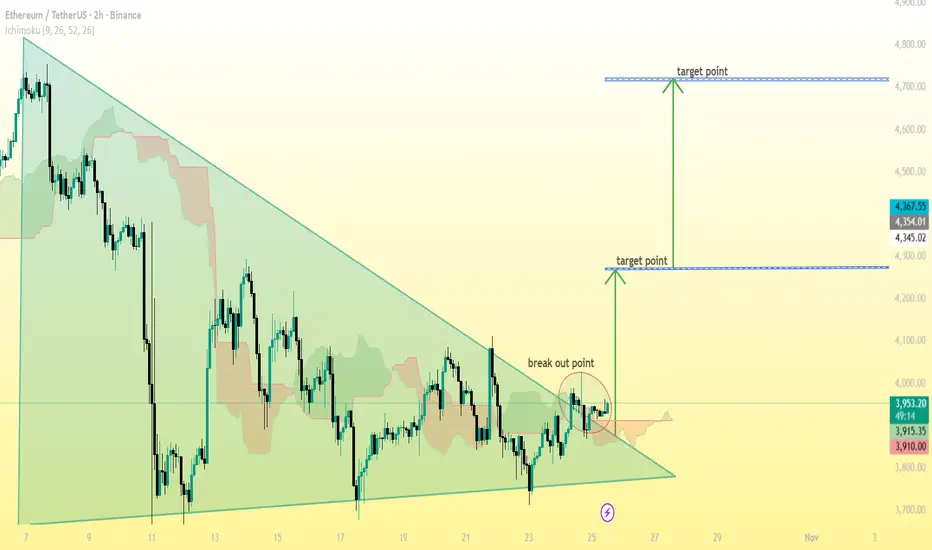
ETH/USDT (Ethereum vs Tether) on the 2-hour timeframe...ETH/USDT (Ethereum vs Tether) on the 2-hour timeframe, the pattern drawn is a symmetrical triangle — a consolidation setup that often leads to a strong breakout.
Here’s the target breakdown based on my chart:
---
📈 Current breakout level:
Around $3,950 – $3,960
🎯 Target 1 (short-term):
Around $4,350 – $4,370
This is the first target after the breakout, matching my chart’s lower target point.
(≈ +10% move from the breakout)
---
🎯 Target 2 (extended / major):
Around $4,700 – $4,750
This is the second target — the measured move from the triangle’s height projected upward.
(≈ +18%–20% move from the breakout)
---
⚠ Support / Stop-loss suggestion:
If price closes back below $3,900, it may invalidate the breakout and signal a false move.
---
✅ Summary:
Breakout point: $3,950
Target 1: $4,350
Target 2: $4,700
Stop loss: $3,900
ETH Eyes Upside RunEthereum shows signs of regaining strength after a prolonged corrective phase. The asset is currently stabilizing, supported by gradual inflows from institutional participants and renewed investor accumulation. Market behavior indicates controlled volatility, suggesting a preparation phase before a potential expansion.
Network data reflects consistent transaction activity, while liquidity concentration hints at sustained participation from long-term holders. The recent stabilization in funding rates and improved open interest add weight to the recovery outlook.
If momentum continues to build under these conditions, Ethereum could enter a structured growth cycle in the coming sessions.
Ethereum Accumulation Before BreakoutEthereum has regained bullish momentum after a recent correction phase, supported by improving sentiment in the broader crypto market. The asset is displaying early signs of stabilization as traders begin accumulating around value zones, indicating renewed confidence among market participants.
From a macro perspective, Ethereum continues to benefit from increasing network activity, particularly within the DeFi and Layer-2 ecosystems. The sustained growth in on-chain transactions and staking participation reflects long-term investor interest, adding strength to the current recovery phase.
Market data also shows that institutional inflows into major crypto assets are on the rise, with Ethereum standing out due to its strong fundamentals and ecosystem resilience. This inflow supports the likelihood of a continued price rebound, as liquidity and trading volume remain consistent.
Overall, ETHUSDT is showing a constructive recovery setup. The combination of improving sentiment, strong fundamentals, and gradual accumulation suggests a potential medium-term bullish continuation, provided global market conditions remain favorable.

Ethereum’s Next Move: $3,000 Buy Zone or $10,000 Breakout?Ethereum’s Next Move: $3,000 Buy Zone or $10,000 Breakout?
Current Market Overview:
Ethereum is currently trading below $4,000, indicating short-term weakness as bulls struggle to regain control. The $4,000 level remains a key pivot point, holding above it is essential for any sustained move toward higher targets.
Key Levels to Watch:
🔹 Immediate Resistance: $4,000
🔹 Major Support Zone: $3,000 – $2,600 (ideal accumulation area)
🔹 Upside Targets: $8,000 – $10,000 (if $4,000 is reclaimed)
Bullish Scenario:
If Ethereum breaks and holds above $4,000, it confirms bullish momentum and opens the path toward $8,000–$10,000 in the mid to long term.
Bearish / Accumulation Scenario:
If ETH remains below $4,000, expect a possible retracement toward $3,000 – $2,600. This zone could act as a strong accumulation area for long-term investors.
Outlook:
The broader structure remains long-term bullish despite short-term pullbacks. Dips into major support zones should be viewed as opportunities for strategic accumulation.
⚠️ Note: Always DYOR (Do Your Own Research) before making any investment decisions. This analysis is for educational purposes only.

Ethereum: Bullish or Bearish? The Path AheadEthereum is at a critical juncture on its 4-hour chart. The price recently touched $4,180 and has started pulling back. The Fair Value Gaps (FVGs) in the $4,000–$4,100 zone suggest the market might revisit this area for a quick rebalancing before confirming the next move. In the short term, this is an important support level where the buyers will likely test their strength.
Trading volume spiked towards the end of September, showing that demand remains solid. However, the resistance at $4,180 could lead to a pullback towards the $4,100–$4,050 region before ETH gathers enough momentum for the next leg up. If the support holds, Ethereum might continue to rise towards $4,300, and even up to $4,500–$4,600 if resistance is broken.
That being said, the upcoming market volatility is likely to be driven by the US economic data, especially the NFP report. A weak report could spur expectations of a policy easing, which would benefit ETH, while strong data might trigger a pullback. Moreover, geopolitical tensions and the looming risk of a US government shutdown remain as wild cards that could shake things up.

ETHUSDT: Strong Uptrend with Solid SupportETHUSDT is currently experiencing a strong uptrend driven by the stability of the cryptocurrency market and strong fundamental factors. Despite some recent pullbacks, the primary trend remains bullish, supported by a solid foundation and positive investor sentiment.
Technical Analysis: ETHUSDT is currently testing a key support level at 3,985. If this level holds, there is a high probability of a rebound and continued upward momentum. The next resistance level is expected at 4,215.
Trading Strategy: If the price stays above the support level at 3,985, ETH is likely to continue rising towards the next resistance levels.
Outlook: Given the current fundamentals and technical indicators, ETHUSDT is likely to maintain its upward trajectory and target the 4,215 resistance level in the near future.

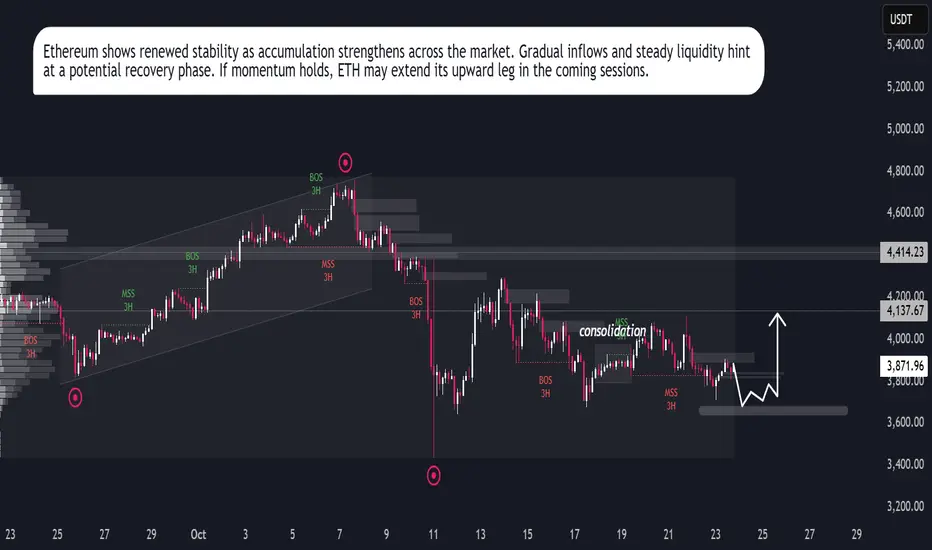
ETH Price Outlook – Consolidation Phase Before ExpansionETH Price Outlook – Consolidation Phase Before Expansion
Ethereum has been trading with mixed sentiment after its recent surge, creating a period of indecision where both bullish and bearish flows are visible. The market has shifted from an impulsive rise into a phase of correction, where price is probing lower levels to test demand before establishing the next trend.
Recent activity shows sharp swings on both sides, reflecting a battle between profit-taking and fresh positioning. Sellers have been active, but each decline still encounters buyers stepping in, preventing a deeper breakdown. This pattern suggests that the market is in a balancing phase, where short-term pressure coexists with longer-term accumulation.
The overall structure points toward a scenario where current weakness may serve as a preparation stage for another expansion move. Volatility is likely to remain elevated, and once liquidity pockets are cleared, momentum could shift more decisively, paving the way for stronger directional movement.
#ETHEREUM – Macro Breakout Setup#ETHEREUM – Macro Breakout Setup 🚀
▶️ 6th time in history testing $4K macro resistance.
▶️ A clean weekly close above could ignite HTF expansion to $8K → $10K → $15K.
6 rejections in 4 years… one breakout can change it all.
NFA & DYOR
