NZDCADThe pair remains in a downtrend and overall bearish, but I see a potential counter-trade opportunity. This could set up as a “buy to sell” scenario. I’ll be watching for a possible bounce toward the upside before resuming shorts. First area of interest is around the 0.8100 level, where I’ll wait patiently to see how price reacts.
EUR (Euro)

EURNZDPrice action has been strongly bullish, with an impulsive push to the upside that took out a weekly high. That may have completed the price objective, which is why I’m now expecting a potential drop. A structure shift has already occurred and an entry was available, though I didn’t take it.
For now, I’ll stay on the sidelines and watch price action. If price reaches the demand zone, I’ll look for confirmation to get into longs. There’s also a large inefficiency/price void that could be filled on the way down. Let’s see how this pair develops — just sharing a possible scenario.

NZDJPY SELLSNZDJPY tapped the top of daily supply, aligning with the 88.0 region. While 4H structure is bullish, higher timeframes take priority. Price already flipped 15M structure, giving early bearish confirmation. Short makes sense here with a conservative stop above the daily high. And also if you look at the daily timeframe you can see how bears are in control, 3 times stronger.
Couple of downside targets so let's see.

EURUSD – Head and Shoulders Breakdown in Play!!The chart is showing a clear Head and Shoulders formation, a bearish reversal structure that signals the market may be preparing for a deeper drop if neckline support gives way.
Chart validation:
Left Shoulder, Head, and Right Shoulder are well-defined.
The neckline sits around 1.1646 – this is the critical level to watch.
Current price is hovering above the neckline, but pressure is building on the downside.
Invalidation sits above 1.1850 – if price pushes past this level, the bearish setup is negated.
Targets from the structure:
A clean break below 1.1646 confirms the pattern.
Measured move points towards 1.1430 area as the downside objective.
Along the way, short-term jolts could test 1.1550, but the major momentum favors sellers if neckline breaks.
Trading view:
As long as EURUSD stays below the right shoulder resistance and 1.1850, bias leans bearish. The neckline is the trigger – once broken, the head and shoulders formation comes into full effect, opening space for a sharper correction.Trade safe !!

EUR/USD is entering a decisive SMC zone – Big move loading...📊 EUR/USD H4 – SMC Mapping & Trading Plan
1. Market Structure
Main trend: bearish (after clear CHoCH and BOS).
Price has formed Equal Highs (EQH) → strong liquidity above.
Untested liquidity zone below (OBB) → expectation for price to sweep down.
2. Key Zones
Supply Zone (OBS + FVG):
1.18100 – 1.18200
This supply aligns with the Fair Value Gap.
Expecting price to retest this zone and reject downward.
Demand Zone (OBB):
1.16500 – 1.16650
Strong demand zone combined with liquidity resting below previous lows.
3. Trade Logic (SMC Flow)
Scenario 1 (Short Setup):
If price reaches the OBS + FVG (1.1810 – 1.1820) area,
Expect bearish reaction → Sell setup.
SL: above 1.1830.
TP: demand zone at 1.1650.
Scenario 2 (Long Setup after liquidity sweep):
If price taps into OBB (1.1650 – 1.1665) and holds,
Expect bullish reaction → Buy setup targeting 1.1750 – 1.1780.
SL: below 1.1630.
4. Market Psychology
Buy side: attempting to push higher but likely just a pullback to fill FVG and sweep liquidity above EQH.
Sell side: in control after BOS to the downside, targeting demand below.
Flip Zone: once supply is broken, it may flip into a new reaction zone (support).
✅ Summary Plan
Sell Zone: 1.1810 – 1.1820 → TP 1.1650
Buy Zone: 1.1650 – 1.1665 → TP 1.1750

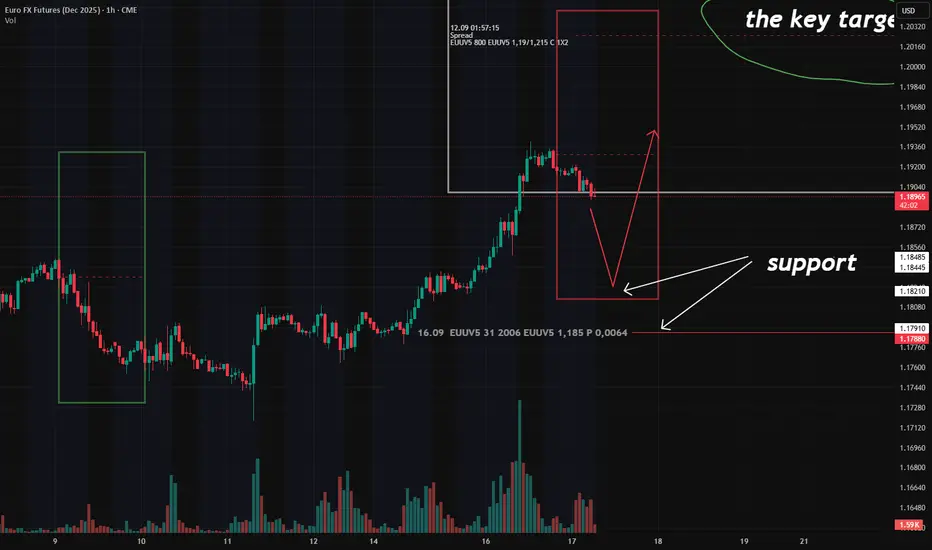
Market Sentiment: Optimism for Euro – But Here’s My Plan According to last CME report, there’s clear bullish sentiment across major currencies trading against the US dollar.
We’re seeing naked calls placed at multiple levels above current prices:
1.38 on GBP
1.295 on CHF
In other words: options traders are pricing in further USD weakness.
This aligns with earlier signals:
1.The JPY 'Butterfly' (still active)
2. The EUR 'Ratio spread' — also still in play
So what’s my move today?
✅ First: I exited all positions this morning.
No overexposure ahead of the Fed decision.
🎯 Now: I’m watching for long entries near the ER zone (see chart).
Notably, just below ER low boundary - put at 1.185 (act as support), which appeared in the report.
The option is worth ~$900K — not huge, but significant enough to catch my eye.
I’ll watch closely — and only enter if price respects it.
EURNZDEURNZD Market Outlook
The price on EURNZD has recently approached the 4H Supply Zone around the 1.96000 level and has flipped the short-term bearish structure, indicating potential bullish momentum. However, given the presence of supply, I'm monitoring the possibility of a retracement from this zone.
My primary scenario involves a short-term rejection from the 1.96000 Supply Zone, targeting a move down into the 1.94000 Demand Zone. From there, I will look for a sell-to-buy setup, with the intention of positioning for a larger upside continuation, provided bullish order flow confirms.
Alternatively, if buyers prove to be significantly strong and supply fails to hold, price may break through the 1.96000 zone and extend higher towards the daily wick area near the 1.98000 level.
Both scenarios remain valid depending on price action and volume behavior at key levels.
Will be watching 15min structure before entering any trade.

EURUSD SHORT - 15M/1HFOREXCOM:EURUSD
Hello traders , here is the full multi time frame analysis for this pair, let me know in the comment section below if you have any questions, the entry will be taken only if all rules of the strategies will be satisfied. wait for more Smart Money to develop before taking any position . I suggest you keep this pair on your watchlist and see if the rules of your strategy are satisfied...
Keep trading
Hustle hard
Markets can be Unpredictable, research before trading.
Disclaimer: This trade idea is based on Smart money concept and is for informational purposes only. Trading involves risks; seek professional advice before making any financial decisions. Informational only!! !

EUR/USD Potential Rejection from ResistanceTechnical Overview:
The EUR/USD chart exhibits signs of a bearish reversal pattern forming near a key resistance zone (1.15800 - 1.16000), highlighted with repeated rejection wicks (🔴 red arrows). Price is currently trading at 1.15222, after failing to hold above the neckline of the rounded bottom pattern.
🔍 Key Observations:
🔺 Resistance Zone: Strong resistance has been confirmed multiple times (red arrows), indicating sellers are active at the top.
🟠 Double Top / Head & Shoulders Behavior: Price action shows topping formations (highlighted with orange circles), suggesting exhaustion of bullish momentum.
📉 Bearish Breakdown Possibility:
Price rejected near neckline and is showing bearish candle formations.
Breakdown from the current consolidation zone could push price toward the target zone at 1.14491, marked in purple.
This aligns with previous support structure, reinforcing a technical downside projection.
🔻 Support Zone: Around 1.13800 - 1.14000 is a strong area of demand and may act as the next bounce point if the bearish move continues.
📐 Chart Pattern Structure:
Rounded bottom formed earlier, but the failure to continue higher and breakout suggests a false breakout trap for buyers.
Downward sloping trendline broke, but now price is struggling to sustain above previous highs.
📌 Conclusion:
⚠️ Caution for bulls as price shows signs of weakness at resistance. A move below 1.15000 may initiate further downside toward 1.14491 and possibly lower. Short-term traders can watch for confirmation candles near this zone for entries.
📅 Short-Term Bias: Bearish
🎯 Target: 1.14491
⛔️ Invalidation: Strong breakout above 1.16000

EUR/USD Potential Reversal from Resistance Zone –Bearish OutlookThe EUR/USD pair has been trading within a well-defined ascending channel for several weeks. Price recently tested a strong resistance zone near 1.15850 – 1.16000, which aligns with the upper boundary of the channel and a previously marked supply area.
Key observations:
The price action shows signs of rejection from the resistance zone with a potential double-top or fakeout pattern forming.
A projected bearish trajectory is marked, suggesting a possible break below the channel support.
Immediate bearish targets are set at key demand zones around 1.14500, 1.12500, and further down to 1.10500.
A large red arrow indicates the strong downside bias if the price confirms the breakdown.
Conclusion:
If EUR/USD fails to sustain above the 1.15850 resistance zone and breaks below the ascending channel, a strong bearish correction is anticipated. Traders should watch for confirmation of the breakdown before entering short positions.

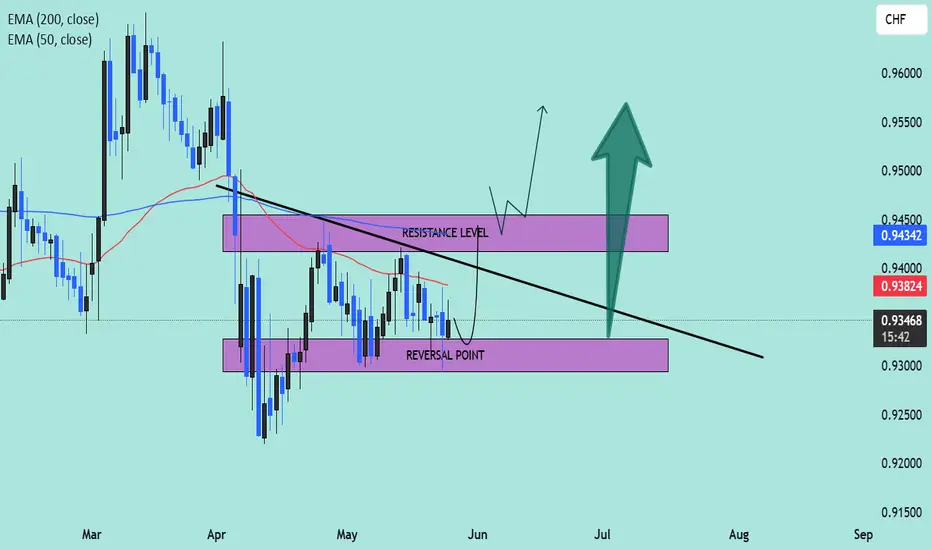
EUR/CHF Technical Outlook – Potential Bullish Reversal Setup📈 Pair: EUR/CHF
📆 Date: May 27, 2025
📊 Timeframe: Daily (D1)
📌 Technical Highlights:
🔹 Current Price: 0.93456
🔹 Key Indicators:
50 EMA (Red): 0.93824
200 EMA (Blue): 0.94342
🧠 Chart Analysis:
🔻 Downtrend Resistance Line: A clear descending trendline is pressing price lower, reinforcing a bearish structure since March.
🟣 Reversal Zone (Support Area):
Price is currently hovering just above the marked Reversal Point, a demand zone between 0.93000–0.93400. Historically, this zone has acted as a launch pad for upward momentum.
🟪 Resistance Level:
Located around 0.94300–0.94600, this zone is reinforced by the 200 EMA, making it a critical breakout area. A strong bullish close above this region could invalidate the downtrend.
🔄 Two Scenarios to Watch:
✅ Bullish Breakout Scenario:
Price may bounce from the reversal zone.
A break and retest above the resistance level could lead to bullish continuation toward 0.9500–0.9550.
Confirmation above the 200 EMA will add confidence to the breakout.
📈 Potential Buy Entry: On breakout and retest of 0.9450
🎯 Target: 0.9550
🛡️ Stop Loss: Below 0.9320
❌ Bearish Continuation Scenario:
If price fails to hold above the reversal point, sellers may regain control.
A breakdown below 0.9300 could trigger further downside toward 0.9200 or lower.
📉 Sell Setup Invalid Until: Price closes below 0.9300 on strong volume.
🧭 Conclusion:
This chart suggests a critical decision point for EUR/CHF. A bounce from the reversal zone followed by a confirmed break above resistance could signal the start of a medium-term uptrend. Traders should monitor price action closely for confirmation signals near the trendline and EMA zones.
🚦 Bias: Neutral to Bullish, awaiting confirmation
🧠 Tip: Watch for candlestick patterns (like bullish engulfing or pin bars) near the support zone for early entries.
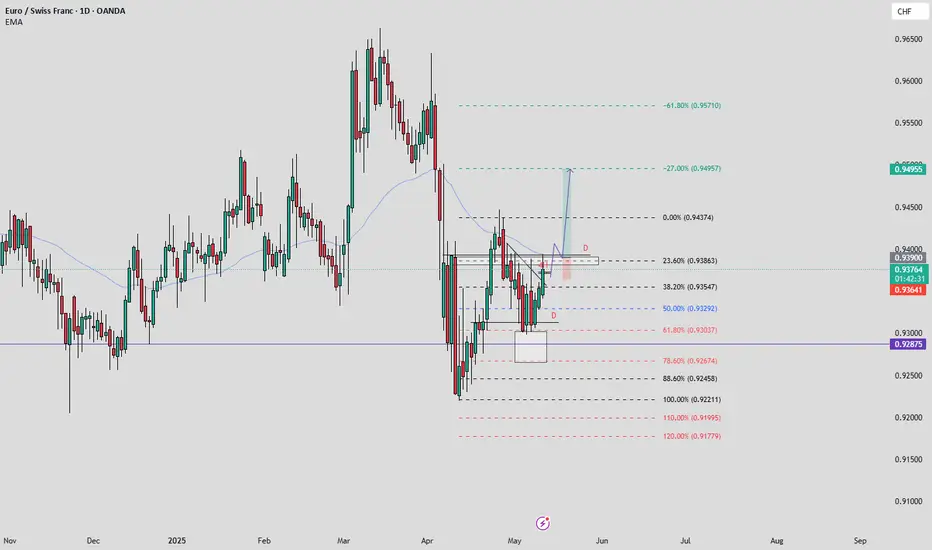
EURCHF LONGHey everyone
Im looking for a Buy after we break the Daily/4H resistance and retest from it but also we have mulitple confirmation:
1) Daily bullish, 4h bullish
2) after we break above our daily support we went down to retest our 61.80% Fib level
3) break our counter trend line and retest it
4) we need to break above our Daily/4H resistance level and wait for an engulfing bullish 1h/30 and then will get in
Good luck!!
EUR/NZD Wave Structure Shift: 4th Wave Correction in ProgressThe 3rd wave in EUR/NZD appears to have been completed, and the market seems to be entering the 4th wave. There is a possibility that the 4th wave could take support near the Fibonacci 0.5 level (1.19164). After that, the 5th wave of the impulse phase may move upward.
If the market falls below 1.98303, it would confirm the beginning of the 4th wave. In that scenario, the first target could be around 1.95907 .

EURCHF - BEARS ARE READY TO PUSH PRICE LOWERSymbol - EURCHF
CMP - 0.9397
EURCHF has breached its trend support, disrupting its overall bullish structure. The strengthening of the US dollar is exerting downward pressure on the forex markets.
The fundamental outlook for the Eurozone remains highly negative, primarily due to the policies of the Trump administration and broader US economic conditions, particularly with regard to the ongoing tariff dispute. The strengthening dollar generally creates a challenging environment for the markets.
From a technical perspective, following the breakdown of the uptrend's support, bearish sentiment is solidifying as prices remain within the selling zone, confirming the dominance of the bears.
Key resistance levels: 0.9380, 0.9417
Key support levels: 0.9329, 0.9294
While a retest of the reversal zone at 0.9400 is possible, attention should currently be directed to the 0.9380 level. A sustained consolidation below this level could trigger further downward movement.

EUR/NZD 4-Hour Chart AnalysisKey Observations:
1. Support Zone:
- The price is currently testing a key support zone around 1.82880–1.83160.
2. Uptrend Break:
- The ascending trendline has been broken, indicating a potential shift in momentum from bullish to neutral/bearish.
3. Trading Ranges:
- Resistance Above: Potential resistance is visible near 1.8450–1.8500, in case of a bullish recovery.
- Support Below: If the price breaks below the current support, the next levels to watch are:
- 1.8143 (intermediate support).
- 1.7986 (major support).
- 1.7806 (long-term support).
---
Trading Scenarios:
1. Bullish Continuation:
- If the price holds above 1.8315, a bounce toward the previous highs near **1.8450–1.8500** is possible.
- Entry: Above 1.8350.
- Targets: 1.8450, 1.8500.
- Stop-Loss: Below 1.8300.
2. Bearish Breakdown:
- If the price closes decisively below 1.8315, it could trigger further downside toward 1.8143 and possibly lower.
- Entry: Below 1.8300 (watch for retest).
- Targets: 1.8143, 1.7986, 1.7806.
- Stop-Loss: Above 1.8350.
---
- Be cautious of false breakouts and wait for confirmation (such as a strong candle close) before entering trades.
- Use proper risk management with defined stop-loss and target levels.
---
Disclaimer:
This analysis is for informational purposes only and does not constitute financial advice. Trading involves substantial risk, and past performance is not indicative of future results. Always conduct your own research and consult a financial advisor before making investment decisions. Trade responsibly.

EURNZD - OrderFlow The bullish trend is currently very strong on EUR/NZD. As long as the price remains above the support at 1.8050 NZD, you could try to benefit from the boom.

EURGBP - TRADE IDEA ON LONG SIDE FOR HUGE PROFITSymbol - EURGBP
EURGBP is currently trading at 0.8272
I'm seeing a trading opportunity on buy side.
Buying EURGBP pair at CMP 0.8272
I will be adding more if 0.8245 comes & will hold with SL 0.8225
Targets I'm expecting are 0.8345 - 0.8370 & above.
Disclaimer - Do not consider this as a buy/sell recommendation. I'm sharing my analysis & my trading position. You can track it for educational purposes. Thanks!

EURNZDLet's look at EurNzd for the next week. As you can see price made a nice push up and now naturally I would like to see the retracement back into the Demand zone. I will monitor the charts and check if I can get into any sell-to-buy setups - meaning selling before looking for buys into the Demand zone. ( that way I can position myself better ) Again what I need to see for my setup to become valid is a 15-minute structure flip/break. Nice setup overall.
Let's patiently wait and see what next week will show us.

RELIANCE Levels For Intraday or swing TradingChart Overview:
Current Price: ₹6,735.851.
Recent Performance:
1 day: +0.80%
5 days: +0.48%
1 month: +0.54%
6 months: +2.42%
Year to date: +16.29%
1 year: +21.40%
5 years: +165.58%
Support and Resistance Levels:
Pivot Points:
Resistance 1 (R1): ₹6,650.37
Resistance 2 (R2): ₹6,684.38
Resistance 3 (R3): ₹6,712.77
Pivot Point: ₹6,621.98
Support 1 (S1): ₹6,587.97
Support 2 (S2): ₹6,559.58
Support 3 (S3): ₹6,525.57

LONG ENDaily live trade with EN in H1
This is my plan. My Strategy is Reversal or Pull Back method.
Win rate 65-70%.
R:R around 1:3
Trading is risky, so follow capital management and follow stoploss.

Eurnzd trade idea !! cup and handle pattern ?? #eurnzdEurnzd trade idea !! cup and handle pattern ?? #eurnzd
break out of resistance and retest + bearish enfulging candlestick
is enough to trade or we need to wait for more confirmation

EURNZDThe price is trading in a daily buy zone on EUR/NZD. Obviously, this is what I’m focused on. Let’s see if buyers can enter the market this week!

EURCHF - Short Trade IdeaSymbol - EURCHF
EURCHF is currently trading at 0.97300
I'm seeing a trading opportunity on sell side.
Shorting EURCHF pair at CMP 0.97300
I will be adding more if 0.97550 comes & will hold with SL of 0.97800
Targets I'm expecting are 0.96300 - 0.96000
Disclaimer - Do not consider this as a buy/sell recommendation. I'm sharing my analysis & my trading position. You can track it for educational purposes. Thanks!
