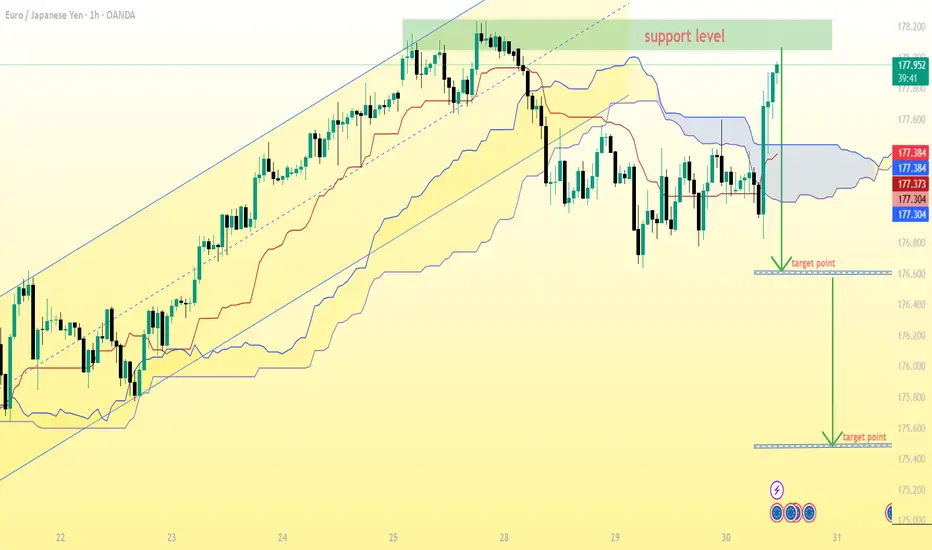
EUR/JPY (1H) chartEUR/JPY (1H) chart, here’s what can be interpreted based on my annotations and price action:
Support level (green zone): around 178.00 – 178.20
Current price: 177.88
Breakdown below cloud: already happened previously, price retested resistance (support turned resistance) and dropped again.
My also drawn two target points below — one short-term and one deeper move.
---
🎯 Target Analysis
From my markings and price structure:
First target (short-term): around 176.40 – 176.50
→ This aligns with my first green arrow and matches a previous minor swing low.
Second target (main target): around 175.20 – 175.30
→ This is the lower arrow, which aligns with the bottom of my previous structure (major support zone).
---
📊 Trade Idea Summary
If my looking at a short setup (since price rejected the resistance zone):
Sell Entry: below 177.70 (confirmation of rejection)
Target 1: 176.40
Target 2: 175.20
Stop-loss: above 178.20 – 178.30 (just above resistance zone)
---
⚖ Risk/Reward (approximate)
If entering at 177.70:
SL: 178.30 (≈ 60 pips risk)
TP1: 176.40 (≈ 130 pips reward)
TP2: 175.20 (≈ 250 pips reward)
➡ R:R = 1:2 to 1:4
---
✅ Conclusion:
My first target is 176.40, and my main target is 175.20.
This setup looks valid if price stays below the 178.00 resistance and cloud confirms bearish momentum.
Eurjpy!
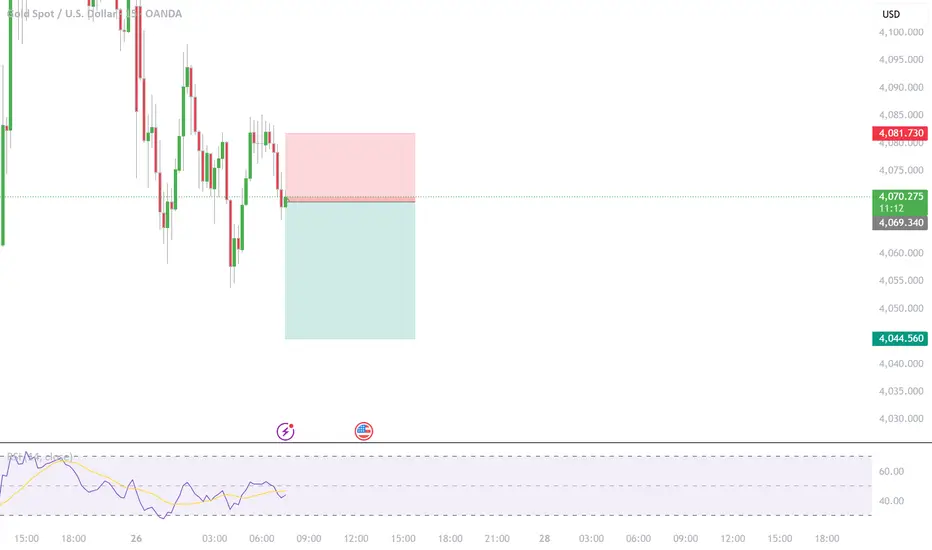
XAU/USD – 15-Minute Timeframe Analysis (Short Bias)Market Overview
Following the latest round of China–U.S. trade negotiations, market sentiment has shifted toward a more risk-on environment, reducing demand for safe-haven assets such as gold. As optimism surrounding the talks strengthens the U.S. dollar, gold prices have continued to decline during the Asian and early European sessions.
Technical Outlook
On the 15-minute timeframe, XAU/USD maintains a clear short-term bearish structure, characterized by consecutive lower highs and lower lows. The pair is currently trading below key moving averages, reinforcing the prevailing downward momentum.
A potential retracement toward intraday resistance could present a favorable opportunity for short positions, provided that bearish price action confirms rejection at that level.
Key Resistance: 2360 – 2365 zone (previous support turned resistance)
Immediate Support: 2348 – 2350 zone
Extended Support Target: 2338 – 2340
EURJPY SHOWING A GOOD DOWN MOVE WITH 1:8 RISK REWARDEURJPY SHOWING A GOOD DOWN MOVE WITH 1:8 RISK REWARD
DUE TO THESE REASON
A. its following a rectangle pattern that stocked the market
which preventing the market to move any one direction now it trying to break the strong resistant lable
B. after the break of this rectangle it will boost the market potential for break
C. also its resisting from a strong neckline the neckline also got weeker ald the price is ready to break in the outer region
all of these reason are indicating the same thing its ready for breakout BREAKOUT trading are follws good risk reward
please dont use more than one percentage of your capitalfollow risk reward and tradeing rules
that will help you to to become a bettertrader
thank you

EURJPY - FALSE BREAKOUT HIGHLIGHTS RANGE-BOUND CONDITIONSSymbol - EURJPY
The EURJPY currency pair is currently testing the upper boundary of its established trading range, indicative of a potential distribution phase. However, this attempt has culminated in a false breakout, with the price subsequently consolidating within the horizontal channel.
Amid a weakening US dollar, the Japanese yen is exhibiting relative strength, exerting downward pressure on the EURJPY pair. Following a retest of the lower boundary of the range, the pair staged a false breakout above resistance, only to retreat back within the channel. This price action suggests a continuation of the distribution pattern, with resistance proving resilient.
Currently, a base appears to be forming near the 163.20 level, which serves as a key support and potential trigger level. A sustained breakdown below this threshold, coupled with consolidation beneath it, may reinforce bearish momentum and pave the way for further downside movement.
Key Resistance Levels: 163.40, 163.60
Key Support Levels: 163.20 (Sell trigger), 162.70
A decisive breach and stabilization below the 163.20 support level could act as a catalyst for an accelerated decline in the pair.

EURJPY - BREAKOUT ALERT - BULLS EYE HIGHER GROUNDSymbol - EURJPY
CMP - 164.15
The EURJPY currency pair is advancing, supported by a strengthening US dollar and encouraging developments regarding the de-escalation of US-China trade tensions. This upward momentum has brought the pair to test the upper boundary of its recent trading range.
Currently, the pair appears to be in the process of retesting a key resistance zone. A decisive breakout and sustained consolidation above the 164.19 - 164.50 range would reinforce the bullish outlook, particularly given the dollar's continued appreciation. The Japanese yen, in turn, is weakening in response to the improving geopolitical climate, further contributing to upward pressure on EURJPY.
A confirmed move above this critical resistance level would indicate the completion of the consolidation phase and could initiate a distribution phase toward higher price targets.
Key Resistance Levels: 164.19, 166.70
Key Support Levels: 163.15, 162.38
The price action has already entered the anticipated buying zone, suggesting a potential breach of resistance. Confirmation through consolidation above the 164.19 - 164.50 range would signal renewed bullish momentum, potentially paving the way for an advance toward the 166.70 level.

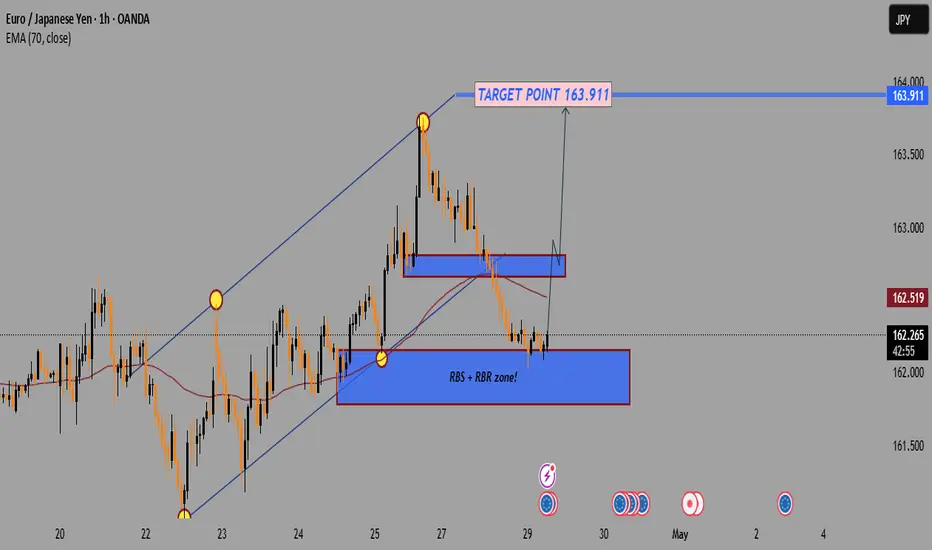
EUR/JPY 1H Chart Analysis –Bullish Rebound from Key Support Zone🔵 Trend & Structure:
⏫ Uptrend Channel (now broken)
The price was moving in a rising channel.
❌ Breakdown from the channel shows loss of bullish momentum.
🟦 Key Zones:
🔷 RBS + RBR Zone (Strong Support)
🔽 Price is currently sitting on this zone.
📍Potential bounce area → watching for bullish reaction.
🟥 Resistance Zone (Short-term hurdle)
🔺 Might be retested before moving higher.
📘 Target Point: 163.911
🎯 Bullish move expected if price confirms bounce.
📈 Potential target marked with a clear label.
📉 EMA 70 (Red Line):
➖ Acting as resistance near 162.518
⚠️ Price must close above this level for stronger bullish confirmation.
📌 Summary:
✅ Buy Zone: 162.000 – 162.200 (RBS + RBR)
🔁 Retest Zone: ~162.500
🎯 Target: 163.911
⚠️ Watch for Rejection below EMA or resistance zone.
EURJPY: Short Setup with Target Zones in FocusEURJPY outlines a clear W-X-Y corrective pattern. Wave (W) ended at 161.297 , followed by an upward corrective move in Wave (X), which topped at 162.665 with a classic ABC formation.
Currently, the price is hovering around 162.084, likely forming Wave B of the final Y leg. A brief move higher could complete this B wave before the pair resumes its decline toward the 160.922–160.680 area, which marks the projected end of Wave C of (Y).
The broader correction is framed by two descending blue trendlines, providing dynamic resistance and support, while a short-term red ascending trendline is currently holding the price action but may soon give way. If the price stalls or rejects around the 162.3–162.5 zone, it could signal the start of the next leg down, making it a potential setup for short positions. After the reversal from Wave Y, potential upside targets are 161.600, 162.500 , and 163.100 .
We will update it soon!

EURJPY - FALSE BREAKOUT SETS THE STAGE FOR A POTENTIAL DROPSymbol - EURJPY
CMP - 161.95
EURJPY is currently exhibiting a false breakdown of resistance, which signals the formation of a reversal pattern near the upper boundary of the descending price channel. Additionally, market pressure, influenced by the correction of the U.S. dollar, is contributing to this development.
On the daily chart, the overall structure appears bearish. Following the false breakout of the major resistance, a correction is underway, during which the price may test the imbalance zone or the previously broken resistance before continuing its decline after liquidity is captured. The broader trend remains neutral, and in this context, it is prudent to focus on local support levels as potential targets.
Resistance levels: Channel boundary, 162.30, 163.00
Support levels: 160.84, 158.90
A retest of the channel resistance or the range between 162.4 and 163.0 is possible. However, any movement of the price below the resistance of the descending channel, coupled with a consolidation in the selling zone, could trigger further downside movement.

EURJPY - CONSOLIDATING AT KEY SUPPORT WITH BULLISH POTENTIALSymbol - EURJPY
CMP - 156.50
EURJPY continues to consolidate near an important support zone. The support level marked on the chart has acted as a solid base for price action, offering stability to the currency pair and providing key support for the consolidation.
At the current market price, EURJPY presents a good opportunity for traders looking to enter long positions. The price is well-positioned for potential upward movement, making it an ideal entry point for those anticipating a bullish trend. Moreover, the ongoing downtrend in the US dollar is likely to provide additional support for the Euro, further reinforcing the bullish potential for the pair.
However, it is essential to keep an eye on price action near support zone. A breakdown below 154.80 area could signal increased selling pressure, and a sustained move below the 154.50 level would confirm a shift from a bullish to a bearish market structure. In such a scenario, a retest of the breakdown zone could provide a viable opportunity for short positions.
On the other hand, if EURJPY maintains its recovery, we could see a push toward the 158 and 160.85 levels, which represent significant resistance areas. A successful breakout above 161.00 levels would confirm trend reversal and potentially signal further upward momentum.
Key Resistance Levels: 158.00, 160.85
Key Support Levels: 156.00, 155.20

EURJPY - TRADING AT DEMAND ZONESymbol - EURJPY
EURJPY is currently trading within a important support zone. This level has acted as a solid base for price action, offering stability to the currency pair and providing key support for the ongoing trend.
At current market price (CMP 156.50), EURJPY presents a promising opportunity to initiate long positions. The current price level aligns well for potential upward movement, making it a favorable entry point for traders looking to take advantage of the prevailing trend.
However, it is crucial to monitor certain levels for any signs of trend reversal. A breakdown below the 155.25 area could trigger additional selling pressure, and a sustained move below 155.00 would confirm a shift from a bullish to a bearish market structure. In such a case, a retest of the breakdown zone could offer a good opportunity for short positions.
Conversely, if EURJPY continues to recover, we could see a push toward the 158.67 and 160.85 levels, which represent key resistance areas. A successful breakout above these levels would likely signal the continuation of the bullish trend, suggesting further upward momentum.
Key Resistance Levels: 158.70, 159.90, 160.85
Key Support Levels: 156.00, 155.25

EURJPY - 1 HOUR TMF- BULLISH TREND 350++ pips Hi all,
Smart money concept - bullish choch trend
Buy 158.500
Target 161.600++

EURJPY Longs Idea.1. This trade is based on pure price action, order flow and Candlestick analysis.
2. Same thing again and again, Rinse and repeat. HTF break structure and Unmitigated areas of S and D on LTF

EURJPY LONGFOREXCOM:EURJPY
Hello traders , here is the full multi time frame analysis for this pair, let me know in the comment section below if you have any questions, the entry will be taken only if all rules of the strategies will be satisfied. wait for more Smart Money to develop before taking any position . I suggest you keep this pair on your watchlist and see if the rules of your strategy are satisfied...
Keep trading
Hustle hard
Markets can be Unpredictable, research before trading.
Disclaimer: This trade idea is based on Smart money concept and is for informational purposes only. Trading involves risks; seek professional advice before making any financial decisions. Informational only!!!!

EURJPY Declines, Watch 157.1 and 155.3The EURJPY chart shows a clear downtrend, with the price trading below the EMA 34 and EMA 89, confirming strong selling pressure.
The key resistance is identified around 157.100 USDT. If the price fails to break this level, it is likely to retest the support zone at 155.321 USDT.
The downtrend is expected to continue unless there is a reversal. The market is also significantly influenced by the interest rate decisions from the ECB and BOJ, which will be crucial in determining EURJPY's direction in the near future.

EURJPY SELLING Entry: 🎯 Target: ⛔ Stop Loss: (MARKED IN CHART)
💡 RISK REWARD 1 : 6
💰 Risk 1% of your trading capital.
⚠️ Markets can be unpredictable; research before trading.Disclaimer: This trade idea is based on Elliott Wave analysis and is for informational purposes only. Trading involves risks; seek professional advice before making any financial decisions.Informational onLY !!!

EURJPY Pressure: Support 159.552, Interest Rate ResistanceEURJPY is declining after hitting strong resistance at 163.000, causing a price pullback.
The 34 and 89 EMAs are acting as resistance levels, adding selling pressure in the market.
The MACD indicator shows that downward momentum is slowing, but there is no clear signal of a strong reversal yet.
If the price holds above the 159.552 support and shows signs of recovery, investors may consider opening buy positions with a target around 161.000 - 162.000.
Regarding news: Interest rate decisions from the ECB and BOJ will significantly impact EURJPY. Tightening from the ECB may push EUR higher, while BOJ's negative rates could weaken JPY.

EURJPY LONG - 15MFOREXCOM:EURJPY
Hello traders , here is the full multi time frame analysis for this pair, let me know in the comment section below if you have any questions, the entry will be taken only if all rules of the strategies will be satisfied. wait for more Smart Money to develop before taking any position . I suggest you keep this pair on your watchlist and see if the rules of your strategy are satisfied...
Keep trading
Hustle hard
Markets can be Unpredictable, research before trading.
Disclaimer: This trade idea is based on Smart money concept and is for informational purposes only. Trading involves risks; seek professional advice before making any financial decisions. Informational only!!!!

UPDATED THOUGTHS ON VIDEO ANALYSISHello traders, I am here with another video, this time with update from the last video I posted as today is Wednesday already. Currently it seem that some good set ups are developing on: NzdCad, EurJpy, AudNzd, AudChf, NzdUsd, EurUsd. I will be waiting to see what price will show me on this pairs. Thank you for following me, I will update you all with new analysis and thoughts once I see something interesting.

EURJPYHey EJ looks bearish if we look at the structure... for an explanation and details of this trading idea, check my latest FX video analysis ( 22.7 - x ) Have a great week!
T

EURJPY continuationAs you can see, we had two possible scenarios on EurJpy, either for a price to follow the trend - a continuation or break of the low and possible shift in direction of the market which can happen any time as a price is trading very high (recorded in previous video) Price made a nice and weak recovery - pull to the downside on the market open in asian seson - towards our marked buy zone. From there it just pushed back up and with high being taken out we can see that as first market objective completed. Curently we are in an up trend so we will still be monitoring price once it taps buy zone and look for buys or if we get a break of the previous low - look for sells - if. I do not trade that pair a lot so if I don't like it I will stay away.

Bullish Opportunity in EUR/JPY After Break of StructureMarket Overview:
In the 15-minute timeframe, the EUR/JPY pair has shown a Break of Structure (BOS) to the upside, indicating a potential bullish momentum. The price has created a new high and is now retracing to the M15 demand zone. This zone also aligns with an Order Block (OB), reinforcing its strength as a potential entry point.
Entry: Monitor the M15 demand zone for bullish confirmation before entering.
Stop-Loss (SL): Place below the M15 demand zone to protect against a false breakout.
Take-Profit (TP): Target the next significant resistance level for a favorable risk-to-reward ratio.
Recommendation:
This setup offers a good risk-to-reward ratio. Traders should watch for bullish price action in the M15 demand zone for entry confirmation. Proper risk management is essential, and adjusting the stop-loss to break even once the trade is in profit is advised.
Happy trading!

EURJPY Breaking Bullish Structure on H1The H4 timeframe shows a bullish trend has broken and turned bearish.
Similarly, the H1 timeframe has shifted from bullish to bearish.
Plan A: Price is retracing to a potential liquidity pool area - this is a corrective wave, so we'll set up a sell order at the liquidity pool area. Only sell with confirmation of entry here.
If Plan A hits stop loss, continue to watch for selling opportunities according to Plan B . Only sell with confirmation of entry.

EURJPY- JPY BULLET TRAIN MAY TAKE A HALT & REVERSE ITS DIRECTIONSymbol - EURJPY
EURJPY is currently trading at 168.200
I'm seeing a trading opportunity on sell side.
Shorting EURJPY pair at CMP 168.200
I will be adding more if 168.600 comes & will hold with SL of 169.000
Targets I'm expecting are 165.400 & beyond.
Disclaimer - Do not consider this as a buy/sell recommendation. I'm sharing my analysis & my trading position. You can track it for educational purposes. Thanks!
