USDJPYIt looks like price completed its objective just before Friday’s news release, after which USD dropped sharply. From a technical perspective, structure has flipped from bullish to bearish. A clean correction to the upside into the 148.0 supply zone followed by a drop would make perfect sense. I’ll be watching to see if this develops into a swing move.
Euro

EURUSD – Bullish Setup Toward 1.16EURUSD – Bullish Setup Toward 1.17
EURUSD is showing strong signs of a bullish reversal after an extended period of downside movement. The 3H chart highlights several Market Structure Shifts (MSS) and Breaks of Structure (BOS) suggesting that bearish momentum is fading and buyers are regaining control near the 1.1500 demand zone.
The price is forming a solid accumulation base, indicating that smart money may be positioning for a move higher. A clean break above the 1.1680–1.1730 resistance area could confirm a trend reversal, opening the way for a sustained bullish rally toward the mid-1.18 region.
With momentum strengthening and structure turning positive, EURUSD looks poised for a potential breakout continuation in the days ahead.
📈 Key Insights:
Structure: Bullish reversal forming on 3H timeframe
Support zone: 1.1500 – strong accumulation base
Upside targets: 1.1680 → 1.1730 → 1.1800
Outlook: Buyers regaining control; bullish continuation likely

EURGBP - CONSOLIDATES AFTER BREAKOUT RUNSymbol - EURGBP
EURGBP continues to renew its local highs as part of an ongoing rally triggered by a breakout above consolidation resistance within a broader bullish trend.
The pair remains in a upward structure, with consolidation taking shape in the form of a bullish continuation pattern, reflecting sustained buyer dominance. Following the breakout from the ascending triangle, EURGBP extended higher toward 0.8818, where a double top formation is emerging - indicating a potential short-term correction before the next upward move.
Resistance levels: 0.8786, 0.8818
Support levels: 0.8752, 0.8721
A corrective pullback may lead the price back toward the breakout zone, allowing for liquidity accumulation and a rebalancing of market structure in favor of buyers. This, in turn, could set the stage for a renewed continuation of the bullish trend.

Euro Under Pressure from Strong USDThe euro continues to show weakness against the dollar as global risk sentiment cools and investors shift toward safer assets. Market participants remain cautious ahead of key inflation data from the Eurozone and upcoming comments from Federal Reserve officials, which could clarify the next phase of U.S. monetary policy.
The recent euro recovery attempts have met consistent supply, reflecting pressure from subdued European growth and stronger U.S. economic resilience. The dollar remains supported by robust labor market conditions and persistent inflation expectations, which sustain demand for U.S. yields and Treasury assets.
Liquidity patterns suggest that institutions are still offloading positions near recent highs, keeping EUR/USD confined within a broader corrective cycle. Energy price fluctuations and diverging rate expectations between the ECB and the Fed continue to weigh on sentiment.
Overall, the pair remains under macroeconomic strain, with capital flows favoring the dollar as global markets seek stability am

EURCAD - APPROACHES KEY LIQUIDITY ZONESymbol - EURCAD
EURCAD is currently undergoing a correction towards a key liquidity zone within the context of a broader and well established bullish trend. The question remains - will the bulls step in around the 1.6175 area?
EURCAD is retracing toward a strong support zone near 1.6175, contributing to short-term weakness in the pair. Despite this correction, the overall trend remains bullish, and a reaction from buyers in this region appears likely.
A false breakout above resistance has triggered the ongoing pullback. However, price action remains confined within the established trading range between 1.6400 & 1.6173. The market now appears to be gravitating toward support for a potential retest, and this zone could serve as a foundation for renewed upward movement.
Resistance levels: 1.6330, 1.6400
Support levels: 1.6175, 1.6030
A liquidity pool just below the 1.6200 - 1.6170 area may shift momentum in favor of buyers. Given that the broader structure remains bullish, this presents a potential advantage for long positions. A false breakdown of support, coupled with a lack of downside momentum, could act as a catalyst for renewed growth.

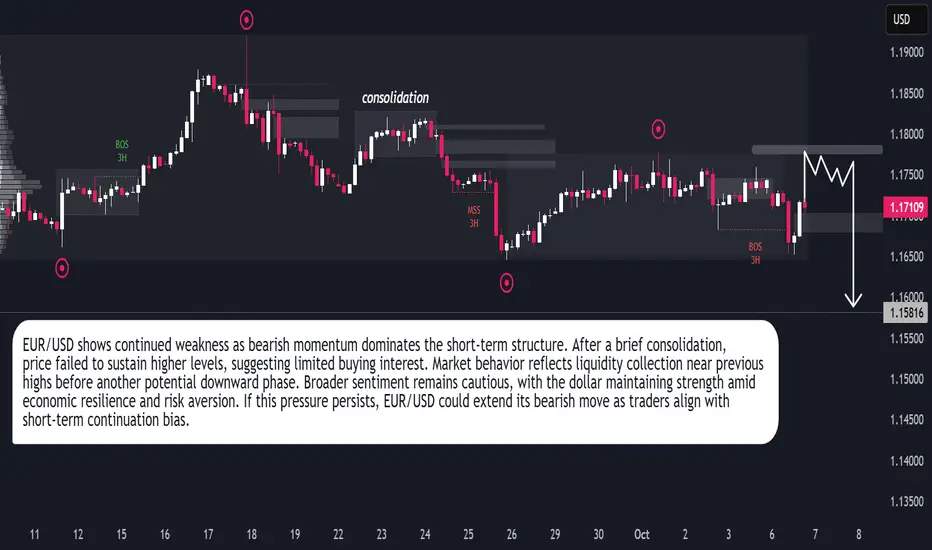
EUR/USD – Bearish Continuation in MotionEUR/USD continues to display a bearish market structure, reflecting persistent downside pressure as the euro struggles to maintain stability against the U.S. dollar. Recent price action shows a period of consolidation followed by a liquidity grab near short-term highs, indicating that buyers are losing strength and the market is positioning for a potential continuation of the decline. The broader market tone suggests that sentiment remains cautious, with traders favoring the dollar due to its resilience amid global uncertainty and steady U.S. economic performance. The pair’s inability to establish higher highs further confirms weakness in bullish momentum. This behavior often signals distribution, where institutional players offload long positions before another leg downward. Short-term movements could still present small corrective bounces as the market seeks liquidity, but overall conditions favor sellers. Unless a strong shift in macro sentiment occurs, EUR/USD is likely to maintain its downward trajectory, targeting lower levels as the bearish momentum unfolds and traders continue aligning with dollar strength.
EURJPY - FALSE BREAKOUT HIGHLIGHTS RANGE-BOUND CONDITIONSSymbol - EURJPY
The EURJPY currency pair is currently testing the upper boundary of its established trading range, indicative of a potential distribution phase. However, this attempt has culminated in a false breakout, with the price subsequently consolidating within the horizontal channel.
Amid a weakening US dollar, the Japanese yen is exhibiting relative strength, exerting downward pressure on the EURJPY pair. Following a retest of the lower boundary of the range, the pair staged a false breakout above resistance, only to retreat back within the channel. This price action suggests a continuation of the distribution pattern, with resistance proving resilient.
Currently, a base appears to be forming near the 163.20 level, which serves as a key support and potential trigger level. A sustained breakdown below this threshold, coupled with consolidation beneath it, may reinforce bearish momentum and pave the way for further downside movement.
Key Resistance Levels: 163.40, 163.60
Key Support Levels: 163.20 (Sell trigger), 162.70
A decisive breach and stabilization below the 163.20 support level could act as a catalyst for an accelerated decline in the pair.

EURJPY - BREAKOUT ALERT - BULLS EYE HIGHER GROUNDSymbol - EURJPY
CMP - 164.15
The EURJPY currency pair is advancing, supported by a strengthening US dollar and encouraging developments regarding the de-escalation of US-China trade tensions. This upward momentum has brought the pair to test the upper boundary of its recent trading range.
Currently, the pair appears to be in the process of retesting a key resistance zone. A decisive breakout and sustained consolidation above the 164.19 - 164.50 range would reinforce the bullish outlook, particularly given the dollar's continued appreciation. The Japanese yen, in turn, is weakening in response to the improving geopolitical climate, further contributing to upward pressure on EURJPY.
A confirmed move above this critical resistance level would indicate the completion of the consolidation phase and could initiate a distribution phase toward higher price targets.
Key Resistance Levels: 164.19, 166.70
Key Support Levels: 163.15, 162.38
The price action has already entered the anticipated buying zone, suggesting a potential breach of resistance. Confirmation through consolidation above the 164.19 - 164.50 range would signal renewed bullish momentum, potentially paving the way for an advance toward the 166.70 level.

EURAUD EYES A REBOUND - CAN THE BULLS HOLD THE SUPPORT?Symbol - EURAUD
Amid a broader global bullish trend, the EURAUD pair is currently undergoing a corrective phase, approaching the support zone of the established trading range. Market participants are observing efforts by buyers to defend the 1.7750 level.
The pair remains within a broad consolidation range. Price action near the lower boundary has exhibited signs of a false breakout and subsequent liquidity absorption, which could potentially trigger a rebound toward the midpoint of the range or even a move toward the upper resistance levels.
Sustained consolidation above the 1.7750 mark, coupled with the emergence of a local reversal pattern, may serve as a catalyst for renewed upward momentum. While the overarching trend remains bullish, the current move reflects a local correction. Fundamentally, conditions remain uncertain. However, the US Dollar Index continues to correct after a recent sharp decline.
Key Resistance Levels: 1.7855, 1.7987
Key Support Levels: 1.7750, 1.7695
Should bullish momentum prevail and price remain above the critical 1.7750 support - marking the lower boundary of the range, there is potential for a rebound targeting liquidity pools situated above resistance levels.

EURGBP - RESISTANCE TESTED, IS THE SHARP TREND READY TO FLIP?Symbol - EURGBP
CMP - 0.8460
The EURGBP pair is currently within the distribution phase (with a news-driven backdrop) and has tested the resistance level at 0.8461 and the associated liquidity zone. However, a false breakout has occurred, indicating a lack of sustained upward momentum. Meanwhile, the Dollar Index is experiencing a decline following the announcement of new tariffs by President Trump, which generally triggers a market-wide rally. However, in anticipation of the upcoming Non-Farm Payroll (NFP) report, the market is shifting towards profit-taking as growing risks become more apparent. Key economic news releases are expected, which could introduce significant volatility.
From a technical perspective, following a strong price movement, the currency pair has formed a false breakout of resistance and is now consolidating within the selling zone. Should the bears manage to maintain the price below 0.8461, a short-term correction towards the 0.5 Fibonacci level or the Fair Value Gap (FVG) zone can be anticipated.
Resistance levels: 0.8460
Support levels: 0.8427, 0.8396
The current market conditions are complex, driven by an unstable backdrop. However, from a technical standpoint, this scenario mirrors a typical false breakout of a significant resistance level, which, according to historical data, often precedes strong price movements following the breakout of key levels.

EURJPY - CONSOLIDATING AT KEY SUPPORT WITH BULLISH POTENTIALSymbol - EURJPY
CMP - 156.50
EURJPY continues to consolidate near an important support zone. The support level marked on the chart has acted as a solid base for price action, offering stability to the currency pair and providing key support for the consolidation.
At the current market price, EURJPY presents a good opportunity for traders looking to enter long positions. The price is well-positioned for potential upward movement, making it an ideal entry point for those anticipating a bullish trend. Moreover, the ongoing downtrend in the US dollar is likely to provide additional support for the Euro, further reinforcing the bullish potential for the pair.
However, it is essential to keep an eye on price action near support zone. A breakdown below 154.80 area could signal increased selling pressure, and a sustained move below the 154.50 level would confirm a shift from a bullish to a bearish market structure. In such a scenario, a retest of the breakdown zone could provide a viable opportunity for short positions.
On the other hand, if EURJPY maintains its recovery, we could see a push toward the 158 and 160.85 levels, which represent significant resistance areas. A successful breakout above 161.00 levels would confirm trend reversal and potentially signal further upward momentum.
Key Resistance Levels: 158.00, 160.85
Key Support Levels: 156.00, 155.20

Euro Weekly SetupEURUSD weekly setup suggesting major short.
charts shows some rally on long expected just to enter short from level 1.05900 for target 1.03350

EURGBP - TRADE IDEA ON LONG SIDE FOR HUGE PROFITSymbol - EURGBP
EURGBP is currently trading at 0.8272
I'm seeing a trading opportunity on buy side.
Buying EURGBP pair at CMP 0.8272
I will be adding more if 0.8245 comes & will hold with SL 0.8225
Targets I'm expecting are 0.8345 - 0.8370 & above.
Disclaimer - Do not consider this as a buy/sell recommendation. I'm sharing my analysis & my trading position. You can track it for educational purposes. Thanks!

EURUSD: Focus on 13-month-old support and EU/US GDPEURUSD retreats towards a key support level as traders prepare for Wednesday's Eurozone and US Q3 GDP reports. Despite this, the pair maintains a mid-October breakdown below the 200-SMA, while oscillators challenge continued bearish momentum.
Bulls and bears jostle at key support
While EURUSD sellers benefit from the drop below the 200-SMA and a stronger US Dollar, an upward trend line from October 2023, along with an oversold RSI and a potential bull cross on the MACD, may limit further declines of the major currency pair.
Key technical levels
The 13-month rising support line near 1.0770 is crucial for EURUSD sellers if the pair drops further. Below that, the monthly low of 1.0760 is an important level, with June and April lows around 1.0665 and 1.0600 as potential targets.
For EURUSD buyers, recovery seems challenging without breaking the 200-SMA at 1.0870. Even if they succeed, the 1.1000-1.0980 zone, marked since January, poses a tough challenge. If the Euro bulls cross the 1.1000 hurdle, they’ll set their sights on the 78.6% Fibonacci Extension (FE) of the pair’s late 2023 fall and a 10-month-old rising trend line, close to 1.1100 and 1.1220 in that order.
Further downside needs a strong catalyst
With mixed oscillator signals, EURUSD sellers need robust data to support US Dollar strength and Euro weakness to push prices lower. A corrective bounce seems likely, potentially creating fresh selling opportunities if Eurozone data surprises positively.

EURUSD bounces back from year-long support ahead of EU/US PMIEURUSD records its first daily gain in four, bouncing back from the lowest level since July 3, as traders eagerly await the preliminary readings of October's PMIs for the Eurozone and the US. The Euro pair’s movement aligns with overbought RSI conditions while it turns from an upward support line established in early October 2023.
Sellers remain in control
Despite an oversold RSI (14) supporting EURUSD's bounce from key support, bearish MACD signals and trading below the 200-SMA keep sellers optimistic. The downside bias is further strengthened by more dovish expectations from the European Central Bank (ECB) compared to the US Federal Reserve (Fed).
Key technical levels to watch
The multi-month support line around 1.0765 is crucial for EURUSD. A clear break below this level could expose the pair to a decline toward February and June 2024 lows, near 1.0700 and 1.0680, respectively. However, if the RSI conditions hold, Euro bears may face challenges around 1.0680. If not, the yearly low marked in April around 1.0600 will be the last line of defense for buyers before the pair heads toward the late 2023 bottom around 1.0450.
Alternatively, a rebound for EURUSD seems unlikely while trading below the 200-SMA at 1.0870. That said, the immediate upside is protected by the 50% Fibonacci level from the pair's rise between October 2023 and September 2024, located around 1.0830. Additionally, the 38.2% Fibonacci level and an 11-week-old support line near 1.0920 and 1.1000 will be tough obstacles for bulls to overcome if they break past 1.0830.
Further recovery looks challenging
While some technical signals indicate that sellers may be losing momentum, several technical and fundamental factors suggest buyers are not yet ready to step in. The EURUSD's corrective bounce could continue with strong EU data and weak US statistics. However, if the US Dollar sees a positive surprise, the likelihood of further downside for the pair remains high.

EURUSD: 200-SMA, oversold RSI test bears ahead of ECBEarly Wednesday, EURUSD sees the first daily gains in more than a week, after hitting its lowest point in 10 weeks. In doing so, the Euro pair portrays the market’s consolidation ahead of Thursday’s European Central Bank (ECB) Interest Rate Decision and September’s US Retail Sales data.
Sellers have a bumpy road ahead
In addition to pre-data consolidation, the 200-day SMA and oversold RSI pose challenges for EURUSD bears, indicating limited downside potential. A significant drop may occur only if the ECB disappoints or US data delivers unexpectedly strong signals for the dollar.
Technical levels to watch
The 200-SMA level surrounding 1.0870 appears a tough nut to crack for the EURUSD, backed by the oversold RSI. However, a downside break of the same won’t hesitate to drag the prices toward the August month’s low of near 1.0775. Following that, an ascending support line from October 2023, close to 1.0750 at the latest, will act as the final defense of the buyers.
On the contrary, July’s high of near 1.0950 could lure EURUSD buyers during a corrective bounce. Following that, the March peak surrounding 1.0980 and the 1.1000 psychological magnet can entertain Euro buyers before testing them with a two-month-old horizontal support-turned-resistance of near 1.1015 and the previous support line stretched from late June, close to 1.1030.
Price Consolidation Ahead, But No Trend Change Expected
While technical indicators suggest bear exhaustion and a possible corrective bounce for EURUSD, multiple resistances and fundamental factors hinder a reversal of the ongoing two-week bearish trend.

EURUSD: Bears focus on 1.0800 and US Inflation cluesEURUSD licks its wounds at the lowest level in eight weeks as traders await September's US Consumer Price Index (CPI) data, especially after the previous day’s FOMC Minutes drowned the Euro pair.
Bears keep the driver’s seat
Apart from the US Dollar’s run-up post-Fed Minutes, the EURUSD pair’s confirmation of “Double Tops” bearish chart formation and a clear break of a 15-week-old rising support line add strength to the downside bias.
It’s worth noting, however, that the oversold RSI (14) line and sluggish MACD signals challenge intraday sellers, along with the pre-data consolidation.
Key technical levels to watch
The 50% Fibonacci level from the EURUSD’s June to September rise, around 1.0940, limits immediate downside. The next significant support is at the 61.8% Fibonacci retracement near 1.0870, known as the “Golden Fibonacci Ratio.” If the price breaks below 1.0870, it could lead to a drop toward the bearish target from the "Double Tops" pattern, around 1.0800.
On the upside, the EURUSD recovery is unlikely unless it surpasses the 1.1010 level. The previous support line, now acting as resistance, is near 1.1000. In a case where the Euro buyers manage to stay onboard past 1.1010, the 23.6% Fibonacci retracement and the double tops, respectively near 1.1085 and 1.1200, will be on their radars.
Further downside expected
While an oversold RSI and potentially softening US inflation data may pose challenges for US Dollar bulls, EURUSD bears remain encouraged. The confirmation of a bearish chart formation, combined with the European Central Bank's (ECB) more dovish stance compared to the Federal Reserve (Fed), keeps the sellers optimistic about further declines.

EURUSD: Bears seek confirmation from “Double Tops” and US NFPEarly Thursday, EURUSD prints a five-day losing streak, reaching its lowest point in three weeks. The Euro pair traders are holding their breath for the September US employment report, especially after strong data from ADP and hawkish comments from Fed Chair Jerome Powell.
Sellers approach key supports
In addition to strong US data and hawkish remarks from Fed Chair Powell, softer inflation in the Eurozone is adding pressure on the EURUSD pair. A clear drop below the 50-bar Exponential Moving Average (EMA) keeps bearish sentiment alive. Plus, the lack of an oversold RSI (14) and bearish signals from the MACD suggest further weakness ahead.
Important levels to watch
With the EURUSD pair breaking below the 50-EMA and facing bearish technical and fundamental factors, it looks poised to test the previous monthly low around 1.1000. However, a six-month-old support line will likely challenge sellers around 1.0980. Importantly, the convergence of the 100-EMA and an ascending support line from late June, near 1.0960, is a crucial level to monitor. A drop below this level could push prices toward the target of the “Double Tops” pattern, around 1.0800.
Alternatively, the 50-EMA around 1.1045 serves as the immediate barrier for any recovery in the EURUSD pair. If the bulls can break through this level, they’ll face further resistance at 1.1100 and the “Double Tops” around 1.1200. A push above 1.1200 would challenge the current bearish trend and open the door for buyers to target the 2023 peak of approximately 1.1275.
Bears reign is about to be challenged
Overall, the EURUSD pair looks bearish in the short term, but there’s limited downside potential before reaching crucial technical levels. This means upcoming data and events will play a vital role in determining the next move.

EURUSD: Bulls need validation from 1.1200 and Fed Chair PowellEURUSD is gaining support after falling from a 14-month high, as buyers wait for comments from US Federal Reserve (Fed) Chairman Jerome Powell.
Upside remains favored
The EURUSD pair is holding above a two-week rising support line and the 200-SMA, along with an upward trend line from late June, which keeps buyers optimistic. The steady RSI (14) also indicates a slow upward movement.
Technical levels to watch
Even with key support levels helping the EURUSD pair and the RSI suggesting an upward trend, the bulls may struggle to break through the horizontal resistance around 1.1200. If they succeed, the next targets could be the 50% and 61.8% Fibonacci Extensions (FE) of the pair’s August-September moves, respectively near 1.1215 and 1.1265. The previous yearly high around 1.1275 is a crucial point for the bears; if that breaks, prices could reach the 2022 peak of 1.1495.
Meanwhile, EURUSD sellers should look for a clear drop below the immediate rising support line around 1.1125 to enter the market. However, the 200-SMA and a three-month trend line near 1.1080 and 1.0950 will be important obstacles for sellers. If the price stays below 1.0950, it could fall further toward the previous monthly low of 1.0780.
Charts, Powell in the spotlight
Along with the technical factors, comments from Fed Chair Powell will be important for EURUSD bulls. The recent rise is driven by market expectations of two more 0.50% rate cuts from the US central bank in 2024. If Powell dismisses these expectations, which seems unlikely, a downward reversal in Euro prices could happen.

EURUSD: Bulls struggle to keep control on FOMC DayEURUSD picks up bids to reverse the previous day’s retreat from a month-old horizontal hurdle as traders prepare for the all-important US Federal Reserve (Fed) Interest Rate Decision. In doing so, the Euro pair defends last week’s U-turn from a 200-SMA while making rounds to a four-week-long bearish channel’s top line.
Buyers are cautious
Along with the strong rebound from the 200-SMA, a positive RSI (14) supports the bullish outlook for the EURUSD pair. However, the key resistance area, a potential bearish signal on the MACD, and the cautious market sentiment ahead of the FOMC meeting may challenge any upward momentum.
Key technical levels
For EURUSD bulls to take charge, they must break above the key horizontal resistance zone around 1.1145-55, especially if the Fed signals a dovish stance. If they succeed, the focus will shift to the yearly peak near 1.1200. After that, the 50% and 61.8% Fibonacci Extension (FE) levels of August-September moves at 1.1215 and 1.1265 will be next, followed by the previous yearly high of 1.1275.
Conversely, any pullback in EURUSD should find strong support at the 200-SMA level around 1.1045. Even if it falls below this, the monthly low of 1.1000, the lower boundary of the bearish channel near 1.0980, and an upward trend line from late June around 1.0930 will likely hold the bears back before they gain control.
Sellers have a long and bumpy road ahead…
Even if buyers face challenges, EURUSD sellers still have a tough road ahead before taking control. Key obstacles include the Fed's potential consecutive rate cuts in 2024 and a rising support line around 1.0930, which are both important factors to watch.

EURUSD: Bears Eye 1.0980 as ECB Interest Rate Decision LoomsEURUSD prints its first daily gain in five days as traders recover from a month-long low, preparing for the European Central Bank's (ECB) upcoming policy announcements. Despite the recent slowing of US inflation and speculation about possible significant rate cuts from the US Federal Reserve in late 2024, the Euro bulls remain cautious due to the ECB's dovish stance and economic concerns in the Eurozone.
EURUSD sellers keep control
Even though the Euro is recovering before the key event, the overall bearish outlook for the pair remains intact. It continues to show weakness with the 20-EMA breakdown early in the week, bearish MACD signals, and a steady RSI (14) line.
Key technical levels to watch
Among the key technical levels, sellers are particularly focused on the convergence of the 50-day Exponential Moving Average (EMA) and a previous resistance line around 1.0980. Following that, an ascending support line from late June near 1.0900 is also important to monitor. If the price remains below 1.0900, it could drop further to the previous monthly low around 1.0790.
On the other hand, for EURUSD buyers to regain control, they need to see the price break above the 21-day EMA at around 1.1050 and a falling resistance line at about 1.1070. Additionally, a hawkish rate cut from the ECB would support this move. If the price manages to rise past 1.1070, it could test the monthly high of 1.1155 and the yearly peak around 1.1200.
Downside bias gains acceptance
Looking ahead, there's uncertainty about the ECB’s upcoming rate decision. Some traders anticipate a 0.50% cut, while most expect a smaller 0.25% reduction. If the ECB surprises the market with a more aggressive or unexpected rate move, it could lead to significant volatility. Therefore, EURUSD traders should hold off on new trades until the ECB's decision is announced. They should set a stop-loss to manage their risk if they are currently holding short positions.

EURUSD: Sellers stay optimistic, watching 21-EMA & US dataThe EURUSD pair has lost momentum after briefly recovering from the 21-EMA support level. Traders are now focused on upcoming US job reports, including the Initial Jobless Claims, ADP Employment Change, and ISM Services PMI. This cautious mood is making it hard for the Euro to gain traction.
Multiple catalysts lure Euro bears
The EURUSD pair has been stuck in a trading range for a week, with the RSI (14) showing no strong trend. However, a bearish chart pattern and bearish MACD signals keep sellers hopeful. Optimism about strong US data and concerns about an economic slowdown in the Eurozone add to the negative outlook for the Euro.
Technical levels to watch
EURUSD pair’s repeated bounces of 21-EMA support of 1.1050 highlights the numbers as a tough nut to crack for short-term sellers. Following that, a three-month-old resistance-turned-support near 1.0980 will lure the bears. In a case where the quote remains bearish past 1.0980, a gradual decline toward the rising wedge confirmation’s theoretical target near 1.0700 can’t be ruled out.
Meanwhile, EURUSD buyers need validation from 1.1080 to regain control. Even so, the aforementioned rising wedge’s bottom line surrounding 1.1210 will be a crucial resistance to watch for the bulls. Following that, the pair’s gradual run-up toward the previous yearly high of 1.1275 appears more likely.
Looking ahead…
A slew of US employment and activity data will decorate Thursday’s economic calendar and direct EURUSD traders. However, the quote’s failure to cheer the US Dollar’s weakness can please sellers should the scheduled statistics favour the Greenback’s run-up by dimming the odds of heavy Fed rate cuts.

EURUSD: Rising wedge signals bullish exhaustion, focus on dataEURUSD pares its biggest daily loss in 11 weeks early Thursday. In doing so, it's bouncing back from a key support level and the 50-Exponential Moving Average (EMA).
EURUSD bulls take a breather…
This rebound suggests that the Euro might be running out of steam before important economic data is released. Among them, the first reading of Germany’s inflation for August and the US Q2 GDP’s revision gain the attention of intraday traders. That said, the RSI (Relative Strength Index) and MACD (Moving Average Convergence Divergence) indicators suggest a potential bullish trend, but confirmation is needed.
Key technical levels to watch…
The EURUSD buyers need validation from a one-week-old horizontal resistance area surrounding 1.1150 and the US/German data to keep the reins. Following that, the yearly high marked earlier in the week around 1.1200 will lure the Euro bulls. In a case where the quote remains firmer past 1.1200, the aforementioned wedge’s top line of near 1.1250 and the previous yearly top of 1.1275 will act as the final defenses of the sellers.
On the contrary, EURUSD sellers must wait for a clear downside break of 1.1100 to confirm the bearish chart formation and aim for further declines. In that case, a convergence of the 200-EMA and an ascending trend line from early June, the previous resistance near 1.0980, will be in the spotlight. Should the pair remain bearish past 1.0980, the odds of witnessing further downward trajectory toward the rising wedge’s theoretical target of 1.0680 can’t be ruled out.
What next?
In summary, the EURUSD is currently on a positive track, but further gains may depend on upcoming economic data and potential pullbacks.
