EURUSD-2


EURUSD has bumpy road to north even as bulls keep the reinsA two-month-old ascending trend channel backs the EURUSD pair’s upside bias, despite multiple failures to cross the 1.0880 horizontal hurdle in the last week. That said, the 50-SMA and the 100-SMA restrict immediate downside around 1.0790 and 1.0700 respectively. Following that, the stated bullish channel could be at the test and hence the 1.0575 support will gain major attention. Should the quote drops below 1.0575, a slump toward the monthly low near 1.0480 appear imminent while any further downside won’t hesitate to challenge the lows marked during November.
Meanwhile, a successful break of the one-week-old horizontal resistance near 1.0880 isn’t an invitation for the bulls as the top line of the aforementioned channel, close to 1.0910, will act as the last defense of the EURUSD bears. In a case where the pair rises past 1.0910, it could quickly rise to the 1.1000 round figure. It’s worth noting that January 2022 low and the late March 2022 high, respectively around 1.1125 and 1.1185, might probe the pair buyers before giving them full control.
Overall, EURUSD stays inside a bullish chart formation and the oscillators are positive too. However, the upside momentum lacks acceptance and hence buyers should remain cautious.

EURUSD - 30M PROJECTIONDISCLAIMER: The Company accepts no accountability or obligation for your trading and speculation results, and you consent to hold the Company innocuous for any such outcomes or misfortunes. We are not financial advisers or account managers; We are Forex traders. The recordings on this channel are rigorously for educational and amusement purposes. Trading Forex implies dangers, and you can lose all your venture ; consequently, you exclusively must take a chance.

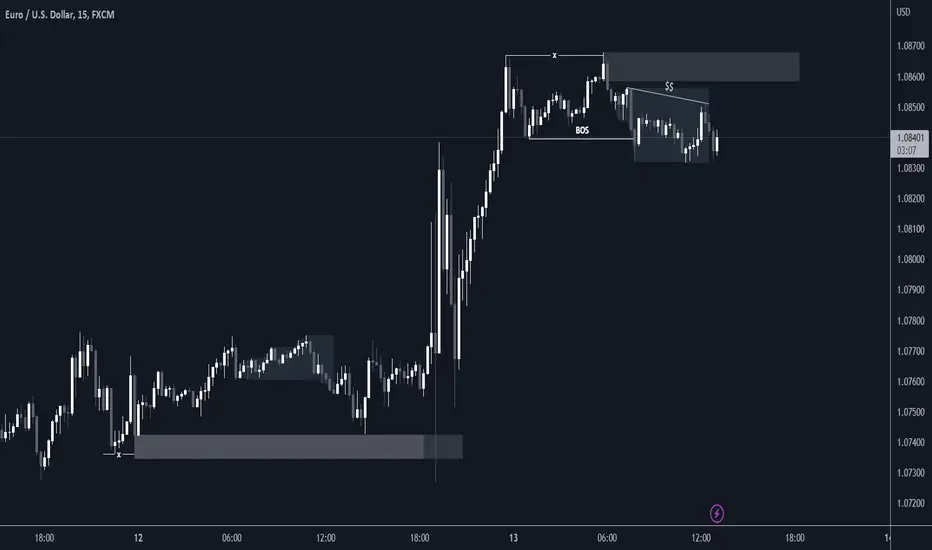
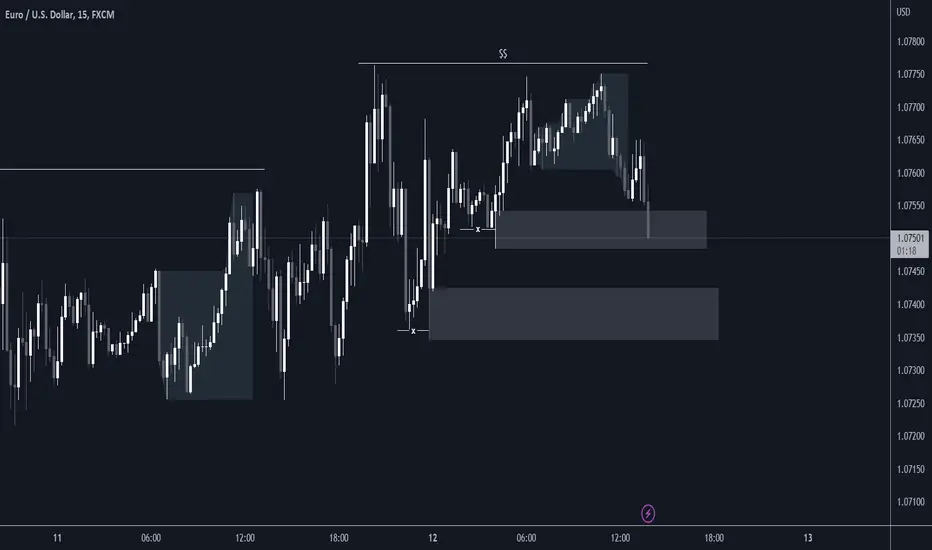
EURUSD SELLDISCLAIMER: The Company accepts no accountability or obligation for your trading and speculation results, and you consent to hold the Company innocuous for any such outcomes or misfortunes. We are not financial advisers or account managers; We are Forex traders. The recordings on this channel are rigorously for educational and amusement purposes. Trading Forex implies dangers, and you can lose all your venture ; consequently, you exclusively must take a chance.


eurusd making new high eurusd has broken its resistance last week which was respecting for the last 6 months now we are expecting a little pullback then move up here horizontal support will play a important role so we have to focus how this support will be valid

EURUSD Highs & Low BUY SELL Price 1.0868- 1.0780Stocks rise, dollar stumbles after U.S. inflation data
NEW YORK (Reuters) - A gauge of global stocks climbed on Thursday while longer-dated U.S. Treasury yields and the dollar fell after a reading of consumer prices fed expectations the Federal Reserve may have leeway to scale back the size of future interest rate hikes.
U.S consumer prices fell in December for the first time in more than 2-1/2 years as prices fell for gasoline and other goods, suggesting inflation was on a sustained downward trend.
Still, a separate reading on the labor market showed weekly initial jobless claims came in at 205,000, below expectations of 215,000. Many market participants are looking for signs of weakness in the labor market as a signal of slowing inflation.
On Wall Street, equities were choppy after the data, with the S&P 500 falling as much as 0.8% and then rebounding. Friday will bring results from a number of big U.S. banks, kicking off the fourth-quarter earnings season for S&P 500 companies.
The Dow Jones Industrial Average rose 216.96 points, or 0.64%, to 34,189.97, the S&P 500 gained 13.56 points, or 0.34%, to 3,983.17 and the Nasdaq Composite added 69.43 points, or 0.64%, to 11,001.11.
The pan-European STOXX 600 index rose 0.63%, closing at its highest level since April 29, and MSCI's gauge of stocks across the globe gained 0.80% to notch a fifth straight session of gains, its longest streak since August.
Expectations for a 50 basis point rate hike at the next Federal Reserve meeting fell to 3.8% according to CME's FedWatch Tool, down from 23.3% the day prior. The market is pricing in a 96.2% chance of a 25 basis point hike, up from 76.7% on Wednesday.
The benchmark U.S. 10-year notes were down 12.9 basis points to 3.427%, from 3.556% late on Wednesday.
St. Louis Fed President James Bullard said the inflation data was a step in the right direction and the U.S. economy was primed for disinflation this year, but the road back to the central bank's 2% target would be bumpy. Richmond Federal Reserve president Tom Barkin echoed the sentiment about the data and said it allowed the Fed to "steer more deliberately".
The dollar index hit its lowest level since early June at 102.07 before slightly paring losses, and was last down 0.873%, with the euro up 0.89% to $1.0851.
The Japanese yen strengthened 2.56% versus the greenback at 129.18 per dollar, while Sterling was last trading at $1.2215, up 0.60% on the day.
Crude prices rose in the wake of the data, getting an additional boost from optimism over China's emergence from its COVID-19 restrictions creating additional demand.
U.S. crude settled up 1.27% at $$78.39 per barrel and Brent settled at $$84.03, up 1.65% on the day.

EURUSDDISCLAIMER: The Company accepts no accountability or obligation for your trading and speculation results, and you consent to hold the Company innocuous for any such outcomes or misfortunes. We are not financial advisers or account managers; We are Forex traders. The recordings on this channel are rigorously for educational and amusement purposes. Trading Forex implies dangers, and you can lose all your venture ; consequently, you exclusively must take a chance.

Total market cap of cryptoIts a bullish sign of total market cap of crypto currency
Price is popping out of falling wedge and we can see a fake breakdown in weekly time frame
So it’s absolutely bullish sign

EURUSD - Long ; USD getting WeakerAs of my opinion EUR USD can go long to 1.13900. There's clear breakout now, we can expect a long position here. The USD is getting weaker day by day in the last couple of months.

My Elliotical Approach to EURUSD Short.Hello traders! I came up with this trading idea on January 2 2023 itself and will be attaching the link for the same as well. I was just waiting for the market to give us a better picture. As you can see on the chart, various guidelines point out the yellow zone to be a strong selling point with target levels at Wave 4 end(50% fib). We just have to wait for some price action to develop in the zone and from there on we can go short on EURUSD.
Thank you for viewing!
Profits,
Market's Mechanic.

EURUSD portrays bullish trend-widening formationEURUSD grinds higher around the seven-month top inside a rising megaphone chart pattern on the daily formation. In addition to the bullish chart pattern, the upbeat RSI and bullish MACD signals also keep buyers hopeful. That said, May 2022’s peak surrounding 1.0786 and 1.0800 are likely immediate targets for the bulls. However, the 78.6% Fibonacci retracement level of the pair’s March-September downside, near 1.0835, could challenge the upside momentum afterward. In a case where the quote remains firmer past 1.0835, the stated megaphone’s top line, close to 1.0960, should lure the optimists.
On the contrary, the one-month-old descending previous resistance line around 1.0700 restricts the short-term downside of the EURUSD pair. Following that, a pullback towards the aforementioned bullish pattern’s support line, adjacent to 1.0550, will be important to watch for sellers. Should the quote drops below 1.0550, a downward trajectory towards the 50-DMA and the 200-DMA, respectively near 1.0460 and 1.0300, can’t be ruled out. It’s worth noting that the quote’s weakness past 1.0300 could welcome bears with open hands.
To sum up, EURUSD is likely to remain firmer but the road to the north is bumpy and long.


EUR/USD Resistance Sell NowHello Traders Today Forecast EUR/USD Sell Now Because Price Come Resistance Zone Trade Ratio 1:2
This is only Forecast Must use SL


Monday market GOLD , SILVER , EURUSD We are seeing good sell with gold as dollar needs retracement of down fall which came on Friday night NFP , If gold breks 1865 beware !

woo usdt technical analysis woo usdt bouncing back from support
and can be entered for long after breakout of W pattern

spx500 technical analysis spx500 possible moves in 4hr tf
if moves upside can move till trendline of day timeframe

gold analysis after bouncing from weekly support gold is ready to give good move from coming out of this channel

Buy Signal on eur/usdSl and target given
Dyor
I provide trades with 90% accuracy
Check my account for my previous trades
