EUR/USD Had to Reverse After Facing 1.0500 ResistanceFX:EURUSD had to turn back when facing the 1.0500 resistance level. The euro’s weakness was mainly due to the strong recovery of the U.S. dollar, despite weak U.S. PMI data. However, this weakness was mitigated as support zones remain strong and active.
As seen on the chart, FX:EURUSD formed a new high, surpassing the previous peak. If this is not a false breakout, the pair has all the necessary factors to push higher in the near future (including an upward trendline, EMA 34 and 89 reversal, and a series of higher highs and higher lows).
However, in the short term, it needs to retest and accumulate more momentum, with support at 1.0460 and 1.0410 providing a crucial foundation.
Looking ahead, we should pay attention to key economic events that may impact FX:EURUSD including economic reports from the Eurozone and the U.S., as well as speeches from ECB and Fed officials. These insights could provide further clues on monetary policy and economic outlook, influencing the pair’s trajectory.
What about you? Do you think EUR/USD can sustain this uptrend?
Eurusd-4

EUR/USD: Continuing to Seek New HighsHey traders, what are you expecting from EUR/USD? Will it rise or fall?
From my perspective and analysis, it wouldn’t be surprising if EUR/USD continues to rise. The pair is moving around 1.050 and is strongly supported by the parallel price channel maintained by buyers.
EUR/USD’s target is further reinforced as it remains above the EMA 34 and 89 levels. As long as the price channel is protected, the strategy remains to buy when the price increases. The condition for this strategy is that the lower boundary of the channel must hold, and the 1.052 resistance must turn into support.
What about you? Do you agree with my view? Share your thoughts in the comments!

EURUSD - Elliott Analysis 1:14 Risk RewardFibonacci ratios are frequently used to anticipate the length and retracement levels of ABC waves:
Wave B: Traders often look for Wave B to retrace 38.2%, 50%, 61.8%, or other Fibonacci ratios of Wave A.
Wave C: Traders often look for Wave C to be equal in length to Wave A or related to it by a Fibonacci ratio (e.g., 1.618 times the length of Wave A).
Follow Chart

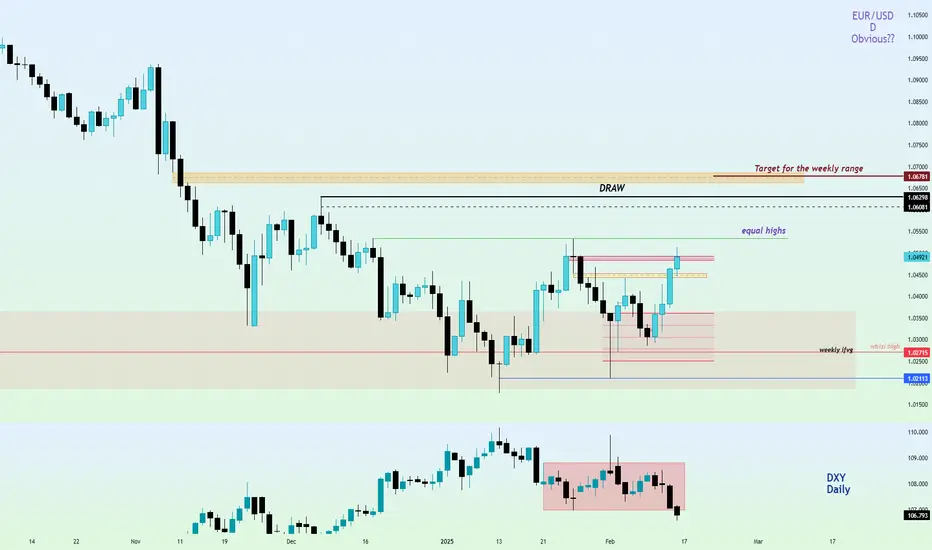
Fibre/EURUSD ready to move higher...Hello traders!
There is so much on the Daily chart of Fibre that points to obvious bullishness of the market that I could not place all of it on the chart. But I have marked what seemed crucial to be seen.
Market has taken smooth lows of 15th, 16th, 17th, & 20th January, 2025 and strongly rejected from 1.02113 . Also, observe how 20th January's daily candle shifted the market structure . We're inside a Bullish breaker on the daily, supported by a daily ifvg (check how the market has respected the consequent encroachment of that gap perfectly).
Things don't end here. DXY has broken the range to the downside with lower draws. Market symmetry is currently missing but Fibre should follow DXY soon.
The draw and the targets for the weekly range have been marked on the chart. Equal highs is the low hanging fruit.
Narrative is paramount when it comes to applying ICT concepts. That takes a lot of practice and time. Having said that, let's discuss when this idea will be marked as failed. 3 PDAs. If 3 PDAs fail on the daily timeframe, I'll not engage the market and wait for more feedback from the market.
Have a wonderful and learning-oriented week.
GLGT.
EURUSD: Will the bears reverse the trend?Dear Friends!
Selling pressure continues to weigh on the US Dollar and encouraged EURUSD to move to a fresh two-week high near 1.0500 following disappointing US Retail Sales figures.
Technically, as mentioned on the 3-hour chart, although the uptrend remains supported and the parallel price channel has been broken, there are signs of a potential top forming at 1.053. Current support is around 1.047. If this level is broken, it could send EURUSD lower, potentially reaching 1.041, which would coincide with a test of the 34 and 89 EMAs.
Have a nice day and good luck!

EURUSD: buy or sell?EUR/USD continued its recovery on Thursday, rising sharply above 1.0400 as the US Dollar (USD) took a hit.
The pair surged amid mixed market sentiment. A major correction in US bond yields, rising trade tensions and a cautious tone from Fed Chair Jerome Powell in his recent testimony added to the complexity of the story.
The current trend, coupled with the support of the 34 and 89 EMAs, gives us a bullish outlook for EURUSD. Current resistance is at 1.046 with support at 1.042 and 1.038. A break above the 1.046 resistance would open the way for further upside, as seen on the 1-hour chart. Traders can consider taking long positions.

XAUUSD Swing trade BOUGHT XAUUSD
📈~ Entry: 2,875
🚫Stop: 2,850
🎯Target: OPEN
Follow and leave a message for more information

EURUSD - 15M [SHORT TRADE IDEA]FX:EURUSD
Hello traders , here is the full multi time frame analysis for this pair, let me know in the comment section below if you have any questions, the entry will be taken only if all rules of the strategies will be satisfied. wait for more Smart Money to develop before taking any position . I suggest you keep this pair on your watchlist and see if the rules of your strategy are satisfied...
Keep trading
Hustle hard
Markets can be Unpredictable, research before trading.
Disclaimer: This trade idea is based on Smart money concept and is for informational purposes only. Trading involves risks; seek professional advice before making any financial decisions. Informational only!!!

EUR/USD Outlook: Tariff Concerns and Key Technical LevelsEUR/USD is stable around 1.0360 during the Asian trading session, after rising in the previous session. The currency pair may face downward pressure due to President Donald Trump’s plan to impose reciprocal tariffs, which could affect major countries such as Japan, the EU, and China. The Euro faces challenges as the Eurozone is particularly vulnerable to tariffs from the US. Risk-averse sentiment has also increased, compounded by the cautious stance of Fed Chairman Jerome Powell regarding interest rate cuts.
From a technical analysis perspective, EUR/USD is currently trading around 1.0360 and is likely to encounter strong resistance at 1.0400. This is a key level, and if it is surpassed, the pair could continue to rise towards the next target of 1.0450. However, if the price fails to maintain above 1.0400, it is likely that EUR/USD will continue its downward adjustment.
The nearest support level is at 1.0331, which was previously resistance and could now act as a significant support level. If the price breaks this support, the pair could continue its downtrend and find lower levels at 1.0290.
Technical indicators suggest that momentum is weakening, and overbought levels on the hourly chart are gradually declining, indicating the potential for short-term correction. However, if EUR/USD maintains above 1.0400, the pair could return to an uptrend. Investors should keep an eye on signals from indicators such as RSI and MACD to track further changes in the pair’s price direction.

USDJPY TRADE IDEA we can look for bearish move if price rejectedUSDJPY TRADE IDEA we can look for bearish move if price rejected from resistance level
This week trend is bearish in daily timeframe but there is a problem before taking a trade i look for a daily candlestick in red or bearish engulfing

Bearish outlook remains intact near 1.0300The EUR/USD pair continues to extend its decline, reaching around 1.0305 in the early European session on Tuesday. The U.S. dollar strengthened after U.S. President Donald Trump announced a significant increase in tariffs on steel and aluminum imports and stated that he would unveil reciprocal tariffs against other countries in the coming days.
From a technical perspective, the bearish outlook for EUR/USD remains intact, with two key resistance levels at 1.0396 and 1.0329. While the pair is encountering resistance at the 1.0329 level, breaking through this level does not necessarily indicate a strong upward movement, as the pair still faces the previous resistance at 1.0396. If the downtrend continues, the pair could potentially decline towards the 1.0210-1.0200 range.
Recommendation: Given the current bearish outlook and strong resistance levels above, entering a **sell** position around the 1.0329 or 1.0396 levels could offer a profitable opportunity. However, be cautious of fundamental factors that could change rapidly, especially any announcements from the U.S. government regarding tariffs.

EUR/USD wobbles ahead of US NFP reportEUR/USD is currently stable around the 1.0400 level, but the outlook for the Euro (EUR) remains uncertain due to concerns that the Eurozone may face losses from higher tariffs imposed by U.S. President Donald Trump. Last weekend, President Trump warned that Europe would certainly face tariffs for not buying enough U.S. goods, although he did not provide many details.
From a technical perspective, the EUR/USD pair could face downward pressure in the short term. The support level at 1.0228 is preventing the pair from dropping further, while the resistance at 1.0418 is the main reason for the temporary decline.
To manage risk, you may set a **Stop Loss (SL)** at 1.0450, just above the resistance level to protect against further upward movement. **Take Profit (TP)** can be set at the support level of 1.0228, where the pair may find stability and potentially recover. However, these levels can be adjusted based on your strategy and trading time frame.

EUR/JPY 4H Chart Analysis – Gap Fill Incoming?EUR/JPY 4H Chart Analysis 🏆📊
🚀 Current Price: 162.308
📍 200 EMA: 162.099 (Dynamic Support)
🔥 Key Levels & Insights:
🟥 Major Support Zone (Red Area - 162.000)
✅ Price recently bounced off this level, showing strong buying pressure.
✅ If price holds above 162.000, a bullish continuation is likely.
📈 Gap Zone (Orange - 163.000 - 163.500)
🔍 There’s a price imbalance above, meaning price could be drawn towards it.
🔼 Gaps act as magnets! A move up to fill the gap is likely.
📊 200 EMA (162.099) - Crucial Level
🚦 Price is hovering above the 200 EMA. If it remains above, we can expect further bullish momentum.
🔮 Price Prediction & Trade Idea
📌 If price breaks and holds above 162.500, expect a 🚀 move towards 163.500.
📌 Rejection from 163.500 could bring a pullback 📉 back to 162.500.
🚨 Risk Alert:
🔻 If price drops below 162.000, bears might take control, pushing it to 161.500 or lower.
💡 Final Thoughts:
👉 Bulls 🐂 need to break 162.500 to push towards 163.500.
👉 Bears 🐻 will gain control if price loses 162.000.
🔥 Verdict:
✅ Bullish Bias if price stays above 162.000.
🚀 Target: 163.500 (Gap Fill).
🔻 Invalidation: Below 162.000.

EURUSD NEXT POSSIBLE MOVEMENTHello traders , here is the full multi time frame analysis for this pair, let me know in the comment section below if you have any questions, the entry will be taken only if all rules of the strategies will be satisfied. wait for more Smart Money to develop before taking any position . I suggest you keep this pair on your watchlist and see if the rules of your strategy are satisfied...
Keep trading
Hustle hard
Markets can be Unpredictable, research before trading.
Disclaimer: This trade idea is based on Smart money concept and is for informational purposes only. Trading involves risks; seek professional advice before making any financial decisions. Informational only!!!

EURUSD - 1H LONGFOREXCOM:EURUSD
Hello traders , here is the full multi time frame analysis for this pair, let me know in the comment section below if you have any questions, the entry will be taken only if all rules of the strategies will be satisfied. wait for more Smart Money to develop before taking any position . I suggest you keep this pair on your watchlist and see if the rules of your strategy are satisfied...
Keep trading
Hustle hard
Markets can be Unpredictable, research before trading.
Disclaimer: This trade idea is based on Smart money concept and is for informational purposes only. Trading involves risks; seek professional advice before making any financial decisions. Informational only!!!

EUR/USD rises as Trump’s mild tariff plan reduces USD appealEUR/USD continues to maintain a solid upward trend above the key support level of 1.0400 in the European session on Wednesday, following a strong recovery in the North American session on Tuesday. The pair remains stable as investors assess the new tariff policies of the U.S. to adjust their positions.
Over the past two days, U.S. President Donald Trump announced a 25% tariff on imports from Mexico and Canada, and 10% on China, effective from February 1. Trump also threatened to take measures to address the U.S. trade deficit with the European Union, though he has not provided specific details. Earlier this week, Trump stated that he would tackle the issue by "increasing tariffs or requiring the EU to buy more oil and gas from the U.S."
However, these tariff threats appear less aggressive than market expectations, reducing demand for safe-haven U.S. dollars (USD). The U.S. Dollar Index (DXY), which tracks the value of the greenback against six major currencies, is currently trading near its lowest level in two weeks, around 107.90.
EUR/USD is trading steadily near its two-week high of 1.0430 in the European session on Wednesday, after rebounding from a more than two-year low of 1.0175. The pair has recovered strongly, thanks to a positive momentum divergence and price action. However, a bearish divergence signal would be confirmed if EUR/USD breaks above the immediate resistance level at 1.0440.

EUR/USD stays below 1.0400 after Trump's tariff commentsThe EUR/USD pair is currently facing strong selling pressure, trading around the 1.0380 level during the Asian session on Tuesday, after partially recovering from recent losses. The Euro continues to be negatively impacted by expectations of a dovish stance from the European Central Bank (ECB). The market expects the ECB to continue cutting interest rates by 25 basis points in upcoming policy meetings, due to concerns over the Eurozone's economic outlook and low inflation.
These expectations are further reinforced by the belief that inflation in the Eurozone will remain stable near the ECB's 2% target, while uncertainty surrounding US trade policies is increasing.
Technically, key support levels for EUR/USD are at 1.0260 and 1.0180, with a strong resistance level at 1.0410. If EUR/USD fails to hold above these support levels and breaks through them, the downtrend may continue, with the next target potentially being 1.0100.
Traders may consider selling if the pair continues to decline and fails to break the resistance level at 1.0410. A sell entry could be placed at 1.0400, with profit targets at 1.0260 and 1.0180. Be sure to set a reasonable stop loss (SL) at 1.0450 to protect the account in case of an unexpected market reversal.
In conclusion, with the combination of bearish fundamentals and technical signals, EUR/USD may continue its downtrend if it breaks the key support levels of 1.0260 and 1.0180. Traders should pay close attention to these levels for potential selling opportunities.

EUR/USD regained the 1.0300 level ahead of Trump's inaugurationDuring the European session on Monday, EUR/USD regained the 1.0300 level, benefiting from market optimism and a weakening US dollar. Investors are currently preparing for the inauguration of President-elect Donald Trump, which has boosted positive sentiment and led to a decline in the greenback. The market's focus on important political and economic events has created an opportunity for the Euro to recover.
From a technical perspective, the pair is maintaining an uptrend, with strong support at 1.019. If the price pulls back towards this support level, it could present a buying opportunity. On the other hand, the key resistance level is at 1.032, where the price might face strong resistance. If EUR/USD manages to break through this resistance, the pair may continue its upward trend towards higher levels.
Traders should closely monitor price action around the support level of 1.019 and the resistance at 1.032. A breakout through these levels could signal clear buy or sell opportunities depending on the market's next move.
Key Levels to Watch:
Support: 1.019
Resistance: 1.032
Trading Strategy:
Stop Loss (BUY): 1.018
Take Profit (BUY): 1.035
Always keep a close eye on market developments and apply sound risk management strategies to optimize profits and minimize losses. Good luck with your trading!

EURUSD Short IdeaThe OANDA:EURUSD is currently in a downtrend, and any price bounce presents a selling opportunity.
-These bounces are temporary.
-Last Friday, a bullish candle was formed, but the price is approaching a supply zone marked on the chart, which is approximately between 1.03400 and 1.03800.
-To reverse the trend, the price must sustain itself above this supply zone and break the recent swing high.

Eurusd FFVG 1:10EUR/USD struggles to stage a rebound on Friday and continues to trade below 1.0400 following Wednesday's sharp decline that was caused by the Federal Reserve's hawkish tone. Investors await November PCE inflation data from the US.

EUR/USD Technical and Fundamental OutlookAs the week comes to a close, EUR/USD is trading around 1.0575, maintaining its bullish momentum. The pair is moving within an ascending wedge pattern, supported by the EMA 34 and EMA 89, which underscores a steady upward trajectory.
From a technical standpoint, the price is holding near the upper boundary of the wedge, with immediate resistance seen at 1.0585. A breakout above this level could pave the way for further upside, targeting the next significant level around 1.0620. This structure signals a potential continuation of the bullish trend if key resistance levels are breached.
On the fundamental side, the current uptrend is bolstered by positive sentiment surrounding data from the Eurozone and a weakening demand for the US Dollar. These factors are creating a supportive environment for the Euro, encouraging sustained buying pressure in the pair.
Looking ahead, traders should closely monitor the wedge breakout, as it could provide a clearer signal for the pair's trajectory into next week. Whether EUR/USD extends its gains or faces rejection at resistance will largely depend on both technical confirmations and evolving market fundamentals.

EUR/USD: Bearish Pressure IncreasesEUR/USD marked its second consecutive day of gains, extending its recent breakout above the 1.0500 level in response to the US Dollar's uncertain stance ahead of key US data releases later this week.
The 4-hour chart indicates that technical risks remain tilted to the downside, as the pair continues trading below all its moving averages. These averages maintain a bearish slope, creating dynamic resistance around the 1.0560 level. Meanwhile, technical indicators remain within negative territory, lacking clear directional strength.
In the short term, and according to the 4-hour chart, EUR/USD appears poised to extend its decline. The pair is trading below the bearish-moving averages, encountering sellers near the EMA 34 and 89 levels. Finally, technical indicators are neutral-to-bearish, positioned below their midlines, supporting the extension of the downtrend without providing a definitive confirmation.
Support levels: 1.0465, 1.0420, 1.0370
Resistance levels: 1.0560, 1.0625, 1.0660

EUR/USD: Bearish Signals Strengthen Near Key ResistanceWhen observing the 4-hour chart, we can see that the EUR/USD pair is hovering near a strong resistance zone (marked in red). This is a region where selling pressure has significantly increased during previous trading sessions, making it difficult for the price to break out. In this context, the signals for a potential bearish trend are becoming increasingly evident.
One notable factor is the position of the EMA 34 and EMA 89 lines. With the price trading below both moving averages, they are acting as dynamic resistance levels, pushing the price lower each time it attempts to recover. This further reinforces the view that selling pressure continues to dominate the current market.
Additionally, the previous downside gap has yet to be filled, which is often a technical indication that bearish pressure remains. As the price approaches the resistance zone of 1.0550 - 1.0560, the likelihood of rejection from this level is high, especially in the absence of strong buying momentum.
If the price fails to break through this resistance zone, the possibility of a decline to lower support levels opens up. The nearest support is located at 1.0487, but a more prominent target lies in the 1.0420 - 1.0400 range. This is a critical support zone that could serve as a stopping point if the bearish trend continues.
Based on this analysis, a bearish trading strategy should be approached with caution. Traders may consider entering a sell position around the 1.0550 - 1.0560 resistance zone, with take-profit targets at 1.0480 and 1.0420, respectively. A prudent stop-loss level would be above the resistance zone, around 1.0575, to minimize risk.
Overall, the market is currently leaning toward a bearish outlook, but waiting for clear reactions at the resistance zone is crucial to ensure trades are executed at optimal levels. This approach provides greater security in a market that remains potentially volatile.
