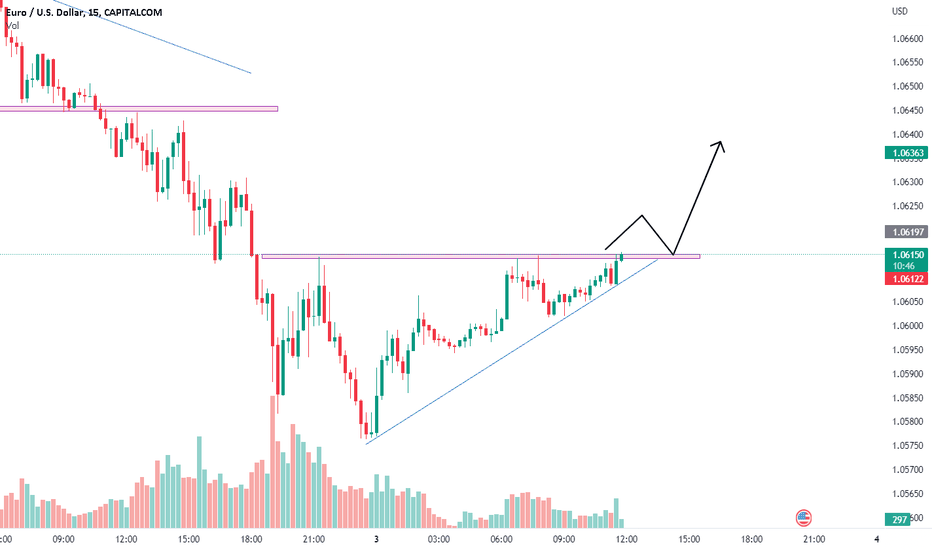
EUR/USD TRADE STEPUP :-Today Euro made it 4 months $1.04958 and also November 2023 euro made its low $ 1.04477 after multiple times tested this level.today euro made daily time frame on insider candle .if euro breaks yesterday high than much possibly euro can drive up side move to $1.06824 levels.
stay tuned with me for more updates:-
Eurusd1hr
A big red candle > whats next on EurUsdwe were expecting to go long on order block of 1.0700 but price didnt retest the zone at first and whoever bought with direct limit order their stop loss was taken out but we had calculated risk of 20 pips
but if the conservative trade who waited for choc entry the entry did not triggred
.......................... thats the wrap from previous analysis ....................
currently the big bar candle will be tempting for further selling point
the reason for big red candle is because of sundden bounce on DXY index
euro had opposite reaction to the price chart
.............................................................................................
tenchnically wait for the price to make choc on 1h time frame
and from that bos we look for trade if the setup complete of higher low and higher high then
only we will look for buying side
1.06930 to 1.06300 will the area where price will hunt for liquidty pools
if the 4h candle closes below this level then only we will look for bearish side
Eur/Usd update (A conditional Buy)price hovering near the higher time frame demand area had given signal of choc previous condering it as bullish change we waited for new confirmation the latest low we saw was at 1.06859, so if the price goes below this area and makes a wick forcing price to close above 1.06859 then this is confirmation of liquidity sweep and we can enter long
fyi - this is just a insight im providing through similar scenario i have seen , also keep track on dxy if dxy starts making lower high and lower low in 1h time frame then other usd related pair will get benifits also EURO
this liquidity sweep is likely to happen in london session
Huge Falling Wedge & Double Bottom It's important to note that the behavior of the EURUSD pair can be influenced by a wide range of factors such as global economic conditions, political developments, supply and demand, and market sentiment. Therefore, it's important to do your own research, analyze the market conditions, and consult with a qualified financial advisor before making any investment decisions.
However, I can provide an explanation of the chart patterns you mentioned, which are the falling wedge pattern and the double bottom pattern.
The falling wedge pattern is a bullish chart pattern that occurs when the price of an asset is trading within a downward sloping channel but with a contracting range. This pattern is characterized by a series of lower highs and lower lows that form two converging trendlines that slope downward. The falling wedge pattern is formed when the price reaches a support level and starts to consolidate, with the lows getting higher and higher while the highs maintain their level, indicating that the sellers are losing momentum. Once the price breaks above the upper trendline of the wedge pattern, it can indicate a trend reversal, and traders may consider buying the asset.
The double bottom pattern is also a bullish chart pattern that occurs when the price of an asset forms two distinct lows at approximately the same price level, separated by a high. This pattern is formed when the price reaches a support level, bounces off it, and then falls back to the same level before bouncing again. The double bottom pattern indicates a potential trend reversal, and traders may consider buying the asset.
It's important to note that chart patterns are just one of the many tools used by traders to analyze the market, and they should not be relied on exclusively for investment decisions. Additionally, it's essential to use risk management techniques, such as setting stop-loss orders, to limit potential losses if the trade does not go as expected.
In summary, the falling wedge and double bottom patterns are bullish chart patterns that can occur in the EURUSD pair or any other asset, and they indicate a potential trend reversal. However, investors should conduct thorough research and analysis and consult with a financial advisor before making any investment decisions based on chart patterns. The FED news can also influence the price of the US dollar, but it's important to keep in mind that market conditions can change rapidly, and it's crucial to constantly monitor the price movements of the asset and adjust investment strategies accordingly.
EURUSD pullback on 1,2 & 4hrLately EURUSD made downward impulsive move and now is ready for pullback 📈
Things to consider:
1. Daily impulse and correction pattern spotted
2. Retracement started and target is 0.382 on Fibonacci
3. COT data shows that hedge funds have been longing EUR so it will rise for sometime now!
How to enter:
1. Study the chart as shown in my analysis
2. Enter when the 5 and 15 MA crossover (5 above 15)
3. Macd crossing signal line
4. Break of the downtrend line
5. Entry and target on the chart
ALL THE BEST!


