EUR/USD Bullish Continuation Analysis EUR/USD Bullish Continuation Analysis 🚀💶
📊 Chart Summary:
The EUR/USD pair is demonstrating a strong bullish structure with consistent higher highs and higher lows. Recent price action shows a breakout above the 1.16386 resistance level, now acting as support 🛡️. The market is currently retracing and might retest this new support zone before continuing its upward move toward the target.
🔍 Key Observations:
🔸 Bullish Structure:
Multiple bullish impulses have formed a clean staircase pattern (🔼⬆️), indicating sustained buying momentum.
🔸 Support Zone 🟦 (1.13200 - 1.14000):
This zone has been tested multiple times, confirming its strength and the base of this bullish rally.
🔸 Breakout & Retest 🟠:
Price broke above the 1.16386 resistance level, pulled back slightly (highlighted by the orange circle), and now looks ready for a potential continuation to the upside.
🔸 Target 🎯: 1.18010
A clear target has been set based on measured move or resistance projection. If the price respects the current structure, we may see a continuation toward this level.
✅ Trade Outlook:
Bias: Bullish 📈
Entry Zone: Around 1.16386 (upon bullish confirmation)
Target 🎯: 1.18010
Invalidation ❌: Break below 1.1600 with bearish momentum
🧠 Technical Tip:
Always wait for confirmation on the retest before entering. Wick rejections or bullish engulfing candles at the support zone can provide additional entry confidence. 🔍✅
Eurusd4h

EUR/USD Potential Rejection from ResistanceTechnical Overview:
The EUR/USD chart exhibits signs of a bearish reversal pattern forming near a key resistance zone (1.15800 - 1.16000), highlighted with repeated rejection wicks (🔴 red arrows). Price is currently trading at 1.15222, after failing to hold above the neckline of the rounded bottom pattern.
🔍 Key Observations:
🔺 Resistance Zone: Strong resistance has been confirmed multiple times (red arrows), indicating sellers are active at the top.
🟠 Double Top / Head & Shoulders Behavior: Price action shows topping formations (highlighted with orange circles), suggesting exhaustion of bullish momentum.
📉 Bearish Breakdown Possibility:
Price rejected near neckline and is showing bearish candle formations.
Breakdown from the current consolidation zone could push price toward the target zone at 1.14491, marked in purple.
This aligns with previous support structure, reinforcing a technical downside projection.
🔻 Support Zone: Around 1.13800 - 1.14000 is a strong area of demand and may act as the next bounce point if the bearish move continues.
📐 Chart Pattern Structure:
Rounded bottom formed earlier, but the failure to continue higher and breakout suggests a false breakout trap for buyers.
Downward sloping trendline broke, but now price is struggling to sustain above previous highs.
📌 Conclusion:
⚠️ Caution for bulls as price shows signs of weakness at resistance. A move below 1.15000 may initiate further downside toward 1.14491 and possibly lower. Short-term traders can watch for confirmation candles near this zone for entries.
📅 Short-Term Bias: Bearish
🎯 Target: 1.14491
⛔️ Invalidation: Strong breakout above 1.16000

EUR/USD Bullish Reversal Breakout Pattern EUR/USD Bullish Reversal Breakout Pattern 🚀📈
📊 Technical Analysis Summary:
The chart illustrates a strong bullish reversal pattern forming on the EUR/USD pair:
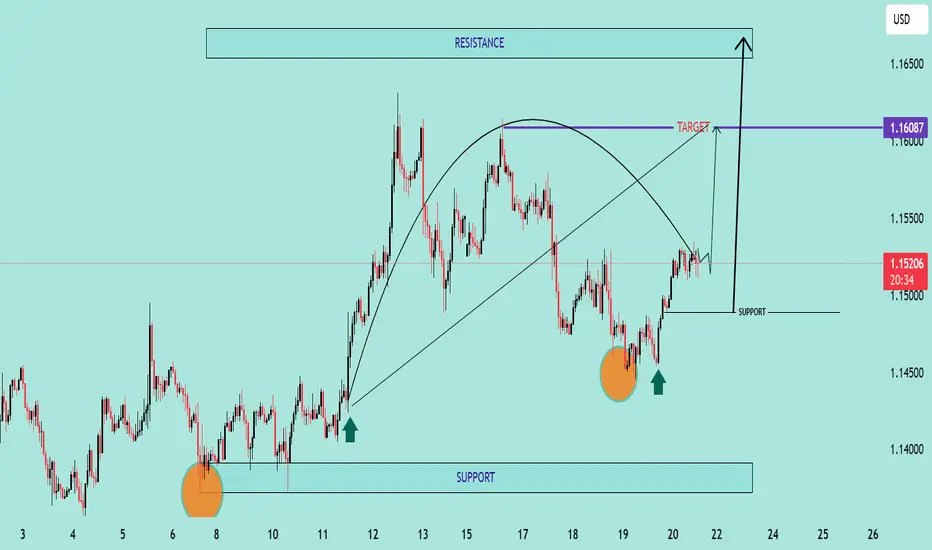
🔹 Double Bottom Formation (🔶🔶):
Two clear bottom zones are marked with orange circles near the 1.14400–1.14500 area, indicating strong buying interest and support.
The second bottom confirms the double bottom pattern, often a precursor to an upward trend.
🔹 Support Zone (📉):
Firm support around 1.14450, as highlighted on the chart.
Price has respected this zone twice, bouncing back with bullish momentum each time.
🔹 Neckline Breakout (🔼):
Price is approaching the neckline zone at 1.16087, which acts as the bullish target.
A break and close above this neckline will confirm the reversal and open the way toward the resistance zone around 1.16500.
🔹 Projected Move (🎯):
If the neckline breaks, price is expected to surge towards 1.16500, aligning with the historical resistance.
This move completes the measured target projection from the double bottom structure.
🔹 Bullish Structure:
Higher lows and strong bullish candles are reinforcing the uptrend momentum.
Curved trajectory shows accumulation followed by a breakout phase.
📌 Key Levels to Watch:
Support: 1.14450 – 1.14500
Neckline/Target: 1.16087
Resistance: 1.16500
🛑 Invalidation:
A strong breakdown below support (1.14450) would invalidate this bullish setup.
✅ Conclusion:
EUR/USD is exhibiting a textbook bullish reversal setup with a potential breakout above 1.16087 likely to trigger further upside toward 1.16500. Ideal scenario for bullish entries on
$EUR 4hr ChartMonthly Timeframe → April Month Low is Target.
Weekly Timeframe → Weekly FVG to be Draw.
4H Timeframe → Trendline Liquidity is Target

Eur-Usd buying levelscurrently price is not in good place to make long trades
we have one medium time frame resistance and two bearish order block coming in way
let the price pullback to the level of 1.0575 & 1.05180 for long initating and
can have the target of 1.07800
with good risk to rewards

EURUSD BuyCAPITALCOM:EURUSD
EURUSD At 4hr time frame it is in side ways and it taken support at 1.05233 level more than 2 times and my prediction is it give some up side movement. plan your trade accordingly
