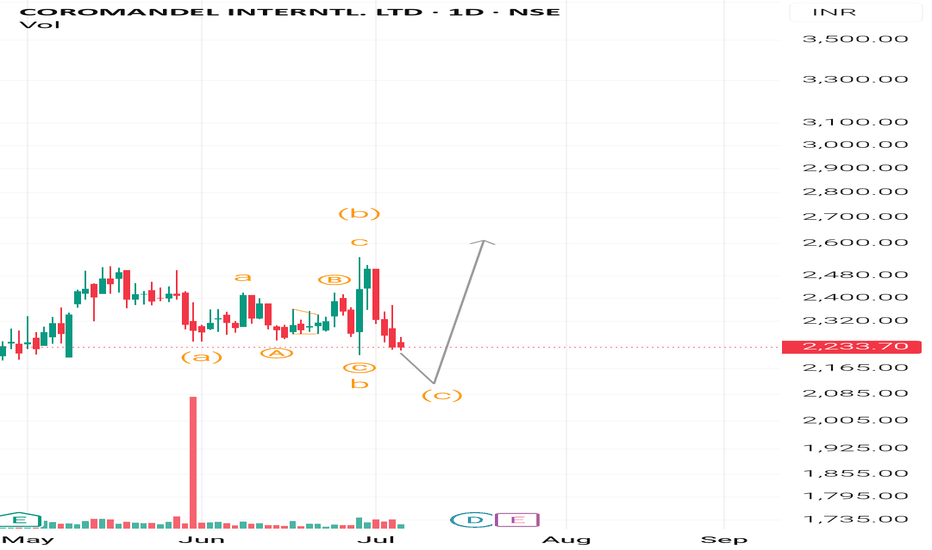
Expandedflat
EXPANDED / IRREGULAR FLAT CORRECTIONHello Friends,
Here we had shared some major points and characteristics of Expanded Flat Correction also known as Irregular Flat Correction in Elliott waves.
Principles of Irregular / Expanded Flat correction pattern
1) 3 waves corrective pattern which is labelled as A-B-C
2) Subdivision of wave A and B are in 3-3 waves
3) Subdivision of wave C is in 5 waves
4) Wave B of the 3-3-5 pattern completes beyond the starting level of wave A
5) Wave C completes beyond the ending level of wave A
Fibonacci measurements
Wave B is always 123.6% to 138.2% of measurement of wave A
Wave C completes at least 123.6% to 161.8% of wave A which starts from end of wave B
I am not sebi registered analyst.
My studies are for educational purpose only.
Please Consult your financial advisor before trading or investing.
I am not responsible for any kinds of your profits and your losses.
Hope this post is helpful to community
Thanks
RK💕
Most investors treat trading as a hobby because they have a full-time job doing something else.
However, If you treat trading like a business, it will pay you like a business.
If you treat like a hobby, hobbies don't pay, they cost you...!
Disclaimer and Risk Warning.
The analysis and discussion provided on in.tradingview.com is intended for educational purposes only and should not be relied upon for trading decisions. RK_Charts is not an investment adviser and the information provided here should not be taken as professional investment advice. Before buying or selling any investments, securities, or precious metals, it is recommended that you conduct your own due diligence. RK_Charts does not share in your profits and will not take responsibility for any losses you may incur. So Please Consult your financial advisor before trading or investing.
Chennai Petro Expanding flat correctionStock near ATH, it has completed Expanding flat correction on Monthly scale.
Following third wave rally should be huge.
Had checked basic fundamentals looks attractive.
Invalidation level given is based on weekly close which is 20% lower and is quite big SL and risky.
Target 3x-6x based on fib extension 2.618-4.618
DISCLAIMER:
There is no guarantee of profits or no exceptions from losses.
The stock and its levels discussed are solely the personal views of my research.
You are advised to rely on your judgement while investing/Trading decisions.
Seek help of your financial advisor before investing/trading.
Investment Warnings:
We would like to draw your attention to the following important investment warnings.
-Investment is subject to market risks.
-The value of shares and investments and the income derived from them can go down as well as up.
-Investors may not get back the amount they invested - losing one's shirt is a real risk.
-Past performance is not a guide to future performance.
-I may or may not trade this analysis
--------------------------(((((LIKE)))))-------------------------------
OIL INDIA LTDOil India seems a good buy at this level for a target of 220 - 236 with a SL of 191. There are multiple confirmations indicating a good short term upside in the stock , so probably it may do good in this week. Detailed explanation has been given in the chart itself, Please go through.
CHART & ANALYSIS
ADARSH DEY
Expanded Flat or Irregular Correction IdentificationMost common found pattern. Its temporary pause to extended rally.
Key to identify this pattern is rejection after breaking wave A start.
Always look for very smaller margin rise above start of wave A.
C wave is sharp fall to reach 0.382 Fibonacci retracement of rally.
All other details explained in chart. Comment your doubts.
l&TFH LONG Trend line support The Stock took support at trendline and 0.5% retracement level so wait for any reversal and took the position or else wait for a breakdown
Disclaimer: Please consult your financial advisor,
Investment/Trading in the securities market is subject to market risk, We are not responsible for your profit or loss
GOLD : YELLOW PRECIOUS METAL : DOING EXPANDED FLAT CORRECTIONLong ago a surge in GOLD price rally stopped in the year 2011 & the point has been designated as a primary wave-5 by all the elliottician. From that level we have seen a correction upto the level of 1045 $. A nice corrective move.Right from that level GOLD price raised up & currently trading in a all time new highs range. But this rally from the lows 1045$ is looking more corrective than an impulse. As per the current price structure we can assume that GOLD price is forming an EXPANDED FLAT CORRECTIVE pattern. And currently we are in the last phase of WAVE-B (circle). The wave-B (circle) is unfolding in a 3 wave corrective structure as w-x-y pattern. We are in the last phase wave-y which often takes place as an impulse rally which is discussed in the short term view over GOLD. The link is attached to this idea for the short term view.


