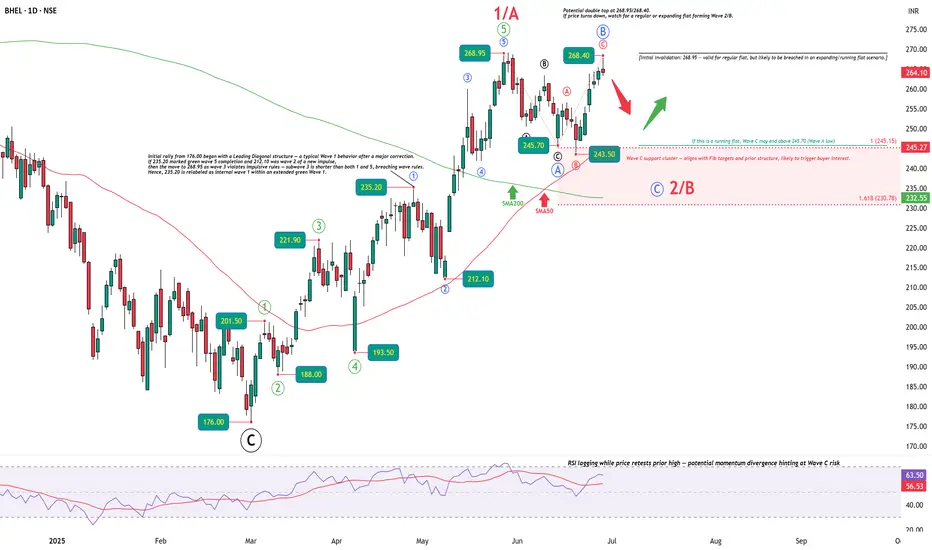
BHEL – Wave 2/B Pullback in Play?After a strong 5-wave rally from 176.00 to 268.95, BHEL may be entering a corrective phase — either a regular, expanding, or even a running flat.
Price has formed a potential double top at 268.95/268.40. The pullback from here could complete a Wave C within the 245–232 zone, supported by Fibonacci extensions and prior structure.
🔻 Short-term bias: bearish, targeting Wave C completion.
⚠️ However, if this turns out to be a running flat, Wave C may end above 245.70 (Wave A low) and still be valid — so price may reverse early.
📉 RSI is lagging as price retests highs — hinting at weakening momentum.
📌 Key Levels:
Invalidation for short-term short: 268.95 (tight; likely breached in expanding/running flat)
Wave C zone: 245.15 to 230.78
Structural invalidation (bullish view fails): below 230.78
🟢 Big picture: bullish.
This correction is likely setting up the next impulsive Wave 3 or C toward new highs.
Let price confirm it.
Disclaimer:This analysis is for educational purposes only and does not constitute investment advice. Please do your own research (DYOR) before making any trading decisions.
Expandingflat
FLAT Correction in keystone realtors.Elliott Wave Analysis:-
FLAT correction
View1:-
a) wave correction was over and in b) wave correction c wave is pending either it should close above 658.75 then it will form expanding flat if it close below then it is a regular flat and it is expecting a break a) wave and it would reach the level of 533-549 .
View2:-
a) wave was completed and b) wave was completed and in c) wave formation I&ii wave was formed and iii, iv, v wave’s is expected to fall further directly from the current place.
Further we wait and watch
I’m not a sebi registered advisor.
Kindly do your own analysis before taking trade.

Affle India Ltd-1WGoing through the Affle India Chart, It seems it is in major 4th wave and making an expanding flat wherein the (b) point has retraced beyond beginning of (a) point. It seems it is making a 3:3:5 structure, currently we are in 4th of C leg of the Flat. C leg is supposed to be in 5 wave structure. The correction may end near 820 and the longs in the instrument may be initiated near 820-910 levels i.e., .618x /.382x extension of 3rd wave.
This is only a view not a trade/investment advice.
Before going for any investment please take the advice of your financial advisor.
Please like if the chart is worth it.
Regards
