This Multi time frame Trick will save you from FAKEOUTSIn this video I am showcasing a daily, weekly and monthly time frame combination - also sharing a trick which can save you a lot of money from those regular sized fakeouts .
Charts used are 3 months old in this video and video is purely educational based .
Fakeout

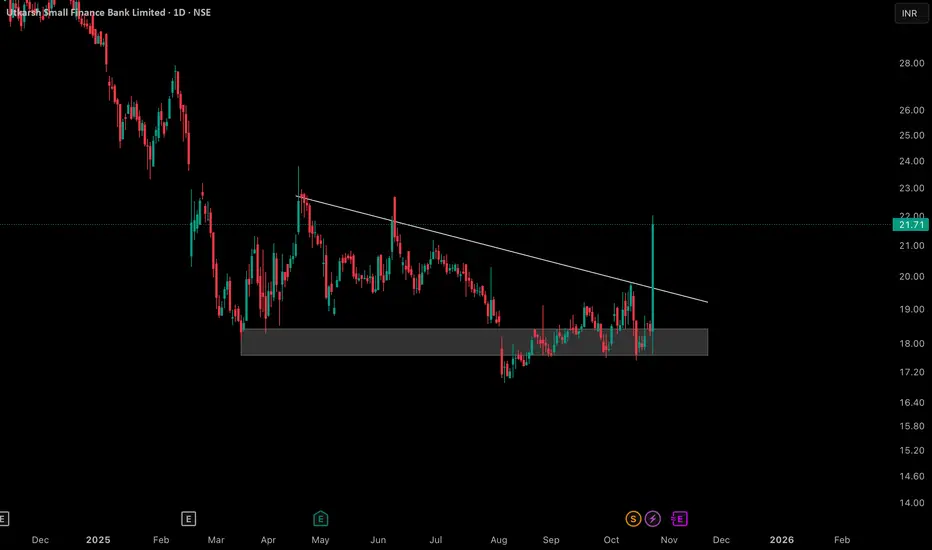
Descending Triangle fake breakdowns explainedThe daily chart for Utkarsh Small Finance Bank Limited displays a well-defined descending triangle, marked by a consistent supply trendline and an established horizontal support zone. During the recent price action, there was a temporary dip below the support, which was quickly retraced as price action returned within the range and formed a distinct lower wick rejection candle at the base.
This chart highlights the role of false moves and re-entries within important technical zones, as well as the reaction to a descending trendline. No trading advice or forecast is implied—this is for educational and analytical purposes, providing an example of how certain classical patterns and market behaviors may unfold within price structure.
How to Identify Right Breakout Candle ? Stocks and Price actionI make educational content videos for swing / positional trading .
In this I am sharing some information out of the vast trading knowledge I have gained through my experience in the markets .
Charts used are older than 3 months

Buy, Sell or Skip? Read Breakouts and VolumesExplore how to judge breakouts using TradingView's bar replay, leveraging 3-month-old charts and price action principles that apply from 5-min to monthly timeframes. Sharpen your technical edge—educational insights only.
Disclaimer: This content is for educational purposes and not financial advice. Always do your own research before making trading decisions.

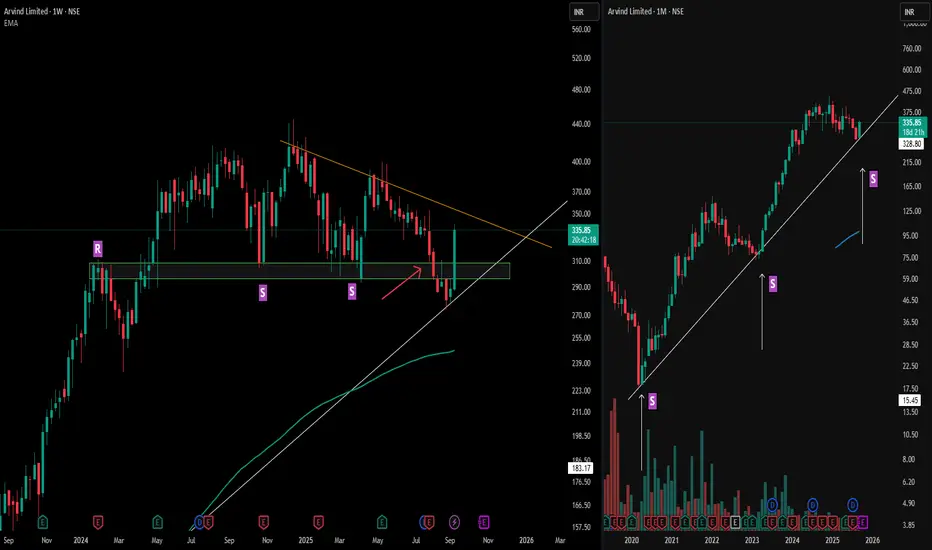
Arvind : Spotting Fake Breakdowns with Multi-Timeframe SupportArvind Limited highlights how a broader perspective can clarify deceptive price moves.
On the left (weekly), resistance ("R") flipped into support ("S") multiple times, with the orange counter trendline framing the recent structure. The red arrow marks a moment when weekly support appeared broken—a classic fake breakdown as price quickly reclaimed the zone with decisive strength.
Looking right (monthly), the MTFA view explains the recovery: a long-standing trendline support anchors the zone, helping absorb downside attempts and fueling the swift reversal. This alignment across timeframes illustrates how long-term technical structures often override short-term volatility, and why reviewing bigger picture charts is essential for pattern validation—not for prediction.
Disclaimer: This analysis is for educational purposes only and does not constitute investment advice. Always do your own research before making financial decisions.
Buy, Sell, or Skip? Backtesting Charts with Bar Replay!Using TradingView’s Bar Replay, I break down an old chart and reveal the exact logic behind whether it was a buy, sell, or skip trade. Perfect for traders who want to sharpen entry-decisions with real market context.

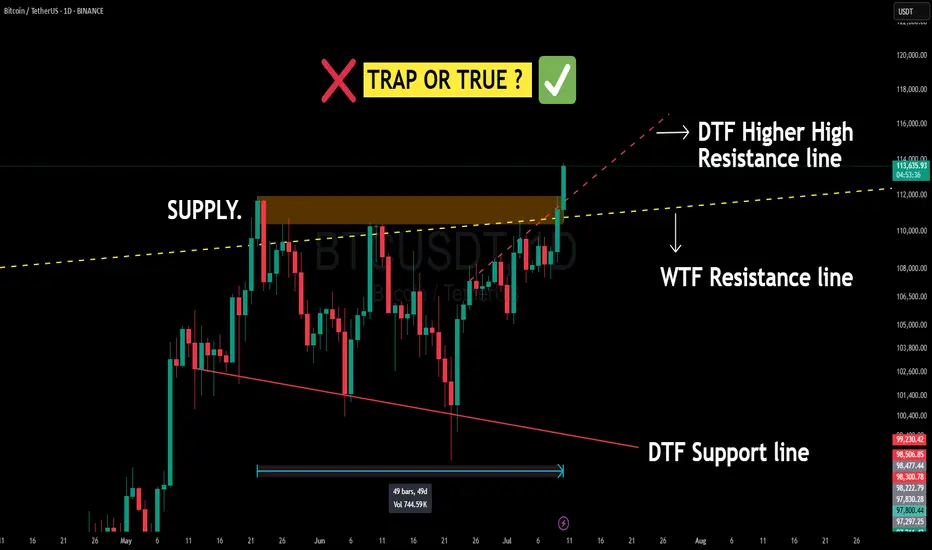
BITCOIN Just Smashed a 50-Day Supply Wall — Breakout or Fakeout Bitcoin (BTC/USDT) on the Daily & Weekly Timeframe just pulled off something BIG:
✅ Broke out of a 50-day consolidation range
✅ Closed above a strong Daily supply zone
✅ Cracked both DTF & WTF resistance lines (including a higher-high dynamic DTF resistance)
✅ Volume confirmation with a strong green candle
📌 This is an extremely bullish structure for short-term scalping ideas.
But Wait — What’s Happening Technically?
Supply Zone: This orange box is where BTC got sold off multiple times before. Breaking above this = strong bullish intent.
⚠️ Caution: Bitcoin is the King of Fakeouts 👑🐍
BTC has a notorious nature for false breakouts, trapping both bulls and bears. That’s why:
🧠 Best Strategy = Trap Trading OR
⏳ Wait for a pullback and retest of broken zones on higher timeframes . Plan your trade - trade your plan .
Don't chase — let price come to you.
💬 Drop your thoughts / doubts in comments.
📌 Not financial advice — just me and my Emotions
Mastering Horizontal Breakouts: Avoid Traps with ExamplesCommon Pitfalls: Identify and avoid typical traps associated with horizontal breakouts.
Multi-Time Frame Analysis (MTFA): Learn how to apply MTFA for more accurate market predictions.
Selective Trading: Discover techniques to bypass low-probability setups and seize high-opportunity trades.
Charting Techniques: Explore adaptive charting methods with real-world examples to enhance your trading strategy.

How to identify what not to trade with 2 Solid examplesI daily make educational content videos for swing / positional trading

All PSU Bank stocks are fakeouts according to my setups I daily make educational content videos for swing / positional trading

5 examples on Breakout vs Fakeout and Ideas for 3 Oct I make educational content videos for swing / positional trading

Breakouts vs Fakeouts and 1 swing trade idea for 4 September I make educational content videos for swing / positional trading

Short Trade in IOCAfter a fake breakout of Descending triangle pattern in IOC, stock is looking weak with neutral results. After closing below 165, stock can achieve target of 152. Also, stock is trading under 50SMA. RSI is also near 49.

GLAXO | FAKEOUT OF DESCENDING TRIANGLE?The descending triangle is a pattern that leads to big explosive moves once price breaks out either side of the triangle.
Here in Glaxo, the price does seem have to broken to the downside, but the candles formed in the yellow box above, do seem to suggest a fake breakdown.
The formation of a Bullish Harami cross, with heavy volumes suggest more buying down there.
(A Bullish Harami formation is when there is an inside bar formed next to a bearish mother candle, and the next candle crosses the high of the Mother candle)
A stochastic crossover in the Oversold zone also suggests buying coming in instead of selloff
POINTS TO NOTE BEFORE INITIATING LONG:
1. A breakdown of a descending triangle, yet the follow-up selloff is missing.
2. Formation of a Bullish Harami Cross suggesting buying
3. A stochastic crossover in the Oversold zone.
4. Last but not the least, if it does turn out to be a fakeout, the RR is close to 5.5. (Considering the target after a successful breakout to the upside as the pattern height)
Considering the above points, a long can be initiated as follows:
Entry 1450
SL 1370
Targets 1870
RR 1:5.5
As always trade according to your risk appetite. And always enter your SL first.

DABUR | Next INDIAMART?The way Indiamart did as you can see in the last post,
showing Dabur with somewhat similar conditions.
It gave fakeouts and Reversed.
Let's See if this performs same the way Indiamart did.

INDIAMART | Fakeouts History & PerformanceIndiamart tried to break the range twice and ultimately turned out to be doing fakeouts.
Later we can see how amazing it performed.
I will be sharing another post on the stock that is currently doing the same and could be a good opportunity.
Check the next Post for that.

How to approach a breakout vs fakeout trade | MirzaIntI daily make educational content videos for financial markets for swing trading

An attempt to time the marketThere clearly is fear in the market. In most cases, this is an excellent opportunity to start taking risks aggressively but one needs to have some sort of confirmation in order to make the most of fear. Keep trading like you generally do. Drawdowns are natural just make sure the risk is low enough. It's drawdowns like these that give excellent trade setups. So, make sure you jump on those to recover money asap. If the market doesn't hold, reduce risk, if it does, increase risk. However, don't bet more than 1% per trade.

SAIL : Buy when no-one buysThis analysis comprises of both price action and smart money concept. A huge rally is waiting in SAIL, try to use it guys !!


Secret breakout pattern.Please do not trade based on my opinions they are not set in stone. I just have high RR but poor accuracy and I am completely open about it. This is just me keeping log of the trade I took and not a trade recommendation. The previous swing high only gives me 1:5 RR which is not my ideal RR as I gun for 1:10. Let's see what happens when it hits target, I might trail SL to BE and let it ride till it goes 1:10.
Trade logic:
Market often probes for liquidity clusters and then gives a sharp momentum bursts that lasts for 3-5 days. You don't always have to buy a breakout after the break of upper range, sometimes failing to break the lower is just as good an entry point. The tradeoffs here are low accuracy in return of high risk-reward ratio + small holding period.
Please do not trade on the back of this just learn how to mark the levels, how an ideal entry point can be found and increase the RR of your trading system.
Happy Trading!😉
Break of support and bounce backs are the best and I strongly recommend you learn from them.
Follow me if you want learn how to trade with a different outlook. I have back tested indicators, trading systems that only rely on logic rather than traditional technical analysis.

3 Good swing trades and Index Ideas for 2 Aug I daily make educational content videos on financial markets

Best Momentum Picks | Daily Market Analysis video I daily make educational content videos on Markets
The above video is based on price action analysis only
