Double bottom created in Dmart 1) On support dmart have formed double bottom pattern
2) falling wedge pattern makes more confirmation that buyers are taking control now
3) In negative market stock didn't breakdown
4) In short term stock may reach 4300 levels with strict sl R:R is good
Falling Wedge

ZENTECH Bullish Breakout: Falling Wedge Resolves Within Long-TerZENTECH is currently trading within a long-term triangle structure, indicating prolonged consolidation before a directional move.
On the intermediate timeframe, price has broken out of a falling wedge pattern, which is a classic bullish reversal setup.
The breakout is confirmed above the ₹1384 zone, which now acts as an important support.
If price sustains above this breakout level, the structure suggests a continuation towards higher levels.
📈 Minimum projected target: ₹1600
As always, watch for volume confirmation and price holding above the breakout zone for further strength.
#ElliottWave #ChartPatterns #FallingWedge #Triangle #BullishBreakout #TechnicalAnalysis

ABLBL: Falling Channel Study — Reversal Base + Swing Opportunity1️⃣ Primary Trend: Falling Channel (Bearish to Neutral)
Price has been moving inside a well-defined descending channel (lower highs & lower lows).
This indicates controlled selling, not panic — which is important for future reversals.
The stock is currently near the lower band of the channel, a typical area where:
Short covering starts
Value buyers enter
2️⃣ Support Zone & Reversal Signs
Strong demand zone: ₹114 – ₹118
Multiple rejections from this area
Long lower wicks indicate buying interest
This zone has acted as a base, increasing probability of a pullback move.
Breakout Levels to Watch (Very Important)
Immediate resistance: ₹133 – ₹134
Horizontal resistance + mid-channel zone
First sign of strength if crossed with volume
Major trend change confirmation: ₹150 – ₹152
Break & sustain above this = channel breakout
Can shift structure from downtrend → trend reversal
Swing Trading Perspective
Inside-channel swing opportunity:
Bounce from lower channel → mid / upper channel
Upside swing zones:
Target 1: ₹133–135
Target 2: ₹145
Target 3 (only if breakout): ₹150–155
🧠 What This Chart Is Saying (Simple Words)
Selling pressure is slowing down.
The stock is building a base near support.
A short swing bounce is likely first.
A trend reversal only happens above ₹150.
⚠️ Important Note
This analysis is for educational & learning purposes only.
Not a buy or sell recommendation.

Crompton Greaves Falling?Technical (upgrade)
Crompton Greaves Consumer Electricals has been sliding inside a falling wedge, but price is trying to base around ₹248-252 (teal support on your chart). A daily close above ~₹260–262 (wedge top/near-term trendline) would confirm a breakout and set up a move toward ₹275 first and ₹300 next If price fails and closes back below ₹248, treat it as a false start and expect the downtrend to resume keep risk tight in that zone.
Fundamentals (quick, clean)
Latest print showed mixed trends—Q2 FY26 consolidated revenue ~₹1,915.6 cr, PAT ~₹75.4 cr, with margin pressure; the quarter also carried an exceptional ₹20.36 cr charge for the Vadodara plant restructuring. Butterfly (kitchen appliances) grew double‑digits YoY and lighting rose ~3% YoY, partly offsetting weakness in electric consumer durables. The company fully repaid its ₹300 cr NCDs in Jul‑2025 and said it is net‑cash/zero‑debt, which is a positive for flexibility. Valuation and efficiency are mid‑pack for consumer durables (P/E ~34–35; P/B ~4.3–4.9; ROE ~13–15%; ROCE ~15–19%). Net‑net: fundamentals are stable but margins need rebuilding—if your chart gets the ₹260–₹262 breakout, technicals can align with a gradual recovery story.
Like, comment your thoughts, and share this post
Explore more stock ideas on the right hand side your feedback means a lot to me!
Disclaimer: This post is for educational purposes only and should not be considered a buy/sell recommendation.

Ingersoll Rand: When the Bullish Wedge Fails (Bearish Breakdown)The Setup Traders often look at Falling Wedges and blindly assume a bullish reversal is coming. Ingersoll Rand (NSE: INGERRAND) has just provided a textbook example of why "Assumption" is dangerous in trading.
Instead of breaking out to the upside, the price has sliced through the Lower Support Trendline on the Daily timeframe.
Technical Breakdown (The "Trap"):
Pattern Failure: The stock was forming a Falling Wedge (usually bullish). The market expected a bounce from the lower support.
The Invalidating Move: The recent heavy-volume candle breaking below the wedge support changes the structure entirely.
Psychology of the Short: Bulls who accumulated at the support line are now trapped. As their Stop Losses get hit, it creates a cascade of selling pressure (Long Liquidation).
Trade Management (Bearish):
Signal: The daily close below the wedge support (Current levels: ~3,438).
Conservative Entry: Wait for a "Retest" of the broken trendline from below (proving old support has become new resistance).
Trend Invalidation: A daily close back inside the wedge (above ~3,550). If it re-enters, the breakdown was a "Bear Trap."
Potential Target: Since this is a continuation of the downtrend, we look at the next major structural support zones (Psychological levels like 3,200 or 3,000).
Risological Note: We trade what we see, not what the textbook says should happen. A failed bullish pattern is often a stronger bearish signal than a standard downtrend.

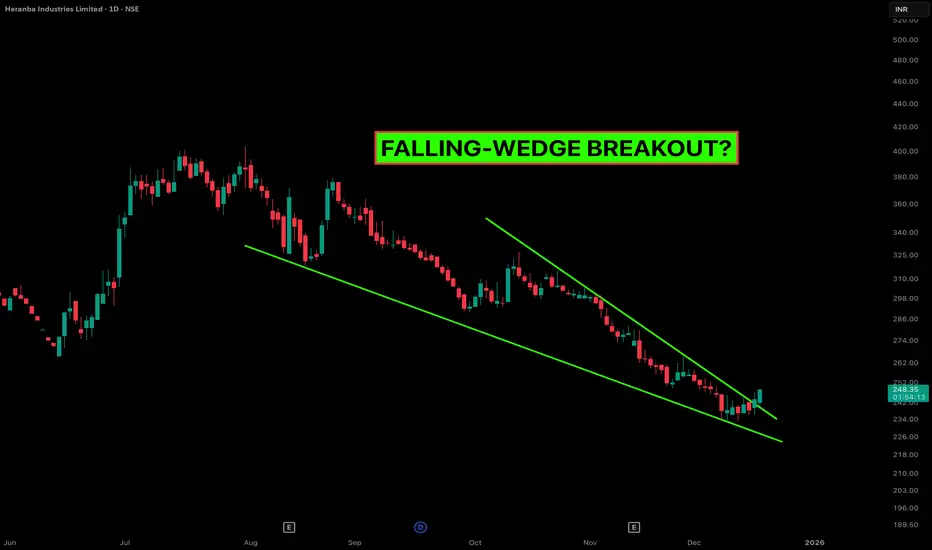
Heranba Industries: Why Falling Wedges Often Mark the BottomThe Setup Heranba Industries (NSE: HERANBA) has been in a corrective phase for months, but the structure has now matured into a classic Falling Wedge Pattern on the Daily timeframe.
For those new to this pattern: A Falling Wedge is a bullish reversal pattern. It is characterized by "Lower Highs" and "Lower Lows" contracting into a narrower range. This contraction signals that selling pressure is exhausting and buyers are stepping in at higher relative lows.
Technical Breakdown:
Price Action: The price has respected the upper trendline resistance multiple times. The recent breakout candle suggests a shift in momentum.
The Psychology: Notice how the selling waves are getting shorter? This "compression" usually precedes an expansion in volatility (the breakout).
Volume Profile: We are looking for a spike in volume to confirm the breakout validity. A low-volume breakout is often a trap, so watch the close.
Trade Management (Educational View):
Aggressive Entry: On the immediate break of the upper trendline (Current Levels: ~247-248).
Conservative Entry: Waiting for a "Retest" of the trendline around 240-242 to confirm support.
Stop Loss: Strictly below the recent swing low (invalidate the pattern if price falls back into the wedge).
Targets: The theoretical target of a wedge is often the top of the wedge structure (the origin of the pattern).
Risological Note: We track these compression patterns because they offer high Risk-to-Reward ratios. We are not predicting the future; we are reacting to probability.
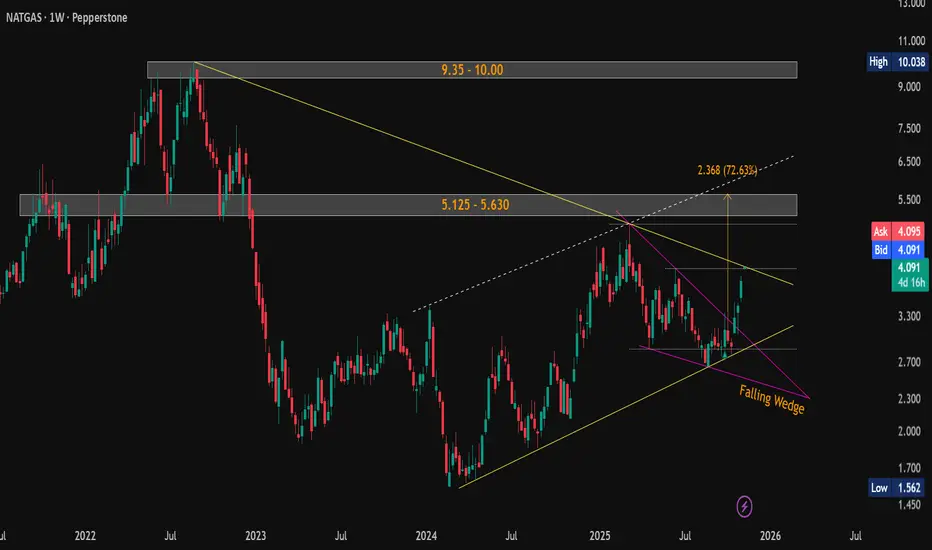
#NaturalGas ($NG) Weekly Update — Trading at Breakout ZoneCMP: $4.400
+54% from suggested levels and +58% from lows. 🚀
Price trading in the key resistance zone $4.339–4.417.
WCB > $4.417 = Symmetrical Triangle breakout → Falling Wedge target: $5.246 🎯
🛡 Supports: $4.067 / $3.803 / $3.625–$3.572
🚧 Major Resistances:
• ST: $5.125–$5.630
• LT: $9.35–$10.00
Tight structure… breakout looks close. 🔥
#NG VANTAGE:NG #NaturalGas #Commodities #PriceAction #SymmetricalTriangle #FallingWedge #ChartPatterns #Breakout
📌 #Disclaimer: This analysis is shared for educational purposes only. It is not a buy/sell recommendation. Please do your own research before making any trading decisions.
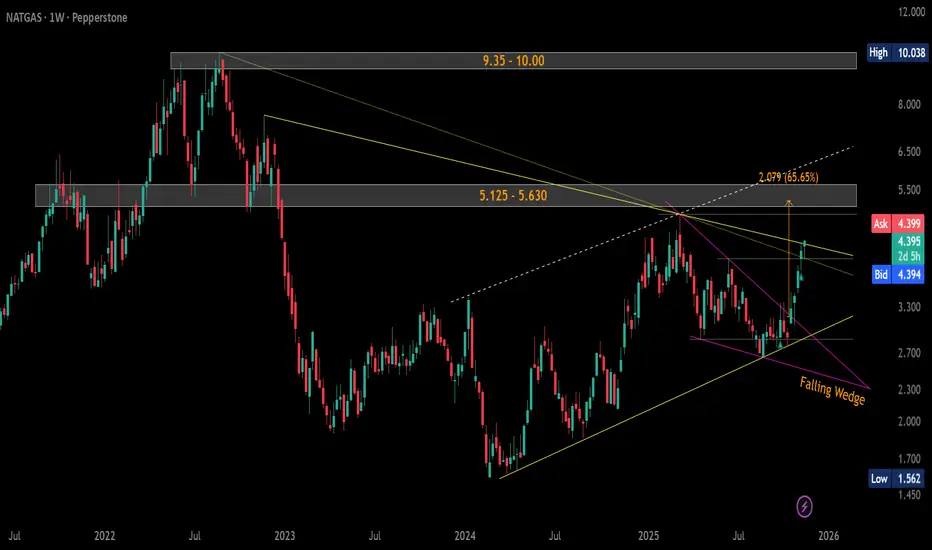
#NaturalGas ($NG) Weekly Update — Testing Critical Resistance!CMP: $4.092
💥 Up +38% from mentioned support ( $3.013–$2.956 ) and +46% from lows in a month . 🚀
The falling wedge breakout played out strongly, and price is now testing the critical resistance of the falling yellow trendline near the previous swing high $4.067 .
A weekly close above this trendline will confirm a major breakout , potentially triggering the next leg higher.
📊 Key Levels:
🛡 Supports: $4.067 / $3.013–$2.956 / $2.692–$2.643
🚧 Resistances / Targets: $5.125–$5.630 / $9.35–$10.00
Structure now forming a larger Symmetrical Triangle between rising and falling yellow trendlines — watch for breakout confirmation .
⚠️ Possible short-term pause/retest before continuation.
#NaturalGas #NG #Commodities #FallingWedge #RisingChannel #SymmetricalTriangle #ChartPattern #PriceAction
📌 #Disclaimer: This analysis is shared for educational purposes only. It is not a buy/sell recommendation. Please do your own research before making any trading decisions.
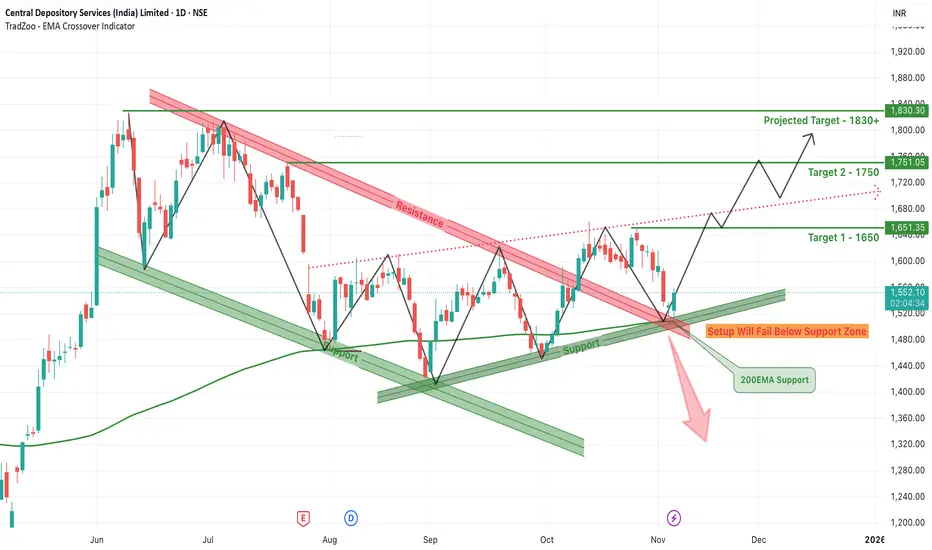
CDSL Breakout from Falling Wedge – Can It Rally to 1830+?CDSL has recently broken out from a classic falling wedge pattern, a bullish technical setup that often signals a trend reversal or continuation of the broader uptrend. After months of being compressed between a descending resistance and a well-established support line, the stock has now pierced through the upper resistance zone with notable bullish momentum.
The wedge had formed over several months, creating lower highs and relatively equal or slightly rising lows. The pattern was further supported by a confluence with the 200 EMA, which acted as a critical dynamic support near the breakout zone. This alignment of technical indicators added strength to the breakout confirmation seen recently.
With this breakout, CDSL has now opened doors for higher targets. The immediate Target 1 is set at ₹1650, which also aligns with a recent horizontal resistance zone. Once this is breached, the next move could extend toward Target 2 at ₹1750, a level where previous price action has shown hesitation. If momentum continues to build and the broader market supports the move, the final projected target of ₹1830+ becomes achievable in the short to medium term.
However, it’s crucial to note that the support zone below ₹1480 is acting as a critical invalidation point for this bullish setup. Any strong breakdown below this zone, especially with volume, would fail the bullish structure and may push the stock back into consolidation or a deeper correction. Traders must also watch the red dotted trendline, which represents a former resistance turned possible retest zone.
Overall, the technical landscape is now favoring the bulls, especially after the breakout confirmation and support from the 200 EMA. Traders and investors should monitor price action near the projected levels and manage risk accordingly, while riding the momentum above the wedge resistance.
BRITANNIA - Falling Wedge + Bullish Engulfing Combo💹 Britannia Industries Ltd (NSE: BRITANNIA)
Sector: FMCG | CMP: ₹5,892.50 | View: Falling Wedge + Bullish Engulfing Reversal Setup
📊 Price Action:
Britannia is currently displaying a strong confluence setup where both a chart pattern and a candlestick pattern align perfectly to signal a potential trend reversal.
After weeks of consolidation within a downward-sloping structure, the stock has formed a Falling Wedge pattern — a classic bullish reversal formation.
Adding strength to this structure, a Bullish Engulfing Candle on 4 Nov 2025 emerged from the wedge’s lower boundary, confirming buyer dominance and hinting at a near-term trend reversal.
📉 Chart Pattern Analysis – Falling Wedge (Bullish Setup):
The Falling Wedge pattern is marked by two converging downward trendlines, each connecting a series of lower highs and lower lows.
This structure reflects seller exhaustion and early buying interest.
Britannia’s wedge formation is now reaching its apex, where breakout probability is highest.
Volume contraction throughout the wedge also supports the notion that supply is drying up, preparing for a breakout above the upper trendline.
📈 Candlestick Pattern – Bullish Engulfing Confirmation:
The Bullish Engulfing Candle formed on 4 Nov 2025 precisely at the lower support line of the wedge, validating the pattern with strong timing. It represents a shift in control from sellers to buyers, with the green candle completely engulfing the prior red body. Volume expansion on that session further confirmed active participation by institutions ahead of the upcoming news catalysts. This one-day reversal candle acts as the first technical confirmation, while a breakout above the upper trendline will serve as the structural confirmation for the wedge pattern.
📏 Fibonacci Analysis:
From swing low ₹5,298 to swing high ₹5,930:
78.6% retracement @ ₹5,795 → Key reversal level defended.
61.8% retracement @ ₹5,888 → Currently reclaimed zone.
100% extension @ ₹5,930 → Short-term breakout threshold.
The Fibonacci structure aligns beautifully with the wedge’s geometry, implying that the reversal zone is complete and buyers are regaining momentum.
🧭 STWP Support & Resistance:
Resistances: ₹5,940 | ₹5,987 | ₹6,055
Supports: ₹5,825 | ₹5,775 | ₹5,710
The ₹5,775–₹5,825 range is acting as a high-confidence accumulation base, while ₹6,090–₹6,150 represents the key breakout trigger zone.
📊 STWP Volume & Technical Setup:
Volume on 4 Nov surged to 363.4K vs 248.7K average, confirming institutional interest at lower levels. VWAP recovery and improving RSI (47→52+) show that momentum is gradually returning.
MACD is approaching a bullish crossover, while Stochastic and CCI have both turned upward — all aligning with a reversal confirmation setup.
Trend Direction: UPTREND (Transitioning) | Volume Confirmation: Possible Accumulation in Progress
🧩 STWP Summary View:
Final Outlook:
Momentum: Strengthening | Pattern: Falling Wedge + Bullish Engulfing | Risk: Moderate | Volume: Increasing
Britannia’s technical structure now showcases dual confirmation — a chart pattern (Falling Wedge) supported by a candlestick reversal (Bullish Engulfing).
This confluence enhances the reliability of the reversal signal and increases the probability of an upside breakout. As long as the price holds above ₹5,825, the bias remains bullish with potential continuation toward ₹6,150–₹6,250.
⚠️ Disclosure & Disclaimer – Please Read Carefully
This analysis is for educational purposes only and should not be treated as financial or investment advice.
I am not a SEBI-registered investment adviser. All views are based on technical observations and publicly available information.
Trading involves risk; please assess your financial suitability, position size, and stop-loss levels before entering any trade.
Always consult a SEBI-registered financial adviser for personalized guidance.
Position Status: No active position in (BRITANNIA) at the time of this analysis.
Data Source: TradingView & NSE India
💬 Found this useful?
🔼 Give this post a Boost if you value clean technical confluence studies.
💭 Comment your thoughts — does this wedge-breakout setup look convincing to you?
🔁 Share this post to help others understand pattern + candlestick synergy.
👉 Follow for more institutional-style technical breakdowns built on clarity and patience.
🚀 Stay Calm. Stay Clean. Trade With Patience.
Trade Smart | Learn Zones | Be Self-Reliant 📊

#Silver | Falling Wedge + Inverse H&S = Bullish Cocktail#XAGUSD | 4H Chart
Head & Shoulders completed its breakdown target ✅
Price found support at the demand zone, formed a falling wedge breakout, and built an Inverse H&S.
Now consolidating right below the neckline, watching Immediate Resistance @48.464 👀
Above this, potential retest of key resistance zone 49.459 – 50.475/50.897 (previous H&S breakdown area).
Bias: Bullish above 48.464; confirmation on 4H close 🔥
#Silver #XAGUSD #HeadnShoulders #FallingWedge #InverseHeadnShoulders #PriceAction
📌 Disclaimer: This analysis is shared for educational purposes only. It is not a buy/sell recommendation. Please do your own research before making any trading decisions.

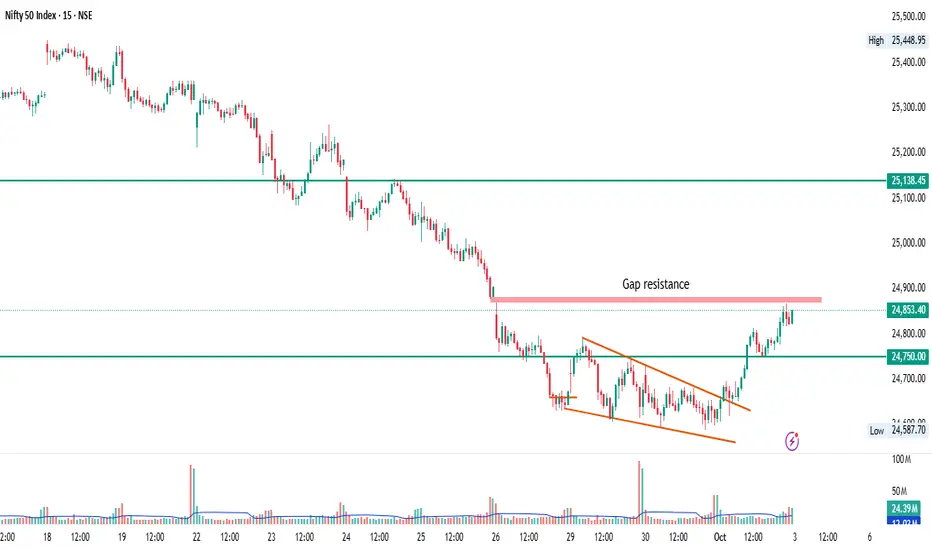
NIFTY 50 – Intraday level 15min TFNIFTY 50 – Gap Resistance Test After Falling Wedge Breakout
Timeframe: 15 min
📌 Key Observations:
Falling wedge pattern formed over the last few sessions, followed by a clean breakout with rising volume.
Price has now rallied toward the gap resistance zone near 24,880–24,900, where supply previously stepped in.
24,750 is acting as immediate support — the level from where the breakout initiated.
Next resistance to watch is 25,138, which aligns with a previous structure zone.
📈 Trading Plan:
✅ Bullish if:
Price sustains above the 24,880–24,900 gap resistance
Then potential upside towards 25,050 / 25,138
⚠️ Caution if:
Price gets rejected at the gap resistance
Watch for pullback retest around 24,750
🔍 Sentiment:
Short-term recovery is in play after a prolonged downtrend, but the current zone is a make-or-break resistance.
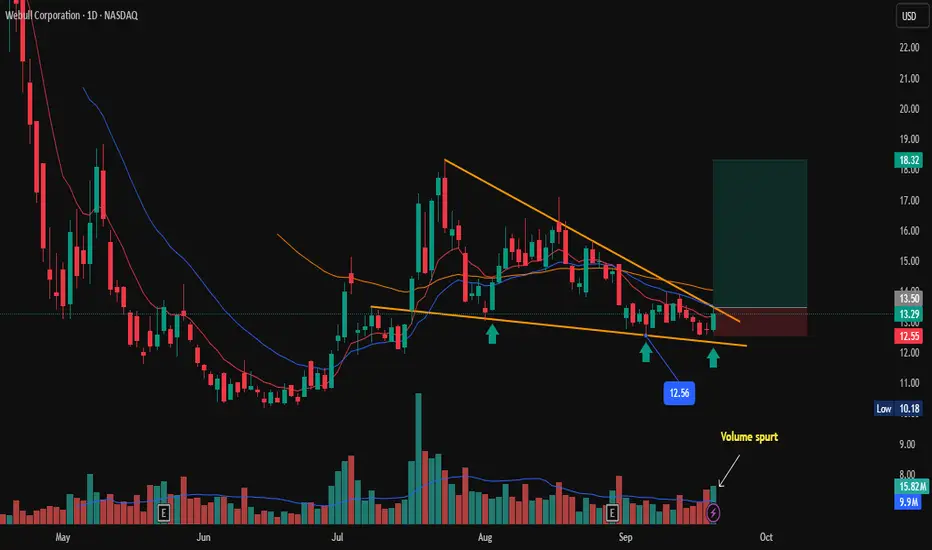
NASDAQ: Webbull Corporation - Long Setup, Reversal SignWebbull Corporation shows signs of a potential long opportunity after forming a Bullish reversal pattern (falling wedge) on the daily chart. Price respecting a trendline, and Volume spurt on last trading session. signaling Bullish momentum. hinting at a possible uptrend initiation.
Key Levels to Watch:
Immediate support at $12.56 (immediate low)
Trade Plan:
Enter long above $13.50 on confirmation of bullish candle close.
Stop loss above $12.60 to limit risk.
Target $18.00 as per falling wedge rule, or trail stop as price moves above.
Disclaimer : Risk management is crucial. so keep position sizing appropriate. This analysis is intended for educational purposes and not financial advice.
WTI Crude Oil – Dual Falling Wedges in Play!🛢️ #WTICrudeOil
CMP: $58.25
🟡 S maller Falling Wedge (Yellow)
• Breakdown candle formed
• Breakdown confirmation on weekly close below $58.22 (low of breakdown candle)
• Target: $52.71
• Converges with key price action support zone at $52.48–50.55
• Also aligns with long-term wedge trendline support
🟣 Larger Falling Wedge (Purple)
• Still intact
• Bullish Breakout confirmation: Weekly close above $77.57
🔽 Support Levels
• Immediate: $55.15
• Zones: $52.48–50.55, $45.04–42.93
🔼 Resistance Levels
• Immediate: $58.35
• Zones: $60.68, $61.45–61.96, $63.98–66.42
⚠️ Outlook
Short-term bias remains bearish , watching for a weekly close below $58.22 to confirm breakdown.
Long-term bullish reversal possible only above $77.57 (WCB) .
#CrudeOil | #WTI | #OilChart | #ChartPatterns | #FallingWedge | #PriceAction | #Commodities
📌 Disclaimer: This analysis is shared for educational purposes only. It is not a buy/sell recommendation. Please do your own research before making any trading decisions.

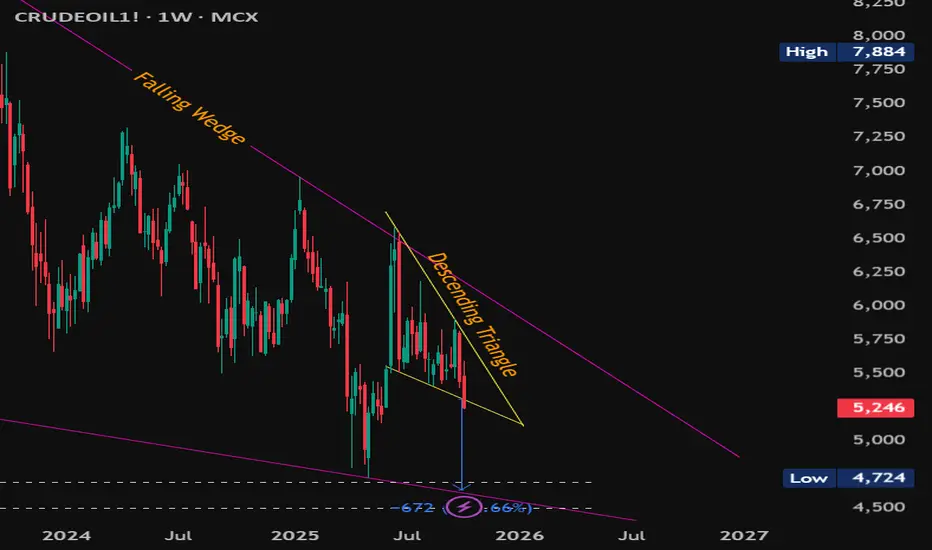
#MCXCrudeOil Weekly – Breakdown into Major Support Zone#MCXCrudeOil Weekly – Breakdown into Major Support Zone
CMP: 5,246
Crude Oil has broken down from a descending triangle with a confirmed weekly close below 5,308 , triggering target of 4,636 . This move unfolds within a larger falling wedge pattern , adding confluence and signaling potential volatility ahead.
This breakdown aligns with two key confluences :
📉 The falling wedge lower trendline.
🟠 A major historical demand zone at 4,692 – 4,499 , which was previous resistance turned strong support on multiple occasions.
This make-or-break support zone could act as:
🔄 A reversal zone , potentially triggering a bullish breakout from the wedge.
📉 Or, if breached, it may invalidate the wedge and lead to extended downside.
Key Levels:
Resistance: 5,903 & 6,184 (price action + wedge top)
Support: 4,692 – 4,499 (confluence zone)
Breakdown Target: 4,636 (descending triangle pattern)
Watch weekly candle behavior near this zone closely for signs of either rejection or continuation .
#CrudeOil #MCXCrude #ChartPatterns #FallingWedge #DescendingTriangle #PriceAction #BreakdownAlert #SwingTrading #CommodityTrading
📌 Disclaimer: This analysis is shared for educational purposes only. It is not a buy/sell recommendation. Please do your own research before making any trading decisions.
Bajaj Health care falling wedge pattern.Price Action: A "weapon candle breakout" is evident, with the price testing 497.60 INR, supported by a "huge volume" spike, indicating strong bullish momentum.
Pattern: A falling wedge pattern is noted, typically bullish, with the breakout suggesting a potential upward trend.
Targets and Support:
As per chart any dip up to 458 is buying opportunity for Price targets are set at 646 INR (TG1) and 784 INR (TG2).
Indicators:
RSI (14, close) at 67.72 nears overbought levels.
MACD shows a bullish crossover.
ADX is in momentum (above 25) with +DI above -DI, confirming trend strength.
Like and support.

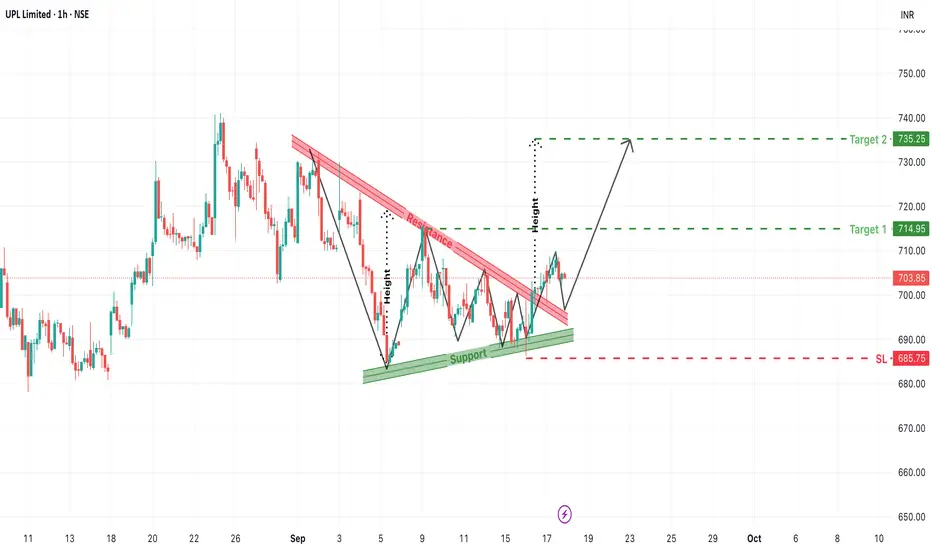
UPL Breakout from Falling Wedge: Bullish Continuation Ahead?The chart for UPL Limited (1-Hour, NSE) presents a promising bullish breakout scenario, emerging from a well-defined falling wedge (descending channel). Traders and investors watching for breakout opportunities will want to monitor this move closely as the price breaks above resistance with potential to test higher levels.
1. Chart Pattern Formation: Falling Wedge with Bullish Implication
Over the past several trading sessions, UPL consolidated inside a downward sloping wedge pattern characterized by:
- Lower highs and lower lows, creating a narrowing channel.
- The support trendline consistently held the price near 685–690 levels.
- The resistance zone, marked with a red trendline, was tested multiple times before finally breaking out.
- This kind of pattern often precedes a trend reversal or continuation to the upside, especially when it forms after a prior bullish move.
2. Breakout Confirmation: Clean Move Above Resistance
- Price has broken out of the descending resistance, closing above ₹703+.
- This breakout came with a retest of the support and is now showing signs of resuming upward momentum.
- The price structure now signals the end of the downtrend inside the wedge and potential bullish continuation.
3. Target Projections Using Pattern Height
The measured height of the wedge pattern provides us with two price targets:
- Target 1: ₹714.95
The first logical resistance and Fibonacci extension zone.
- Target 2: ₹735.25
Based on full height projection of the wedge breakout.
These targets are calculated from the breakout level and are aligned with historical price action levels.
4. Stop Loss and Risk Management
- Suggested Stop Loss (SL): ₹685.75
Just below the support zone and wedge structure to avoid false breakouts.
- Entry Zone:
Around current levels of ₹703–704 or on dips near ₹700–701 if retest occurs.
- Risk-Reward Ratio:
Around 1:2.5 for T2, offering good upside with controlled risk.
5. Key Technical Takeaways
- Pattern: Falling Wedge (Bullish Reversal/Continuation)
- Breakout Zone: ₹703+
- Support Zone: ₹685–688
- Momentum Bias: Bullish (as long as price holds above support)
- Risk Zone: Below ₹685
- Reward Zone: ₹715 to ₹735
Conclusion: UPL Gearing Up for a Short-Term Rally
UPL has triggered a classic technical breakout from a falling wedge, backed by a retest and bounce from support. As long as price sustains above ₹685, bulls may drive the stock toward the upper targets of ₹715 and ₹735. The chart offers a low-risk, high-reward setup ideal for short-term swing traders.
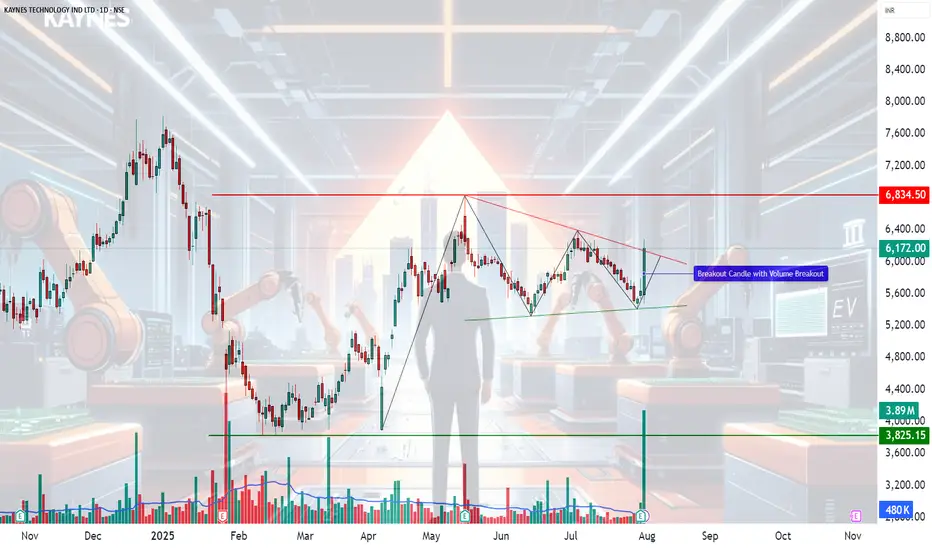
KAYNES TECHNOLOGY IND LTD – Technical Analysis________________________________________
🧠 KAYNES TECHNOLOGY IND LTD – Technical Analysis
Ticker: NSE:KAYNES | Sector: EMS & Semiconductors
Current Price: 6,172.00 ▲ (+9.5% on July 31, 2025)
Technical View: ⭐⭐⭐⭐ | Chart Pattern: Falling Wedge Breakout
________________________________________
📈 Technical Overview
🔹 Chart Pattern Formed: Falling Wedge Breakout with extremely high volume confirmation
🔹 Breakout Zone: 6,000–6,050
🔹 Momentum Signals:
— RSI breakout above 60
— Strong bullish candle with rising volume
— VWAP and SuperTrend aligned bullish
🔹 Support Trendline Held on multiple touchpoints
🔹 Breakout Candle marked by heavy institutional volume
________________________________________
📰 Key Fundamental Developments
✅ Q1 FY26 PAT up ~50% YoY to 74.6 Cr
✅ Gross margin expanded to 41%, EBITDA margin to 16.8%
✅ Strategic acquisitions from Fujitsu (85 Cr domestic + 118 Cr JV with L&T)
✅ Strong order book visibility (~7,400 Cr)
✅ Raised 1,600 Cr via QIP to fund growth
________________________________________
📊 Sentiment Analysis
Sentiment: ✅ Positive
— Strong earnings beat and margin expansion
— Global expansion through Fujitsu JV
— Bullish commentary from major brokerages
— Institutional confidence via QIP and upgrades
________________________________________
🔼 Resistance Levels
6,400 – Immediate breakout target
6,834 – Top of consolidation range
7,285 – Medium-term resistance (historic supply zone)
🔽 Support Levels
5,970 – Breakout retest zone
5,700 – Structure base
5,170 / 4,864 – Deep support for longer-term invalidation
________________________________________
📌 What’s Catching Our Eye
🔹 Volume spike confirms genuine breakout
🔹 RSI, SuperTrend, VWAP – all flashing bullish
🔹 Back-to-back bullish closes after a 10 day contraction breakout
🔹 Volume & price action aligned across multiple timeframes
________________________________________
👀 What We’re Watching For
🔸 Follow-through momentum toward 6,400+
🔸 Whether breakout holds above 5,970 in coming sessions
🔸 Semiconductor line execution progress
🔸 Margin trends in upcoming quarters
________________________________________
⚠️ Risks to Monitor
⚠️ Rich valuations (~130x P/E) – limited room for disappointment
⚠️ Execution risk on new lines and acquisitions
⚠️ Global slowdown in electronics & macro headwinds
⚠️ Any delay in semiconductor segment scale-up
________________________________________
🔮 What to Expect Next
🔹 Retest of breakout zone (~6,000–6,050) possible
🔹 If held, expect momentum toward 6,400–6,800
🔹 Sideways consolidation likely if volumes taper
🔹 Strong close above 6,400 could initiate fresh uptrend leg
________________________________________
📈 Strategy Insight (For Educational Purposes Only)
— Aggressive Traders: Watch level of 6284
— Momentum Traders: Watch 6,050 retest for low-risk entry
— Risk Management: Position sizing + Capital risk – as per individual preference
________________________________________
💬 Why It’s On Our Watchlist
Kaynes blends EMS scale with high-margin ODM design and semiconductor upside. Rare in India’s listed space. Strong revenue visibility, global expansions, and balance sheet strength make it a high-conviction long-term story.
________________________________________
📉 If Price Comes Down…
5,700–5,800 is a critical support zone. Breakdown below this with volume = trend weakness. 5,400 is final demand zone before structural damage.
________________________________________
🪙 Educational Insight for Learners
This chart is a real-world example of a falling wedge breakout confirmed by volume. The key takeaway: price alone is not enough—watch volume, RSI, and structure. Never chase momentum without a plan. Always pair conviction with discipline.
________________________________________
🚨 Reminder: No stock is a “sure thing.” Use proper risk management. Stay rational when others get emotional.
________________________________________
⚠️ Disclaimer (Please Read Carefully):
This content is shared strictly for educational and research purposes only.
I am not a SEBI-registered investment advisor, and no buy or sell recommendations are being made.
All views expressed are based on personal market analysis and experience. They are not intended as financial advice.
Trading — especially in derivatives like options — involves significant financial risk. Losses can exceed your initial investment.
👉 Always do your own research and consult a certified SEBI-registered advisor before making any investment or trading decisions.
👉 Use proper risk management and only trade with capital you can afford to lose.
The author assumes no responsibility or liability for any trading losses incurred from acting on this content.
By engaging with this material, you agree to these terms.
________________________________________
💬 Found this helpful?
Drop your thoughts, questions, or insights in the comments below ⬇️ — let’s learn together!
🔁 Share this post with your trading friends and community — help them discover clean charts, structured setups, and zone-based learning.
✅ Follow simpletradewithpatience for clear setups, educational content, and a no-nonsense approach to price action, supply-demand zones, and risk-managed trades.
🚀 Trade with patience. Trust your charts. Stay clear-headed.
Because the goal is not just to trade — it's to trade better.
Be Self-Reliant | Trade with Patience | Learn with Charts & Zones 📊
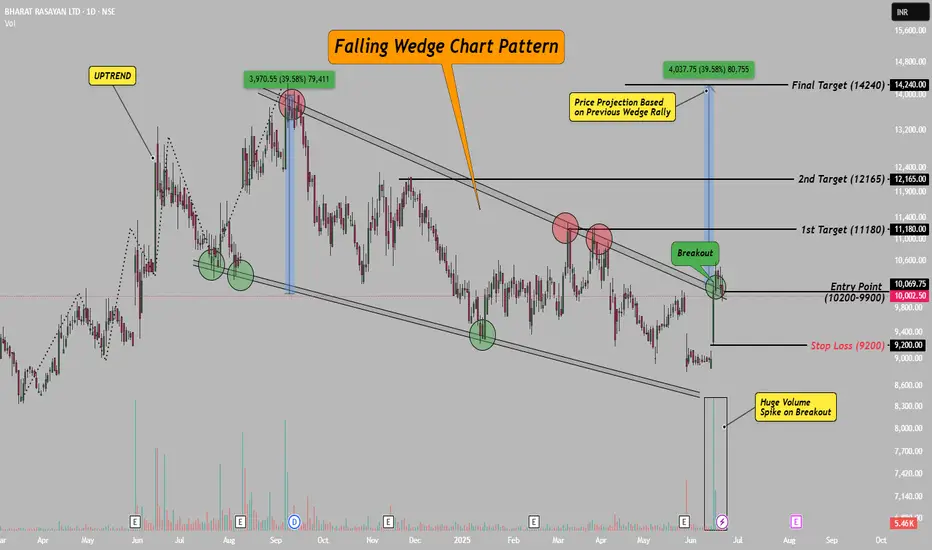
Bharat Rasayan–Falling Wedge Breakout with 39% Upside Potential!Hello Everyone, i hope you all will be doing good in your life and your trading as well! Today i have brought a post which is on Bharat Rasayan – a classic case of a falling wedge breakout.
After staying in a falling wedge pattern for nearly 10 months, the stock has finally broken out with a strong bullish candle and a clear volume spike. This breakout zone (9900–10200) also aligns with the downtrend line, making it even more valid.
The best part? This has participated in rally yet, means there is a lot remain in this stock, please check chart above for entry, stop loss and targets.
This setup is based on price action, chart structure, and previous pattern behavior. If you’re a swing or positional trader, this one’s worth watching!
If you liked this idea, don’t forget to LIKE & FOLLOW for more clean, technical setups.
Disclaimer: This idea is for educational purposes only. Do your own research before taking any trade.
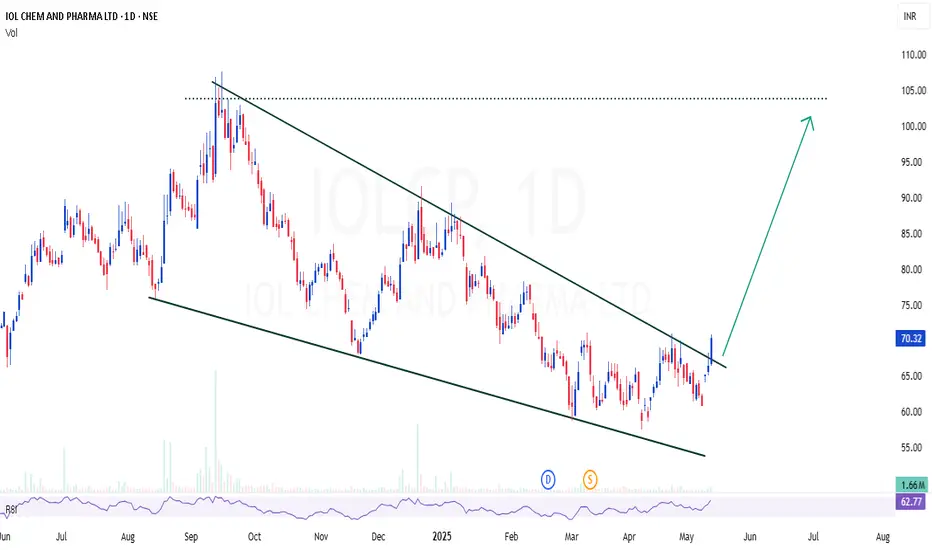
IOLCP | Perfect channel / wedge breakout - Looks good for 50%IOLCP | Perfect channel / wedge breakout - Looks good for 50%
CMP : 70
SL : 60
Target : 100
Tata Teleservices (Maharashtra) Big breakout alert!Big Breakout Alert!
Price has convincingly broken out of a long-term descending trendline with high volume interest visible on the volume profile — signaling a potential change in trend.
🔹 CMP: ₹65.88 (▲ +13.14%)
🔹 Resistance levels: ₹79.00 → ₹104.00
🔹 Support zone: ₹54.10 (Volume Node & Horizontal Structure)
🔍 Technical Insights:
Volume Profile Analysis
🔸 High volume node between ₹54–₹66 suggests strong accumulation.
🔸 Sharp price rejection below ₹54 confirms it as a demand zone.
Descending Trendline Break
🔸 Price finally broke out after multiple rejections since August 2023.
🔸 Breakout has occurred with aggressive bullish momentum.
Roadmap Projection (Blue Path)
1. Possible retest near ₹62–₹64
2. Push toward ₹79 zone
3. Consolidation before breakout toward ₹92–₹104 (previous POC & supply zone)
🧠 Takeaway:
This breakout, backed by volume and structure, hints at a trend reversal. If price holds above ₹62–₹64 on a retest, the stock could enter a new bullish phase targeting ₹100+.
“The longer the base, the stronger the breakout.”
#TataTeleservices #TTML #BreakoutStock #VolumeProfile #TrendlineBreak #SwingTrading #ChartAnalysis #StockMarketIndia #PriceAction #TechnicalAnalysis

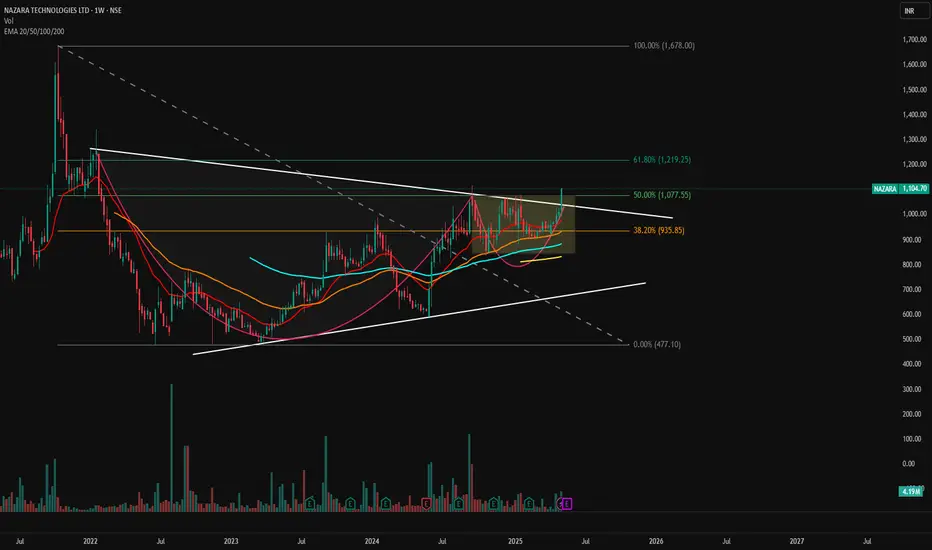
NAZARA - Breakout from Long-Term Falling Wedge📊 NAZARA – Breakout from Long-Term Falling Wedge | Strong Weekly Momentum
🕰️ Timeframe: Weekly | 💥 Pattern: Falling Wedge Breakout | 🔥 Sentiment: Bullish
📈 Chart Overview:
Nazara Technologies has broken out of a multi-year falling wedge on the weekly chart, with a strong green candle above key EMAs and Fibonacci confluence zones. Price closed the week above ₹1,100, indicating a shift in long-term momentum and a potential start of a fresh uptrend.
🔍 Technical Highlights:
📉 Falling Wedge Pattern: Multi-year consolidation now broken on strong volume
💥 Breakout Candle: Price closed above trendline resistance and key Fibonacci 50% level
🧠 Volume Surge: Volume confirmation signals institutional interest
📊 EMA Confluence: Price trading above 20/50/100/200 EMAs – bullish alignment
🧱 Support & Resistance Levels:
Level Type Price (₹)
🔼 Resistance 1 1,219.25 (Fib 61.8%)
🔼 Resistance 2 1,678.00 (Previous ATH / Fib 100%)
🔻 Support 1 1,077.55 (Fib 50% – breakout zone)
🔻 Support 2 935.85 (Fib 38.2% + EMA cluster)
🔻 Support 3 820–860 (multi-touch horizontal support & EMA 200)
🔧 Indicators Used:
Fibonacci Retracement – Plotted from swing low ₹477.10 to high ₹1,678.00
EMA 20/50/100/200 – Price is now above all EMAs, showing trend shift
Volume Bars – Confirming strong breakout
Chart Pattern – Falling wedge (typically bullish)
📌 Chart Sentiment & Setup:
✅ Bias: Strongly Bullish
📍 Breakout Level: ₹1,077
🎯 Upside Targets: ₹1,219 → ₹1,320 → ₹1,678
❌ Invalidation: Sustained close below ₹935 with volume
📢 Summary:
Nazara is showing signs of a structural breakout after prolonged downtrend and consolidation. The falling wedge breakout, confirmed by volume and EMA crossover, sets up a long-term bullish outlook. A retest of the ₹1,075–₹1,100 zone could offer a high-probability entry.
🧠 Pro Tip: Wait for a weekly candle close and minor pullback to the breakout level before entry.
⚠️ Disclaimer: This is a technical analysis post meant for educational purposes only. Please do your own research or consult a financial advisor before investing.
🔔 Follow @PriceAction_Pulse for more actionable swing setups, breakout alerts, and chart breakdowns!
Real Success Rates of the Falling Wedge in TradingReal Success Rates of the Falling Wedge in Trading
The falling wedge is a chart pattern highly valued by traders for its potential for bullish reversals after a bearish or consolidation phase. Its effectiveness has been extensively studied and documented by various technical analysts and leading authors.
Key Statistics
Bullish Exit: In 82% of cases, the exit from the falling wedge is upward, making it one of the most reliable patterns for anticipating a positive reversal.
Price Target Achieved: The pattern's theoretical target (calculated by plotting the height of the wedge at the breakout point) is achieved in approximately 63% to 88% of cases, depending on the source, demonstrating a high success rate for profit-taking.
Trend Reversal: In 55% to 68% of cases, the falling wedge acts as a reversal pattern, signaling the end of a downtrend and the beginning of a new bullish phase.
Pullback: After the breakout, a pullback (return to the resistance line) occurs in approximately 53% to 56% of cases, which can provide a second entry opportunity but tends to reduce the pattern's overall performance.
False Breakouts: False exits represent between 10% and 27% of cases. However, a false bullish breakout only results in a true bearish breakout in 3% of cases, making the bullish signal particularly robust.
Performance and Context
Bull Market: The pattern performs particularly well when it appears during a corrective phase of an uptrend, with a profit target reached in 70% of cases within three months.
Gain Potential: The maximum gain potential can reach 32% in half of cases during a bullish breakout, according to statistical studies on equity markets.
Formation Time: The wider the wedge and the steeper the trend lines, the faster and more violent the post-breakout upward movement will be.
Comparative Summary of Success Rates:
Criteria Rate ..........................................Observed Frequency
Bullish Exit ........................................................82%
Price Target Achieved ........................................63% to 88%
Reversal Pattern ..............................................55% to 68%
Pullback After Breakout .....................................53% to 56%
False Breakouts (False Exits) ...............................10% to 27%
Bullish False Breakouts Leading to a Downside ..............3%
Points of Attention
The falling wedge is a rare and difficult pattern to correctly identify, requiring at least five contact points to be valid.
Performance is best when the breakout occurs around 60% of the pattern's length and when volume increases at the time of the breakout.
Pullbacks, although frequent, tend to weaken the initial bullish momentum.
Conclusion
The falling wedge has a remarkable success rate, with more than 8 out of 10 cases resulting in a bullish exit and a price target being reached in the majority of cases. However, it remains essential to validate the pattern with other technical signals (volume, momentum) and to remain vigilant against false breakouts, even if their rate is relatively low. When mastered, this pattern proves to be a valuable tool for traders looking for optimized entry points on bullish reversals.