Sky Gold’s Breakout: Falling Wedge Pattern Points to Big Upside!Hello everyone, i hope you all will be doing good in your life and your trading as well. Today i have brought a stock name with Sky Gold & Diamonds and it is showing a promising Falling Wedge pattern, and with the breakout above the upper boundary, it’s signaling a potential bullish move ahead. The breakout is supported by a volume surge, which suggests smart money may be entering, reflecting strong market interest. This could be the start of a solid rally.
On the fundamental side, Sky Gold has been performing well, with a 51% YoY revenue growth and a 117% jump in net profit for FY2024. The company maintains a solid ROE of 24%, with a manageable debt-to-equity ratio of 1.25, showing strong financial health and good prospects moving forward.
For this trade, 351-340 is a good entry range, with a 296 stop loss. I’m targeting 426 , 483 , and the final target of 553 . This setup offers strong upside potential, but as always, make sure to manage your risk and keep an eye on the price action. Let’s see how this one plays out!
Disclaimer: This analysis is for educational purposes only. Please consult a financial advisor before making investment decisions.
If you Found this helpful? Don’t forget to like, share, and drop your thoughts in the comments below.
Falling Wedge

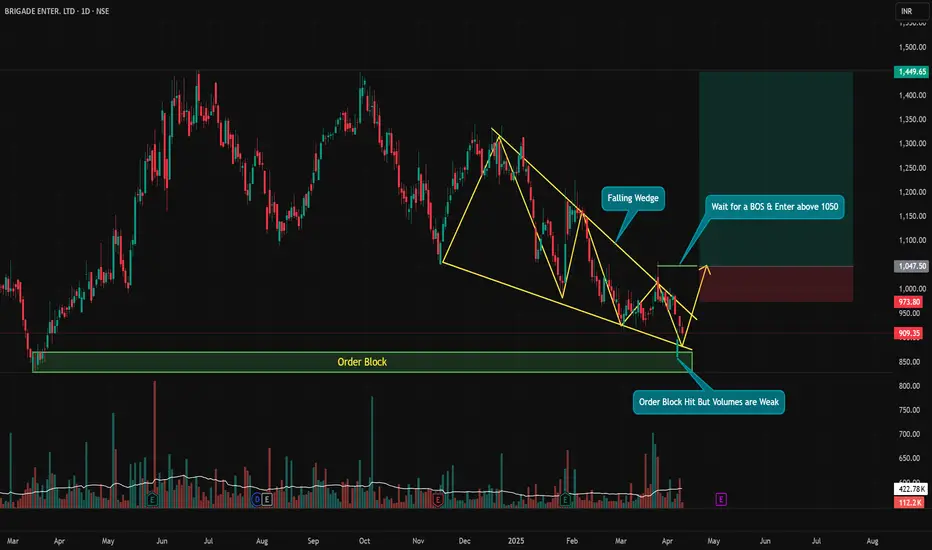
BRIGADE – Falling Wedge at Demand Zone, Waiting for BOSSetup Type: Reversal + Breakout Play | Conviction: Medium-High (Needs Confirmation)
Chart Framework: Smart Money + Classic TA
BRIGADE is showing signs of a potential trend reversal, but we’re not jumping in yet. Here's what the chart tells us:
🟡 Falling Wedge Formation – A bullish reversal pattern that typically resolves to the upside.
🟢 Tapped into a Strong Order Block – Smart money territory where previous accumulation took place.
🧲 Liquidity Grab Below Prior Lows, but... Volume on Bounce is Weak – Sign of caution.
📢 Analyst Rating: STRONG BUY – Adds institutional bias to the bullish setup.
🔐 No Confirmed Break of Structure Yet – Enter only after a clean breakout above ₹1050.
📈 Trade Plan:
Wait for a strong BOS (Break of Structure) and price closing above ₹1050 with volume.
Target zone near ₹1440+ aligns with measured move of wedge and previous supply.
⚠️ This is a setup with potential, but it’s not “ready” yet. Don't front-run smart money — let price confirm before jumping in. Risk management is a must.
A Falling Wedge Pattern is Witnessed.Not a Good time To Buy as the major market is falling but a Falling Wedge Pattern is Witnessed, keep at watch might become a good choice to buy in the future.
The Falling Wedge Pattern: A Guide to Catching Bullish BreakoutsFalling Wedge Pattern: A Continuation Chart Pattern
Hello Traders!
In today's post, we’ll explore the Falling Wedge Pattern , one of the most reliable continuation patterns that traders look for during uptrends. It’s an important tool for identifying potential breakout points in trending markets. If you want to learn how to trade these breakouts effectively, mastering the Falling Wedge is essential.
The Falling Wedge pattern typically forms during an uptrend and consists of converging trendlines, where the price makes lower highs and lower lows. However, despite the price being pushed lower, the momentum starts weakening, and eventually, the price breaks above the upper trendline, signaling a continuation of the prevailing uptrend .
What is the Falling Wedge Pattern?
The Falling Wedge Pattern is characterized by two converging trendlines, where the upper trendline slopes downward more steeply than the lower trendline. This pattern shows a decreasing range between highs and lows, and when the price breaks above the upper trendline, it indicates a continuation of the uptrend .
Key Characteristics of the Falling Wedge Pattern
Uptrend Prior to the Pattern: The Falling Wedge pattern forms during a strong uptrend , signaling that the market is taking a brief pause before resuming the previous momentum.
Converging Trendlines: The pattern consists of two downward-sloping trendlines that converge, with the upper trendline steeper than the lower one. This shows that the selling pressure is weakening.
Breakout Confirmation: A bullish breakout occurs when the price breaks above the upper trendline, signaling the continuation of the uptrend .
Volume Increase on Breakout: The breakout is confirmed when there is an increase in volume, indicating strong momentum behind the move.
How to Trade the Falling Wedge Pattern?
Entry Point: The ideal entry point is when the price breaks above the upper trendline, confirming the bullish breakout .
Stop Loss: Place your stop loss just below the lower trendline or the most recent swing low to protect your trade from sudden market reversals.
Profit Target: Measure the height of the wedge and project that distance upward from the breakout point to determine the price target .
Risk Management Considerations
Position Sizing: Adjust your position size based on your risk tolerance and the distance between the entry point and the stop loss.
Stop Loss Placement: Make sure to place your stop loss in a way that minimizes risk but still gives enough room for the trade to move in your favor.
Wait for Confirmation: Always wait for the breakout confirmation, and make sure that the price action is supported by an increase in volume.
What This Means for Traders
The Falling Wedge pattern is an excellent tool for traders who are looking for reliable continuation trades in strong uptrends. It can help identify breakout points and offer favorable risk-to-reward setups when combined with other technical indicators.
Look for the Falling Wedge pattern during uptrends to identify high-probability continuation trades.
Confirm with volume to ensure the breakout is backed by strong momentum.
Use stop loss placement to manage risk effectively while targeting favorable risk-to-reward ratios.
Conclusion
The Falling Wedge pattern is a reliable continuation pattern that can help traders identify breakout opportunities in trending markets. By mastering its formation, waiting for the breakout confirmation, and managing risk effectively, you can increase the chances of a successful trade in the uptrend .
Have you traded the Falling Wedge pattern before?
Share your experiences and thoughts in the comments below! Let’s continue learning and growing as traders!

Nifty 50 Ready for 24200?📊 Nifty 50 Daily Analysis
🔸 Current Resistance:
Nifty is facing resistance at the 50 DMA and the top of the wedge pattern.
🔸 Market Structure:
The structure remains Lower Highs (LH) and Lower Lows (LL), keeping the bearish trend intact.
🔸 Key Support Levels:
Pivot 1: 23,534 (must hold for bullish momentum).
Recent Swing Low: 22,783 (breaking this could push Nifty down to 21,800).
🔸 Upside Potential:
If Nifty consolidates tightly above Pivot 1 with small candles, a breakout could happen with target 24,200. However, expect challenges with multiple resistances ahead.
⚠️ Challenges to the Uptrend:
Average corporate earnings may limit optimism.
Global factors like yields and economic data could act as headwinds.
Nifty is below 50 and 200 DMAs, signaling weak sentiment.
📅 Key Upcoming Events:
RBI Policy Meeting: Interest rate decisions 🏦
US Non-Farm Payroll Data: Impacting global flows 📈
Quarterly Earnings: Heavyweights’ performance 🏢
Budget Announcements: Fiscal policy insights 🗂️
Global Factors: Fed updates and crude oil trends 🌎
MSCI Index Rebalancing
Summary:
✔️ Bullish View: A breakout above Pivot 1 may lead to 24,200.
❌ Bearish View: Breaking 22,783 increases the chances of a drop to 21,800.
👉 Nifty's upward journey won’t be smooth, so trade cautiously.

Nifty 50 | Falling Wedge Pattern – A Bullish Breakout Ahead?Hello everyone! I hope you all are doing great in life and in your trading journey. Today, I have brought an in-depth analysis of Nifty 50 , focusing on a powerful Falling Wedge Pattern that is currently forming on the charts. This pattern is known for signaling a bullish reversal , provided we get a confirmed breakout . If this pattern plays out as expected, we could witness a strong upward move in the coming sessions.
Currently, Nifty is trading near a strong support zone around 22,777 – 22,900 , where buyers have previously shown interest. The price is moving within a converging downward-sloping range , indicating that selling pressure is weakening . Key resistance levels to watch post-breakout include 23,700, 24,207, 24,781, 25,191, and 26,277 , with a stop-loss placed below 22,777 to manage risk effectively . However, this analysis holds true only if Nifty breaks out of the Falling Wedge Pattern; until then, caution is advised.
If the breakout is confirmed with good volume, we might see a strong rally ahead, potentially targeting the marked resistance levels. As always, patience and discipline are key—wait for confirmation before making any trading decisions.
Disclaimer:- This analysis is for educational purposes only. Please trade responsibly and consult a financial advisor before making any decisions.
If you found this analysis helpful, don’t forget to like, follow, and share your thoughts in the comments below! Your support keeps me motivated to share more insights. Let’s grow and learn together—happy trading!

SAPANDANA SPHOORTY READY FOR ALL TIME HIGH ?NSE:SPANDANA (Spandana Sphoorty Fin Ltd.)
This can be considered as my New Year Pick !!
Yesterday, Longs were given around 375
Mentioning that Any dip till 300 to be bought !
For Targets🎯400 / 425 / 444 / 462 / 488 / 505 / 520++
POSITIONAL TARGET🎯 555 / 578 / 606++
Keeping WCBSL as 284
Chart which was made yesterday ie. 07/01/2025
Today, It made a high of 480++
375------>480++
T4 Done🎯🎯
More Than 25% Returns in single session !!💕😍
Updated Chart as of now ie. 08/01/2025
This move was captured.....
=============================================================
Technical Setup:
1) More than 60% down from recent highs of 1200 levels
2) Falling wedge pattern on chart
3) Breakout of Falling Wedge can be seen...
4) Available at cheap valuations
5) Indication of Bottoming Out with High Volumes !!!
=============================================================
Regards,
Harm⭕nics4Life
08/01/2025
=============================================================
Disclaimer & Risk Warning
I am not sebi registered analyst.
My studies shared here are for educational purposes .. Do Consult Your Financial advisor Before Taking any Trade.....Good Luck!

RAMAPHO - Breakout TradeView : Bullish
Entry Zone- 240- 200 (Trend line breakout falling wedge)
Exit Zone - Based on Trader mindset. Exit 1 - 270
Exit 2- 307
Exit 3 - 350
Stoploss : Close below 190
Trading Edge: Price action and CPR
Timeframe: Daily and Weekly
Notes: Trendline breakout of falling wedge pattern. Price consolidates since Feb 2023.

BAJAJHCARE - Breakout Wedge PatternView : Bullish
Entry Zone- 435- 420 (Trend line break inside Broadening wedge)
Exit Zone - 500 - 510 Range or while price touch upper resistance line (marked in red)
Stoploss : Close below 380
Risk/Reward Ratio: 1:1.50
Timeframe: Daily and Weekly
Notes: Trendline break inside the broadening wedge pattern. Price consolidates since Nov 2021.
* This is not a trading recommendation, for educational purposes only

Falling Wedge Pattern Breakout.After the formation of Falling Wedge Pattern we saw a good Breakout, now it is a good time to Take a Long Entry on a Pull-back. Entry price is 430-433, Target 480-500-530+.

ITI - Stock to be in RADARPrice consolidate with in Falling wedge since October 2023 and for the past two days it have huge volume. We can enter when the price breakout and close above resistance in Weekly Timeframe.

BankNifty - Did You Miss The Explosive Move from 51000 ? Disclaimer:
This is for informational purposes only and is not a solicitation or offer to buy or sell any securities or products. Consult Your Financial Advisor
As per last idea we proposed that holding 51000 & above BankNifty Index can push upside towards 52050 & Above 52100 - can look for 52900-53100
Happy We achieved 78% of the target & got the maximum points of 1500 points in the Index
Last Idea
What Next ?
Index again forming a similar looking pattern from the highs of 52577 -recent highs & safe traders can look for short term downside moves falling below 52100 towards 51855 - Yesterday's low & 51250 / 51000 respectively.
Regards,
WaveTalks
Abhishek

EXIDEIND trendline breakoutExideind trendline breakout from falling wedge
positive crossover in MACD
Above 500 upside potential is 530+ in medium term
Disclaimer : I am not SEBI registered.

DOGS/USDT: BUY ZONE ACTIVATED! 60-70% PROFIT POTENTIAL!!Hey everyone!
If you're enjoying this analysis, a thumbs up and follow would be greatly appreciated!
DOGS looks promising right now, breaking out from a falling wedge and currently retesting the wedge. I recommend going long here with a tight stop loss and low leverage.
Targets:
$0.00094
$0.00108
$0.00121
$0.00133
Stop Loss: $0.000736
Leverage: 5x
What are your thoughts on DOGS's current price action? Do you see a bullish pattern? Share your analysis in the comments below!

Bajaj Finance: LongIt has formed a falling wedge and triple bottom pattern at important support level.
Falling wedge trendline is already broken and price is making higher higher and higher low pattern.
RSI is above 60 indicating high momentum. Volume are rising
Support 7400 and Resistance is 8200

CEG -Falling Wedge Breakout -DailyThis chart depicts **Constellation Energy Corporation (CEG)** on NASDAQ with a daily timeframe. Here's an analysis of the current price action:
### Key Observations:
1. **Falling Wedge Breakout:**
- The stock has broken out of a **falling wedge pattern**, a bullish signal. The wedge starts around the high in May 2024, with a steady decline until early September.
- The breakout occurred with strong momentum, as evidenced by the sharp price rise to **$254.98**, signaling the potential start of a new uptrend.
2. **Cup and Handle Formation:**
- A **Cup and Handle** pattern is visible, a bullish continuation pattern that suggests more upside is likely after the breakout.
- The "cup" spans from June to August, followed by a smaller "handle" in September.
3. **Targets:**
- After breaking above the **$199.59** resistance level, the first measured move shows a potential gain of **22.23%** from this breakout level, targeting **$276.11**.
- If this move plays out, the next target is an additional **38.48%** increase, aiming for **$276.11**, indicating the potential for further gains.
4. **Support Levels:**
- If the breakout fails or a pullback occurs, immediate support lies at the **$199.59** level, which coincides with the bottom of the wedge.
- A deeper pullback could find support near the **$120.00** level.
5. **Volume Surge:**
- There was a significant increase in volume during the breakout, with **15.031M** shares traded, signaling strong buying interest and conviction behind the move.
### Conclusion:
- The breakout from both the **falling wedge** and the **cup and handle** patterns suggests a strong bullish outlook for Constellation Energy. Immediate targets are **$276.11**, with potential upside to **$280.00**, while **$199.59** serves as the nearest support.

ALKYLAMINE : How to spot Trend Reversal There are 3 tools to identify a Trend Reversal
Fibonacci Retracement Indicator:
- Fibonacci retracement levels are prices, depicted as horizontal lines on a chart, that indicate where support or resistance could likely to occur.
- The indicator is useful because it can be drawn between any two significant price points, such as a high and a low. The indicator will then create the levels between those two points.
Here in this chart Swing low is 462 and Swing high is 4386
The price has fallen from 4386 and is consolidating at 0.618 which is also called as golden ratio and acts are strong support.
Pattern Identification:
The falling wedge pattern occurs when the asset’s price is moving in an overall bullish trend before the price action corrects lower. Within this pull back, two converging trend lines are drawn. The consolidation part ends when the price action bursts through the upper trend line, or wedge’s resistance.
Volume breakout after consolidation: Here in this chart, volumes are huge near the upper trendline of falling wedge pattern indicating a strong trend reversal.
Thanks for sparing time to read this learning article. Good day!

Mishtann Foods - Falling Wedge Breakout - Ascending ChannelMishtann Foods has recently broken out of a Falling Wedge pattern on Daily Timeframe, as shown in the Chart.
The stock has also been moving in an Ascending Channel on Weekly timeframe and has recently taken support at the bottom of the channel and bounced from there.
Support at the bottom of the Channel has been tested 3 times, as shown in the image.
Looking good to me. What are your thoughts?
Disclaimer: This analysis is for educational purposes and should not be considered financial advice.

HAPPSTMNDS - Falling Wedge Pattern Formation🔊 HAPPSTMNDS - Falling Wedge Pattern Formation
HAPPSTMNDS - HAPPIEST MINDS TECHNO LTD
⌛Duration - Long Term (1 year to 2 years)
📊📈 Trade Logic - Falling Wedge Pattern Formation
CMP - ₹ 813
Time Frame - Weekly
🎯Target 1 : ₹940
🎯Target 2 : ₹1050
🎯Target 3 : ₹1160
🎯Target 4 : ₹1260
🛑 Stop : ₹735
🏆 Risk/Reward Ratio (1: 7)
* Stock hit ATH of ₹1580 on 12th July 2021
* After sharp fall from july 2021 to June 2022,
stock goes into consolidation mode without
any significant price change.
* Stock recently bounced back from support
line and this time there is high chance to
break the resistance and start upward journey
* Trade reason - IT sector in momentum,this stock
is already beaten down and is at good support
level.
* FII and DII have increased their stake in June
qtr vs March qtr.
Disclaimer: The stock information shared above is not a recommendation to buy, sell, or hold. It reflects my own analysis and is intended solely for educational purposes. Any actions you take based on this information are your responsibility, and the admin of this channel is not liable for any financial gains or losses. Please consult a financial advisor before making any investment decisions. I am not a SEBI-registered advisor.

TATA TECHNOLOGIES LTD FALLING WEDGE BREAKOUTTata Technologies Limited
It has shown Termendous breakout with
3 weekly higher high closing candles which will lead to two big green candles in short term-
for a target of 1400.
Then it will consolidate before starting next leg of run-
For target second that is of 1830.

KOLTEPATIL AT DAILY DEMAND ZONEKOLTEPATIL (KOLTE-PATIL DEVELOPMENT)
About the company
The company has been creating landmarks for over 3 decades and has developed and constructed over 50 projects including residential complexes, commercial complexes and IT Parks covering a saleable area of ~20 million square feet across Pune, Mumbai and Bengaluru.
Kolte-Patil is a trusted name with an established reputation for high quality standards, design uniqueness and transparency.
Stock is at Daily Demand Zone Look At the chart👇👇
Trade Setup-
LTP 429
any dip upto 400 can be bought
For targets🎯 457 / 483 / 505 / 521++
Above 525 it would be a breakout.....
Breakout Targets🎯 555 / 581 / 600 / 625+++
WEEKLY SUPPORT 380---370
Tecnical Analysis...
1) Formation in progress of..Falling Wedge pattern on Daily Charts...
2) Volume addition
3) At good and strong numbers
4) Daily and Weekly Support
Regards...
Harm⭕️nics4Life
17/07/2024
Disclaimer & Risk Warning
I am not sebi registered analyst.
My studies shared here are for educational purposes .. Do Consult Your Financial advisor Before Taking any Trade.....Good Luck!

IRFC - Falling Wedge,This chart displays the daily price action of Indian Railway Finance Corporation Limited (IRFC) on the NSE (National Stock Exchange of India). Here’s an analysis based on the chart provided:
### Key Observations:
1. **Descending Wedge Pattern**:
- The price action has formed a falling wedge, a bullish reversal pattern. The price has broken out of the wedge, indicating a potential upward move.
2. **Support and Resistance**:
- The previous resistance level around ₹193.10, which also acted as support in past, is key. The breakout from the wedge aligns with this level, suggesting a retest of this area.
3. **Volume Analysis**:
- There’s been a spike in volume during the breakout, indicating strong buying interest. This adds credibility to the bullish breakout.
4. **Relative Strength Index (RSI)**:
- The RSI is near the neutral zone around 49.53, which suggests there’s room for upward momentum before entering overbought territory. The recent uptick in RSI supports the bullish outlook.
### Possible Scenarios:
- **Bullish Case**: If the price sustains above the ₹193.10 level, a continuation of the upward trend could lead to further gains, potentially towards previous highs around ₹230.
- **Bearish Case**: If the price fails to hold above the wedge breakout level and drops back into the pattern, a retest of lower support levels around ₹165-170 is possible.
### Conclusion:
The chart suggests a bullish breakout with potential for further upside, but watching the ₹193.10 resistance level is crucial for confirmation. The RSI and volume are supportive of a bullish scenario, but risk management is important in case of a false breakout.

BBTC - Swing Trade Analysis - 12th August #stocksBBTC - BOMBAY BURMAH TRADING (1D TF) - Swing Trade Analysis given on 12th August, 2024
Pattern: FALLING WEDGE BREAKOUT
- Resistance Trendline Breakout - Done ✓
- Pullback Candle from Weekly Support Zone - Done ✓
- Volume Buildup at Resistance Trendline - Done ✓
- Demand Zone Retest & Consolidation (for a small SL and a better RR) - In Progress
* Disclaimer
