Federalbank
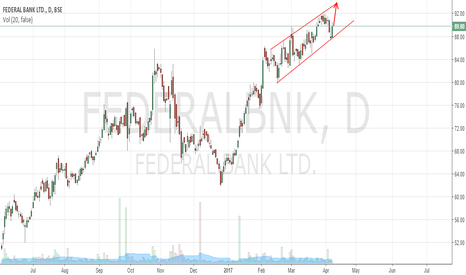
Federal bank short term view againFederal bank looks weak after reached the head and shoulder target. Support 91 is strong. if it breakdown, it may go around 84 range. It may take few weeks or upcoming week. indicators are in bearish mode only so it helps to breakdown the support level.
Stoploss: Stright line mentioned in chart keep that on closing basis
Vijayaraghavan,
Kovilpatti.
A modified analysis of Federal Bank due to Result impactThe resistance level is the key and once it is broken, wait for the next signal. If it goes higher than 105.65 on 19th Jan, then in less than 2 weeks, it can achieve first target @ 122.40 or above. Second target would be the same as I have mentioned in my first chart analysis.
Federal Bank short term viewBandbollinger forms a narrow range in weekly chart and Macd lines might cut on coming week. In daily chart ADX,RSI are positive. These indicators may help to break the triangle pattern.
From the trend lines(not shown in the graph) targets are
122.3
124.18
126.05
126.5
127.8
129.47
130.45
Stoploss :114.5
Vijay,
Inditrade,Kovilpatti
Channel Trade Setups It is been observed that the price action in both stocks trending up in the channel. They both getting high demand on the support levels or the supporting line of the channel, indicating buyers pushing up price action in a channel setup.
I shall be updating the trade calls on Monday.
Regards.


