FEDERALBNK - Demand Zone on the Rise📌 Demand Zone
Demand Zone High: 258.80
Demand Zone Low: 253.75
The stock has just broken into a fresh 52-week high with a powerful expansion candle, supported by bullish volume and strong relative strength against the index. Momentum indicators such as RSI, CCI, and Stochastics are all in the overbought zone, signalling a strong trend in motion but also hinting at the possibility of brief pullbacks as price cools off. The demand zone at 258.80–253.75 acts as the key institutional pocket where buyers previously absorbed supply, making it the most reliable retest area if price dips. OBV remains elevated, EMA bands are fully expanded, and the structure continues to show higher highs with controlled corrections, confirming that buyers remain firmly in command. Overall, the setup reflects a clean bullish continuation with a low-risk structure as long as the price holds above the newly formed demand zone.
________________________________________
⚠️ STWP Legal Disclaimer (SEBI-Compliant)
This document is strictly for educational and informational purposes. All examples, charts, levels, and option structures discussed are illustrative and are not intended as buy, sell, or hold recommendations. STWP does not provide investment advice, trading tips, signals, or personalized financial guidance of any kind, nor is it a SEBI-registered intermediary or research analyst. The analyses, illustrations, and risk–reward structures included here are generic in nature and based on publicly available data and observed market behaviour, which may change without notice. Financial markets involve significant risk; derivatives in particular carry the potential for substantial losses. Option premiums, implied volatility, open interest, delta, and other market variables can fluctuate rapidly and unpredictably.
Readers are solely responsible for their trading decisions, capital management, and risk assessment. Before making any investment or trading decision, please consult a SEBI-registered investment advisor. STWP, its representatives, and affiliates shall not be liable for any direct or indirect loss arising from the use of this material. Historical patterns or past market behaviour do not guarantee future outcomes. Nothing in this document should be interpreted as a promise of performance, accuracy, or returns.
Position Status: No active position in FEDERALBNK at the time of analysis.
Data Source: TradingView & NSE India (Past Chart Reference for any charts used).
________________________________________
Federalbanktechnicalanalysis

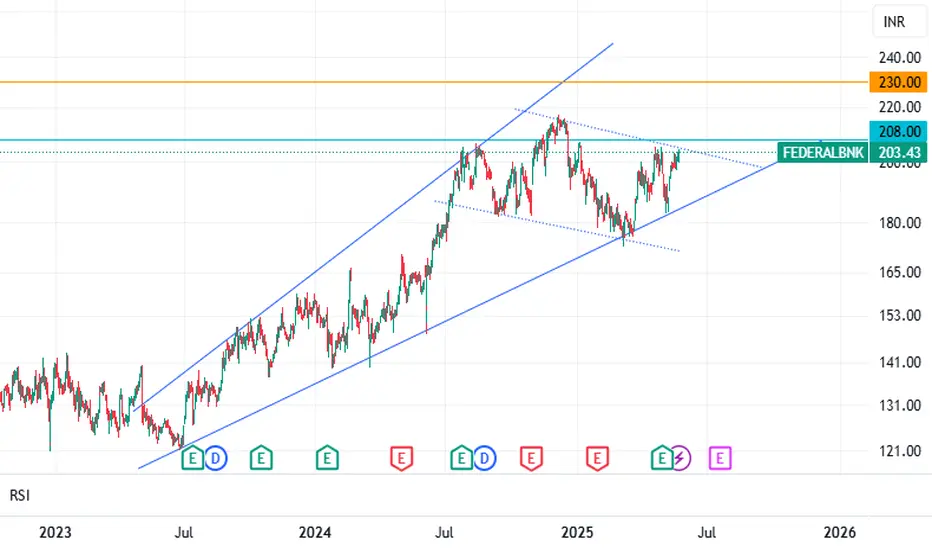
Federal Bank LtdFederal Bank Ltd. is currently exhibiting strong bullish signals according to various technical indicators. Although the recent decrease in trading volume indicates a potential short-term consolidation, the overarching trend appears to be upward.
It is suggested that the price action be monitored closely for a potential entry point if the price surpasses 208, with an anticipated target of 230.
Federal Bank cmp 183.83 by Daily Chart viewFederal Bank cmp 183.83 by Daily Chart view
- Resistance Zone 197 to 202 Price Band
- Support Zone at 179 to 182.50 Price Band
- Volumes are spiking today thou on the selling side but seems demand buying is inching in
- Price needs to sustain closure over Rising Support Trendline hurdle at +/- 188 for fresh upside
