XAUUSD – Weekly outlookXAUUSD – Weekly outlook: structure points towards 4,580 as long as bulls hold the line
Brian – Favouring buy-the-dip setups while price holds above 3,996
1. Market overview – triangle break and trend confirmation
On the daily chart, gold has finally broken out of the long consolidation triangle, with Friday’s candle closing cleanly above the descending trendline that has capped price for weeks.
For me, this breakout is the first proper confirmation that the primary bullish trend is resuming.
The next major resistance on the chart sits around 4,246 – a key level I’m watching as a trend-confirmation line.
If price can break and hold above 4,246, the path towards the higher zone around 4,580 opens up, in line with the Fibonacci extension drawn on the chart.
In short: the structure into next week is bullish, with pullbacks seen as opportunities to position for a potential move towards new highs.
2. Technical structure – from breakout to extension targets
The breakout from the triangle comes after a sequence of higher lows bouncing off the rising trendline, indicating accumulation rather than distribution.
Below price, we have demand zones clustered around the 4,110 trendline area and deeper supports near 4,040 and 3,920.
Above price, the roadmap is fairly clear:
First, a test of 4,246 (local resistance & former supply).
Then the ATH / prior high region around 4,360–4,380.
Finally, the Fibonacci 1.618 extension projects into the 4,560–4,580 zone, which is my medium-term upside objective if bulls can maintain control.
As long as daily structure keeps printing higher highs and higher lows and price stays above the key invalidation at 3,996, I will continue to treat gold as buy-on-dip rather than looking for major tops.
3. Key zones & trading ideas for next week
I’m not treating this as a signal service, but here’s how I’m mapping the chart for my own trading:
Primary idea – Buy the dip into trendline / support
Watch zone: around the rising trendline near 4,110.
If price pulls back into this area early in the week and shows a clear rejection on H4/D1 (wick rejections, bullish engulfing etc.), I’ll be interested in building long positions.
Upside path:
First objective: 4,246 – trend-confirmation resistance.
If broken and retested from above, the next leg could extend towards 4,360–4,380.
Extension target: 4,560–4,580 in line with the 1.618 Fibonacci projection.
Secondary idea – Using Fibonacci zones on break above 4,246
If gold breaks and holds above 4,246, the Fibonacci zones between roughly 4,360 and 4,580 become interesting for scaling in / managing positions:
Partial profits or tight trailing stops can be considered as we approach 4,360–4,380.
Any healthy corrective pullback from that region that respects the rising structure could still offer add-on entries with the 4,580 zone as a medium-term target.
Invalidation:
A daily close below 3,996 would seriously damage this bullish structure and force me to reassess. Below that, I would step aside and wait for a new pattern rather than trying to force the long idea.
4. Fundamental backdrop – why gold still has a bid
From a macro point of view, gold is navigating a mix of:
Tariff and trade tensions, which keep hedging demand alive as investors look for protection against policy shocks.
Ongoing geopolitical risks and conflict, supporting gold’s role as a classic safe-haven asset.
A late-cycle interest-rate environment, where markets are increasingly focused on when and how aggressively central banks will adjust policy after a period of elevated rates and liquidity distortions.
This combination tends to limit the downside for gold: even when we see corrections, dip-buyers are never too far away, especially when the technical structure is aligned with the macro story.
5. Strategy & risk management
Into next week, my bias is clear: structure is bullish above 3,996, so I prefer buying pullbacks rather than trying to short into strength.
The trendline around 4,110 is my first area of interest for fresh longs; anything closer to 4,040–4,000 (if we see a deeper flush) would be considered an even better price, provided the daily structure doesn’t break.
As always, position sizing and stop placement are key – one good weekly move is far more valuable than several emotional entries trying to catch every candle.
What do you reckon – does this breakout have enough fuel to take us towards 4,580, or do you see a deeper correction setting up first? Feel free to share your view in the comments.
Fibonacci

Descending Triangle BreakoutOberoi Reality is forming a Descending Triangle Pattern and can be a good Swing Trade for two reasons:
1. Descending Triangle Pattern gives a Good Breakout Movement.
2. The QOQ result of the stock has been very good with an increase of Profit in the Medium Term.
3. The stock has formed higher low in Price as Well as RSI.
I've set the targets at 38.2 and 50 levels of the fibonacci.
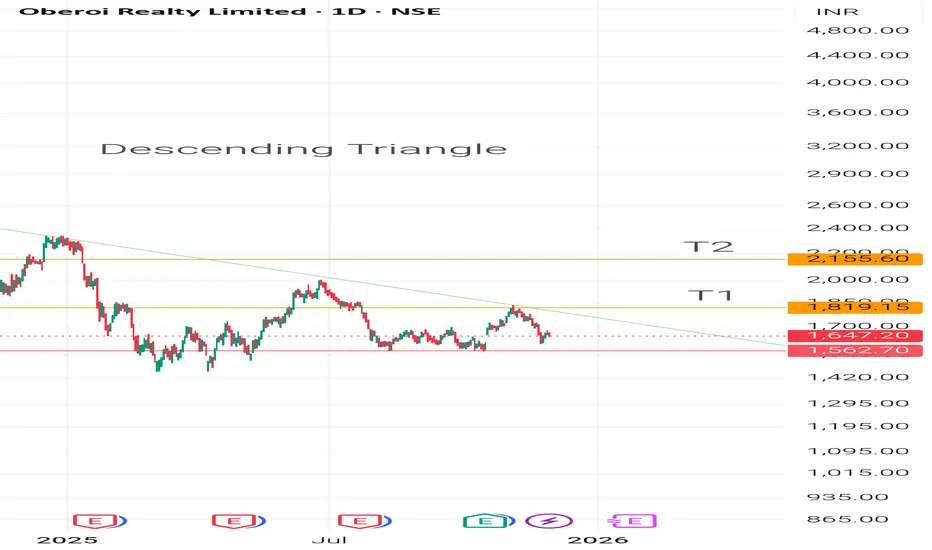
Potential Upside The Stock has potential upside for two reasons:
1. Stock is showing Uptrend with Higher lows and has taken support on trend line.
2. The Rsi of the stock is also supporting Uptrend.
The two targets can be set at the next Fibonacci Levels.
TATA STEEL- cup and handleTATA STEEL cup and handle formation in the making. Breach of 185 levels leading to targets

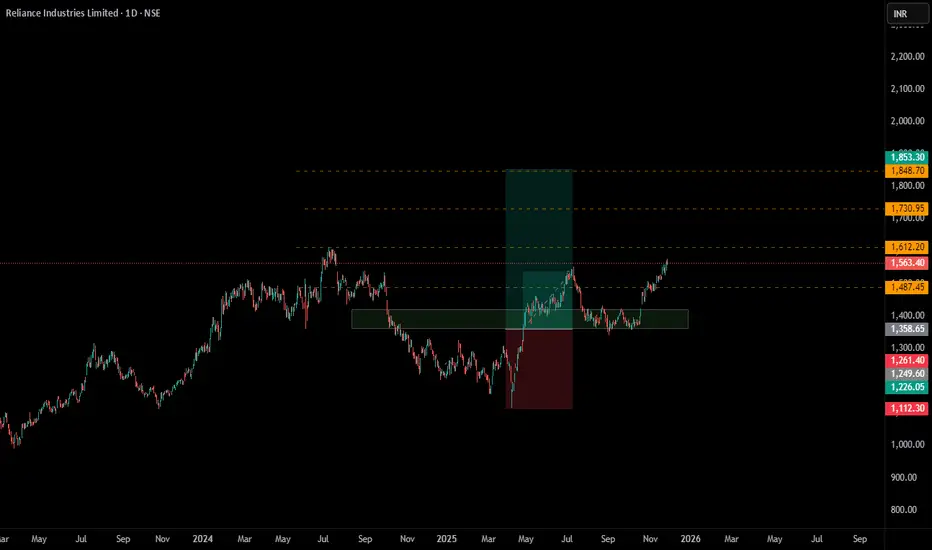
RELIANCE INDUSTRIES- CUP AND HANDLERELIANCE INDUSTURED POISED FOR A RUN BASED ON
1) SWING STRUCTURE
2) FIBO LEVELS
3) CUP AND HANDLE PATTERN
Any dip should be considered as buying opportunity.
XAU/USD: Gold Stagnates, Poised for a Strong Surge📊 Market Structure
Gold is moving in a tight accumulation phase (compression) between two important zones:
• OB Support: 4,130 – 4,126
• Resistance – Small Supply: 4,148 – 4,166
The previous trend remains a strong uptrend (clear BoS sequence from 4,089), and currently, the price is retesting the newly formed peak-bottom structure.
The BUY side is still in control as long as the price stays above:
• 4,130 – Main OB Support
• 4,104 – Discount FVG
• 4,089 – Key Low Confirming Trend
If gold holds these zones, the next targets will be the upper liquidity levels:
• 4,166
• 4,181
• 4,207
• 4,243
💎 Key Technical Zones
• OB Support 1: 4,130 – 4,126
• FVG Zone: 4,104 – 4,089 (best discount)
• Deep Bearish OB: 4,060 – 4,045 (if price drops sharply)
• Upper Liquidity Targets: 4,166 → 4,181 → 4,207 → 4,243
🎯 Trading Plan (Priority BUY)
1️⃣ BUY 1 – Retest OB 4,130
When the price touches the OB support zone 4,130 – 4,126 and shows a bounce signal (rejection / engulfing).
• Entry: 4,130 – 4,126
• SL: below 4,115
• TP1: 4,166
• TP2: 4,181
• TP3: 4,207
• TP4: 4,243
→ Quick setup, good RR, trend aligned.
2️⃣ BUY 2 – Discount FVG 4,104 – 4,089
This is the best BUY zone if the market drops sharply before rising.
• Entry: 4,104 – 4,089
• SL: 4,070
• TP1: 4,166
• TP2: 4,181
• TP3: 4,207
• TP4: 4,243
→ Strong confluence: FVG + fibo discount + key liquidity.
3️⃣ BUY 3 – Deep Accumulation at Bearish OB Shift
• Entry: 4,060 – 4,045
• SL: 4,020
• TP: 4,104 → 4,166 → 4,207
→ Only activate if “flush liquidity” appears.
🎯 SELL Scalp (secondary – not priority)
Only SELL when there is a clear rejection reaction at:
• 4,166 – first liquidity sweep zone
• 4,181 – strong reaction zone
• 4,207 – main bearish OB
• 4,243 – large liquidity peak
• SL: 10–15 USD
• TP: 4,148 → 4,130
→ For scalpers only, not a main setup.
🧠 Vincent’s View
The market structure remains completely bullish. The market is accumulating energy in a narrow range before breaking strongly to the upper liquidity targets.
As long as gold stays above 4,089 – the uptrend remains dominant.
“Patience builds the entry – liquidity completes the move.” ⚜️
⏰ Timeframe: 1H
✍️ Analysis by: Captain Vincent

XAU/USD – Gold Holds Above Key Support as Pullback Stays LimitedGold remains capped below its two-week high during the Asian session, but the downside is clearly limited.
Market sentiment is shaped by:
A weaker USD as dovish Fed expectations gain traction
Rising probability of rate cuts in upcoming meetings
Improving global risk sentiment amid hopes of progress in Russia–Ukraine negotiations
Even though Gold is retracing, the bigger picture remains bullish as long as price holds above key support zones.
📊 Technical Outlook – MMF Trading Style (M30/H1)
Price is currently consolidating below the resistance cluster 4,156 – 4,170, retracing into multiple demand zones.
Key Levels to Watch
Support 1: 4,131 – 4,137
Support 2: 4,115 – 4,118
Support 3 (major liquidity): 4,083 – 4,090
Main Resistance: 4,170 – 4,193
Market structure shows a clean zigzag pullback, suggesting a potential bullish continuation once liquidity is collected below.
🎯 MMF Intraday Trading Plan
Scenario 1 – Buy the Dip (Primary Bias)
Best trade today: Buying retracements into demand.
BUY: 4,115 – 4,118
SL: 4,103
TP: 4,131 → 4,156 → 4,170
BUY (extended liquidity sweep): 4,083 – 4,090
SL: 4,070
TP: 4,118 → 4,145 → 4,170 – 4,193
Reason: Fibo confluence + strong demand + liquidity zone = high-probability reversal area.
Scenario 2 – Short-Term SELL (Scalp Only)
Only valid if price rejects strongly at resistance.
SELL: 4,156 – 4,170
SL: 4,177
TP: 4,145 → 4,131
This is not the main bias today.
⚜️ MMF Trading View
Gold is forming a healthy pullback—not, at this stage, a bearish reversal.
As long as price stays above 4,08x, the bullish structure remains intact.
“In Gold, the goal isn’t chasing the breakout — it’s waiting for price to return to value.”
Today’s focus: Prefer BUY setups on retracement – SELL only for quick scalps.

IndiaMArt - Reversal based on RSI CDIndiaMART (NSE) - Technical Analysis & Trade Setup
Current Price: 2,376.70
Trade Setup Overview
This trade setup is based on RSI Classic Divergence combined with Price Action analysis. The stock has shown a bullish divergence pattern on the RSI indicator while forming a potential bottom around the 2,243-2,377 zone.
Entry Strategy
Entry Type: Aggressive Entry (Current levels)
Confirmation Entry: Only initiate trades after candle closing above **2,437** on a 1:2 risk-reward ratio basis.
Target Levels
- Target 1: 2,459.70 (Fibonacci 0.382 level)
- Target 2: 2,593.00 (Fibonacci 0.618 level)
- Target 3: 2,676.65 (Fibonacci 1.0 extension)
**Potential Upside:** 8.5% to 12.6% from current levels
Risk Management
Stop Loss: 2,252.50 (on candle closing basis)
Risk from Current Price: ~5.2%
Technical Indicators
RSI Analysis
- RSI showing classic bullish divergence
- Price made lower lows while RSI made higher lows
- Current RSI around 62.25, indicating bullish momentum
- RSI breaking above previous resistance zones
Fibonacci Retracement Levels
- 0 (2,243.15) - Recent Low
- 0.382 (2,377.00) - Current Support Zone
- 0.618 (2,518.60) - Key Resistance
- 1.0 (2,676.25) - Extension Target
Key Observations
1. Stock has recovered from the October low of 2,243 levels
2. RSI divergence suggests potential trend reversal
3. Price action forming higher lows, indicating accumulation
4. Multiple Fibonacci resistance levels ahead that may act as profit-booking zones
Important Notes
- This is an **aggressive entry** setup for risk-tolerant traders
- Conservative traders should wait for confirmation above 2,437
- **Strictly maintain stop loss** on closing basis below 2,252.50
- Book partial profits at each target level
- Trail stop loss as price moves in your favor
- Monitor RSI for any bearish divergence at higher levels
Disclaimer
This analysis is for educational purposes only. Please do your own research or consult with a financial advisor before making any investment decisions. Past performance does not guarantee future results.
**Follow for more technical analysis and trade setups!**
#IndiaMART #TechnicalAnalysis #StockMarket #Trading #RSIDivergence #FibonacciTrading #NSE

FVG Retracement With EMA, RSI & Fib Confluence📈 Bitcoin Chart – FVG Retracement With EMA, RSI & Fib Confluence in a Bearish Market Structure
This chart showcases a sustained bearish sequence on BTC, defined by a clean continuation of Lower Highs (LH) and Lower Lows (LL). Throughout this decline, multiple Fair Value Gaps (FVGs) have formed both locally and at higher levels — each created by strong institutional sell-side displacement.
As price trends downward, these unmitigated FVGs above the market consistently act as magnet zones:price retraces into previous inefficiencies, rebalances them, and resumes the dominant bearish trend.
In the current setup, the integration of FVGs + Fibonacci Retracement(Point A to B) + EMA Levels + RSI Momentum provides a highly structured roadmap for anticipating retracements and continuation points.
The most significant imbalance sits near the major Fib retracement zone and under key EMAs — making it the highest-probability reaction area. Secondary FVGs below it may still induce a bounce, but carry lower structural relevance.
⸻⸻⸻⸻⸻⸻⸻⸻⸻⸻
📊 Key Observations
1️⃣ Prior FVG Mitigation
A previously formed FVG under the EMA was cleanly filled, followed by immediate downside continuation.
This confirms bearish order-flow control and validates the role of FVGs as efficient retracement targets in a downtrend.
2️⃣ High-Priority FVG (Primary Zone)
The upper FVG holds the strongest confluence:
Created by strong displacement
Sits below the EMA50
Aligns with the 38.2%–61.8% Fib retracement zone
This cluster makes it the most likely zone for a meaningful bearish rejection if price retraces into it.
3️⃣ Secondary FVG Reaction Zone
A lower FVG also exists beneath the main zone.
Although it can cause a minor corrective bounce, it formed during a smaller move and does not align with the key trend or Fib levels — giving it lower probability.
4️⃣ RSI Momentum Context
RSI remains below 50, confirming bearish momentum.
When RSI stays under mid-line, bearish FVG reactions tend to be more reliable and continuation setups form cleanly.
5️⃣ Structural Context
The broader structure remains decisively bearish as long as price trades below the EMAs and below the major upper FVG.
Retracements into these zones are more likely to serve as rebalancing moves rather than genuine reversal attempts.
⸻⸻⸻⸻⸻⸻⸻⸻⸻⸻
📊 Chart Explanation
Symbol → BTCUSDT
Timeframe → 1D
This visualization illustrates how Smart Money Concepts apply cleanly during strong trending conditions:
A clear LH–LL downtrend
Several historical FVGs acting as retracement magnets
A previously mitigated FVG confirming bearish control
A high-confluence FVG aligned with EMAs and Fib levels
A secondary imbalance that can still induce short-term reactions
RSI showing momentum remains bearish
Together, these elements outline a textbook sequence:
displacement → inefficiency → retracement → rebalancing → continuation.
Price remains under firm bearish control unless it breaks above the upper FVG with conviction.
⸻⸻⸻⸻⸻⸻⸻⸻⸻⸻
📘 Using Fib Retracement, EMA50, and RSI With FVGs (Bullish + Bearish)
🔹 1. Fibonacci Retracement + FVG
In a downtrend, draw Fib from swing high → low; in an uptrend, draw low → high
The 38.2%–61.8% zone is the prime retracement area in both directions.
If an FVG forms or sits inside this Fib zone, it becomes a high-probability reaction point (bearish rejection in downtrend, bullish bounce in uptrend).
🔹 2. EMA50 + FVG
In a bearish trend, price and FVGs forming below EMA50 act as stronger bearish retracement zones.
In a bullish trend, price and FVGs forming above EMA50 act as stronger bullish retracement zones.
EMA50 acts as a mean reversion point where price often returns to rebalance before continuation.
🔹 3. RSI + FVG
RSI below 50 → bearish momentum → bearish FVG reactions are more reliable.
RSI above 50 → bullish momentum → bullish FVG reactions are more reliable.
If RSI rises from oversold (or falls from overbought), it often signals a retracement phase toward nearby FVGs.
🔹 4. Combined Logic (Works for Bullish and Bearish)
Displacement creates an FVG (inefficiency).
Price retraces into the 38–61% Fib zone.
Retracement taps EMA50 or stays on the correct side of EMA50 (below for bearish, above for bullish).
RSI confirms momentum (below 50 for bearish continuation, above 50 for bullish continuation).
Price rejects from the FVG and continues the trend.
⸻⸻⸻⸻⸻⸻⸻⸻⸻⸻
✅ Summary
Market structure remains bearish with consistent LHs and LLs.
A previously filled FVG under the EMA validated the continuation move.
The upper FVG is the highest-strength level due to EMA + Fib + displacement confluence.
A lower FVG exists but carries reduced importance.
RSI below 50 reinforces bearish momentum and reliability of bearish FVG reactions.
⸻⸻⸻⸻⸻⸻⸻⸻⸻⸻
⚠️ Disclaimer
📘 For educational purposes only.
🙅 Not SEBI registered.
❌ Not investment advice.
🧠 Smart-Money-Concepts explanation only.

XAU/USD – Gold Maintains Uptrend, Monitor Reaction at FvG⏰ Timeframe: 30m
📅 Update: 25/11/2025
🔍 Market Context
After breaking the downtrend structure and creating consecutive bullish CHoCH, gold is maintaining above the Break–FvG zone at 4,107 USD, indicating that buying pressure is still controlling the recovery phase.
The price is in a reaccumulation phase after the break, and it is likely to need a short pullback to "gain momentum" towards the extended resistance zone above.
📊 Technical Structure
FvG Zone (4,107 USD): newly formed balance zone – acts as the main BUY Zone, where price reactions can be observed for quick scalping opportunities.
Break Structure: confirms active buying flow after a series of CHoCH, shifting short-term bias to bullish.
Target Expansion: the 4,188 → 4,228 USD range is an extended resistance band, coinciding with Fibonacci 1.272–1.618.
💎 Key Levels
🟢 Main Support (Support Zones):
• 4,067 USD – technical balance bottom, the last defense zone.
• 4,084 USD – secondary support, confluence with Fibo 0.382.
• 4,107 USD – main FvG zone, monitor reaction for buy scalp.
• 4,131 USD – dynamic support in the recovery cycle.
🔴 Resistance (Resistance Zones):
• 4,155 – 4,165 USD → intermediate resistance zone, potential short-term profit-taking when price reacts.
• 4,188 USD → confluence with Fibo 1.272 – short-term SELL Zone.
• 4,203 – 4,211 USD → extended supply zone, monitor reaction before the US session.
• 4,228 USD → extended resistance, the final target of the current uptrend.
🎯 Market Outlook
1️⃣ Priority Scenario:
– Price may retest the FvG zone – 4,107 USD, then bounce to test resistances 4,155 → 4,188 → 4,228.
– Prioritize monitoring reactions – quick scalping at resistance zones, avoid holding long positions as price approaches 4,211–4,228.
2️⃣ Alternative Scenario:
– If price closes below 4,107 USD, it may reopen the lower balance zone around 4,067 USD.
🧠 Analyst’s View
The market structure leans towards bullish continuation, but the upper zone is approaching a dense resistance cluster – suitable for reactive trading strategies:
→ Observe reactions at each zone to "scalp with the flow," rather than trying to hold the trend.
As long as price maintains above 4,107 USD, the priority remains buy-the-dip – take-profit-on-resistance.
🛡️ Risk Note
Short-term volatility is expanding – clear candle reaction confirmation is needed before taking action.
Analysis is for technical and educational purposes, not investment advice.

Gold Holds Near 2-Week Highs as USD Softens Ahead of Fed CutsGold continues to trade firmly near recent highs as the USD weakens amid growing expectations of a Fed rate cut in December.
The earlier pullback was mostly driven by stronger risk appetite in equities, not by gold weakness itself — meaning the macro bullish backdrop remains intact.
With markets now pricing:
76% chance of a December rate cut,
and almost 90 bps of cuts by end-2026,
the broader environment continues to favour upside on dips.
📊 Technical Outlook – MMF Style (H1/H2)
Price has respected the ascending trendline drawn from the early-week swing low and is now pushing above the 0.618–0.786 retracement zone.
Key Levels
BUY Zone 1: 4,132 – 4,149 (Fibo 0.382–0.618 + demand)
BUY Zone 2: Trendline retest area
Target Zone: 4,188 – 4,195 (1.272–1.618 Fibo extension)
Structure is currently bullish, with clear higher highs and higher lows.
A retracement into 4,14x before continuation higher is the most probable scenario.
🎯 MMF Trading Plan (Intraday)
Primary Setup – BUY Dip Continuation
BUY: 4,132 – 4,149
SL: 4,121
TP:
→ 4,168
→ 4,185
→ 4,192 – major extension target
Alternative Scenario – Break & Hold Above 4,170
If price consolidates above 4,170, expect a direct push toward 4,19x without a deep pullback.
Bearish Scenario (Low probability for now)
Only valid if price breaks below trendline + closes under 4,128.
Target would be a deeper correction toward 4,10x — but this is not the base case.
🧠 MMF View
Gold’s structure + macro narrative → bullish trend intact.
The market is clearly positioning ahead of possible December policy easing — dips into 4,13x–4,14x remain attractive opportunities.
“In a rate-cut environment, gold tends to trend — the only task is to buy from strength, not chase.”

XAU/USD: Gold Bullish, Watch for Pullback to 4,150-4,130⏰ Timeframe: 30m
📅 Update: 26/11/2025
🔍 Market Context
After a strong upward trend and breaking the resistance zone of 4,096 USD, gold enters a technical correction phase to reaccumulate liquidity.
The price is currently fluctuating around the 4,150 USD area, serving as a crucial pivot to confirm whether the bullish structure will continue or require a deeper retracement.
📊 Technical Structure
4,150 USD (Mid Support): quick reaction zone, potential for short-term buy orders (scalp).
OB (4,130 USD): priority BUY Zone, confluence with 0.5 Fibo – main rebalancing area.
Support Base (4,096 USD): Break–Resistance zone, maintaining the medium-term bullish trend structure.
Target Expansion: 4,181 → 4,202 → 4,211 → 4,235 – 4,242 USD.
💎 Key Levels
🟢 Support Zones:
• 4,096 USD – main structural base.
• 4,130 USD – main OB (priority BUY).
• 4,150 USD – intraday pivot, quick reaction for scalping.
🔴 Resistance Zones:
• 4,181 USD – short-term resistance.
• 4,202 USD – intermediate balancing zone.
• 4,211 USD – expansion zone (1.272 Fibo).
• 4,235 – 4,242 USD – extended supply zone (1.618), prone to profit-taking reactions.
🎯 Market Outlook
1️⃣ Priority Scenario:
– Price lightly pulls back to the 4,150 USD area, potential for quick reaction.
– If it breaks through 4,150, the 4,130 USD (OB) zone will be the balancing point for a stronger recovery.
– Expansion targets: 4,181 → 4,211 → 4,242 USD.
2️⃣ Secondary Scenario:
– If the price breaks below 4,096 USD, the short-term bullish structure becomes invalid, shifting to a neutral state.
🧠 Analyst’s View
4,150 USD is the "stepping stone" between the OB zone and short-term resistance – where the market decides to continue or accumulate deeper.
A reasonable strategy is to monitor quick reactions at 4,150 (scalp) and prioritize clear buy opportunities at 4,130 (OB) if the price retraces deeply.
🛡️ Risk Note
The market is rebalancing within an uptrend – avoid hasty actions without clear candle or cash flow confirmation.
Analysis is technical & educational, not investment advice.

XAU/USD: Gold Bullish, Waiting for Perfect Buy Pullback📊 Market Structure
Gold is maintaining a strong bullish structure after a series of BoS from the bottom region. The most recent rally broke the 4,130 mark and continues to hold above the small OB area, indicating that the BUY side is still in control.
Currently, the price is slightly retracing to retest the structure — the target is to test the area:
• OB 4,130 – 4,126 USD
• Or deeper to FVG 4,104 – 4,089 USD
In both cases, these are discount areas to continue BUYING according to the main trend.
The larger trend still targets the upper liquidity levels including:
• 4,151
• 4,181
• 4,207
• 4,243
💎 Key Technical Zones
• OB Retest Zone: 4,130 – 4,126 (quick bounce area)
• FVG Zone: 4,104 – 4,089 (best discount area to BUY)
• Large Bearish OB: 4,045 – 4,060 (final area if price adjusts deeply)
• Target Zones: 4,151 – 4,181 – 4,207 – 4,243
🎯 Trading Plan – BUY (priority)
1️⃣ BUY 1 – Retest OB 4,130
• Entry: 4,126 – 4,131
• SL: below 4,115
• TP1: 4,151
• TP2: 4,181
• TP3: 4,207
• TP4: 4,243
→ This is a quick setup – for a short retracement before continuing.
2️⃣ BUY 2 – FVG 4,104 – 4,089 (best)
• Entry: 4,089 – 4,104
• SL: 4,070
• TP1: 4,151
• TP2: 4,181
• TP3: 4,207
• TP4: 4,243
→ This FVG area is a strong confluence: fibo, small demand, and trendline.
3️⃣ BUY 3 – OB Bearish shift (deep entry)
• Entry: 4,045 – 4,060
• SL: 4,020
• TP1: 4,104
• TP2: 4,151
• TP3: 4,207
→ Only activate when the market shakes strongly, but RR is extremely good.
🎯 SELL Scalp (secondary – only short trades)
Only SELL when the price reaches strong resistance areas and rejection signals appear:
• 4,151
• 4,181
• 4,207
• 4,243
Entry SELL: only enter when there is H1 rejection
SL: 10–15 USD
TP: back to 4,151 → 4,130
→ This is counter-trend, not a priority setup.
🧠 Vincent’s View
The overall trend is still bullish. The current retracements are just a “breathing phase” – the market is accumulating energy to continue pushing up to higher liquidity areas.
As long as the price stays above 4,089 – the bullish trend is not threatened.
“Smart Money buys the dip — Retail buys the breakout.” ⚜️
⏰ Timeframe: 1H
✍️ Analysis by: Captain Vincent

Gold Breaks Out of Consolidation, A New Bullish Cycle Incoming?Gold has shown a significant recovery, breaking out of the multi-day sideways range between 4,00x–4,10x. Instead of collapsing below 4000, strong buying pressure stepped in — pushing price back above 4100, signaling that the market may be choosing an early bullish breakout ahead of expectations for a potential FED rate-cut cycle.
📊 Technical Outlook (H1/H2)
1. Structure
Gold has officially broken out of the symmetrical triangle formation.
Price is now printing higher highs – higher lows, confirming short-term bullish structure.
2. Key Levels
BUY Zone 1: 4,095 – 4,100 (Fibo 0.236 + intraday demand)
BUY Zone 2: 4,118 – 4,122 (Fibo 0.382 + breakout retest zone)
Target Zone: 4,187 – 4,195 (Fibo 1.618 extension)
3. Expected Price Action
After rejecting the 0.786 Fibo, a corrective pullback is expected.
A retest of 4,118 or deep pullback to 4,095 is highly probable before the next bullish leg.
As long as price holds above 4,095, bullish bias remains intact.
🎯 Trading Plan — MMF Style
Primary Scenario – BUY the Retracement
BUY 1: 4,118 – 4,122
SL: 4,107
TP: 4,150 → 4,168 → 4,195
BUY 2 (safer): 4,095 – 4,100
SL: 4,082
TP: 4,150 → 4,170 → 4,195
If price clears 4,165, extended targets toward 4,19x–4,21x become possible.
Secondary Scenario – SELL only on strong rejection
Selling is not preferred in the current structure.
Only consider shorting if price forms a false breakout around 4,19x and confirms a bearish BOS on H1.
🧠 MMFLOW VIEW
Gold is showing early signals of shifting out of its medium-term downtrend and transitioning into a new bullish phase. With both technical breakout confirmation and fundamental support (rate-cut expectations) aligning, the path of least resistance is to the upside.
“In a rising market, missing the trend is far more costly than entering slightly early.”

XAU/USD: Gold Uptrend - Buy at 4,090 & 4,044 USD📊 Market Structure
Gold is maintaining an upward structure after creating a series of bullish BoS from the Demand zone. Currently, the price is technically pulling back to discount zones, where the BUY side has more advantages.
Above, the 4,206 USD zone is confirmed as OB Bearish , acting as strong resistance and a potential reversal point for the SELL side.
Below, the discount zones including Fibo–Buy 4,090 and OB Bullish 4,044–4,047 USD are reasonable places to wait for BUY to continue following the main trend.
💎 Key Technical Zones
• Fibo–Buy Zone: 4,085 – 4,095 → priority BUY zone
• FVG Reaction Zone: around 4,095 – 4,105 → signal present → BUY immediately
• OB Bullish: 4,044 – 4,047 → deep, safe BUY zone
• OB Bearish: 4,206 → strong SELL zone
• Partial resistance for SELL scalp: 4,169 – 4,186 – 4,206 – 4,237
🎯 Trading Plan – BUY (Main Priority)
1️⃣ Main BUY – Fibo–Buy 4,090
• Entry: 4,085 – 4,095
• SL: below 4,060
• TP1: 4,169
• TP2: 4,186
• TP3: 4,206 / 4,237
→ This is the most beautiful discount zone according to structure + fibo + trendline.
2️⃣ BUY on Reaction – FVG
If the price only touches FVG 4,095–4,105 and then shows a strong rejection candle:
• BUY immediately when there is a signal
• Target remains: 4,169 → 4,186 → 4,206 → 4,237
3️⃣ Defensive BUY – OB Bullish 4,044
• Entry: 4,044 – 4,047
• SL: 4,020
• TP1: 4,095
• TP2: 4,169
• TP3: 4,206
→ This is the “last bottom” zone before the uptrend is threatened.
🎯 Trading Plan – SELL SCALP (Not the Main Trend)
Zones where SELL can react when a reversal candle appears:
• 4,169 USD
• 4,186 USD
• 4,206 USD (OB Bearish)
• 4,237 USD (Supply)
Entry SELL: when there is a clear rejection (H1 long wick / engulfing)
SL: above the zone 10–15 USD
TP: back to 4,186 → 4,169 → 4,128
→ These are counter-trend scalp orders, only for flexible traders.
🧠 Vincent’s View
The main trend is still up, adjustments down to FVG – Fibo – OB Bullish are all beautiful BUY opportunities.
The BUY side dominates as long as 4,044 is not broken – SELL is only secondary, BUY remains the main play.
“Buy at discount, sell at reaction — that’s how the market moves.”
⏰ Timeframe: 1H
✍️ Analysis by: Captain Vincent

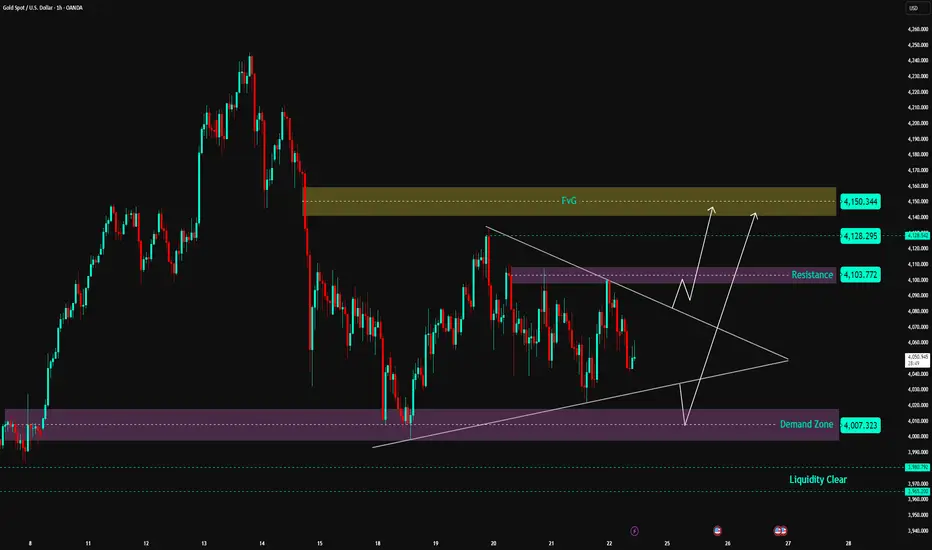
Gold Set to Explode from Triangle Pattern—Act Now!📊 Market Structure
Gold is entering a tight accumulation phase within a Symmetrical Triangle pattern – indicating compression before a strong breakout.
On the downside, the price is still supported by the Demand Zone 4,007 – 4,020 USD , which is the main support area for the medium-term uptrend structure.
On the upside, the Resistance Zone 4,103 – 4,110 USD continuously exerts pressure, causing price rejection.
Currently, gold is trading right in the middle of the compression triangle → the market is preparing to choose a direction.
Looking at the wave structure, the trend slightly leans towards a break up to sweep liquidity in the high area.
💎 Key Technical Zones
• ⭐ FVG Supply Zone: 4,128 – 4,150 USD → expected strong reaction area if price breaks up
• 🟣 Resistance Zone: 4,103 – 4,110 USD → decisive area for direction
• 🟪 Demand Zone: 4,007 – 4,020 USD → strong base maintaining structure
• 🟦 Liquidity Clear: 3,980 USD → risk area if price collapses the triangle
🎯 Trading Plan – Two Possible Scenarios
1️⃣ BUY – Wait for Breakout from Triangle (priority scenario)
If the price breaks the resistance zone 4,103 – 4,110 with a strong H1 closing candle:
• Entry: 4,112 – 4,115
• SL: 4,095
• TP1: 4,128
• TP2: 4,145
• TP3: 4,150 (reach FVG)
→ This is a trend-following setup, with a high probability of sweeping liquidity above after the break.
2️⃣ BUY – Retest Demand Zone 4,007 – 4,020
If the price continues to follow the triangle pattern and falls to the trendline + demand zone:
• Entry: 4,010 – 4,017
• SL: 3,990
• TP1: 4,103
• TP2: 4,128
• TP3: 4,150
→ This is a very strong confluence area between Demand Zone + Trendline + pattern base.
❌ SELL? When is it valid?
Currently, selling is not prioritized, as the price is still above the Demand Zone and the larger structure still favors an uptrend.
Selling is only valid if the price:
• Breaks strongly below 4,007 USD
→ At this point, the market turns bearish, with a distant target of 3,980 USD.
🧠 Vincent’s View
Gold is under strong compression. When the triangle pattern is broken, the move will be extremely fast and decisive.
The current trend leans towards breaking up and heading straight into the FVG area 4,128 – 4,150 USD.
Just be patient and wait for the confirmation candle — don’t predict, react to the market.
⚡ “Breakout is born from pressure — patience profits.”
⏰ Timeframe: 1H
📅 Update: 24/11/2025
✍️ Analysis by: Captain Vincent
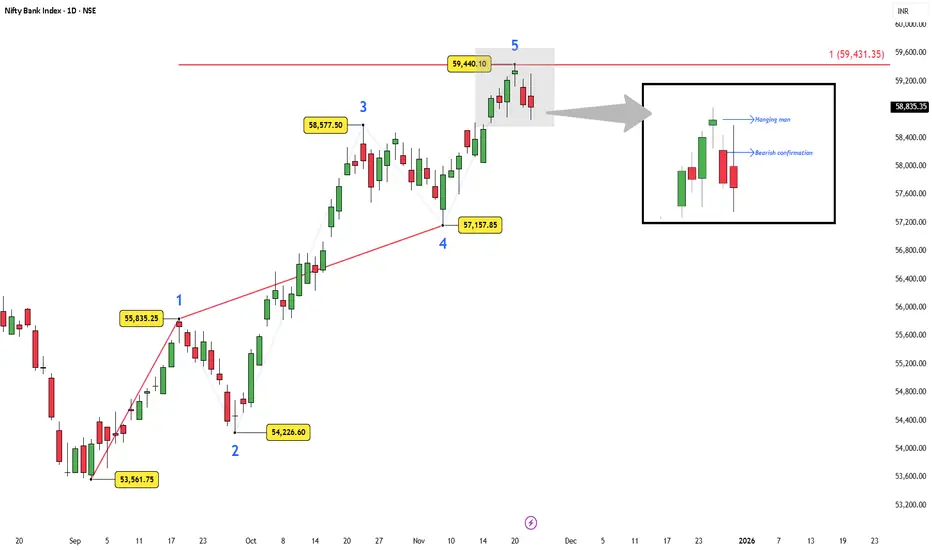
Bank Nifty — Wave 5 Meets 100% Extension ResistanceBank Nifty completed its five-wave rise with Wave 5 ending exactly at the 100% Fibonacci extension of Wave 1 , a classic termination level when Wave 3 is extended.
Inside this zone, price printed a Hanging Man followed by a bearish confirmation candle . The confirmation is not strong, but together with the Fibonacci symmetry at the Wave-5 target, it reflects clear exhaustion.
A corrective phase from this region is reasonable.
A strong reclaim above the recent high would invalidate the exhaustion and reopen the upside.
Disclaimer : This analysis is for educational purposes only and does not constitute investment advice. Please do your own research (DYOR) before making any trading decisions.
Indian Railway Finance Corporation – Complex Correction in PlayDisclaimer: This analysis is for educational purposes only and does not constitute investment advice. Please do your own research (DYOR) before making any trading decisions.
Technical Picture
Indian Railway Finance Corporation (IRFC) stock rallied from the swing low of 65.75 to an all-time high of 229 in a strong impulsive move. Since then, the stock has entered a corrective phase.
The decline from 229 to 108.04 unfolded as a clear three-wave ABC zigzag.
From 108.04 to 148.95, the rise was overlapping and choppy, best counted as an X wave triangle rather than a fresh impulsive sequence.
The fall from 148.95 to 117.33 looks impulsive and is labelled as Wave A of the Y leg.
The ongoing bounce can be labelled as Wave B, with retracement levels around 124–129 acting as possible resistance.
Once Wave B completes, a Wave C decline is expected to finish Wave Y. This Y leg can either:
terminate near 108.04, forming a double bottom structure, or extend toward the 0.786 retracement of the 65.75–229 rally, around 100.70.
Momentum and Indicators
On the D,2D and Weekly charts, RSI is below the 50 mark, showing weak momentum.
Price remains under the 50, 100, and 200-day moving averages, which are acting as resistances (not plotted here to keep the chart uncluttered).
The invalidation level for this corrective view is 148.95. A break above this level would challenge the corrective structure and point to a new impulsive rally.
Fundamentals
Growth : FY25 sales at Rs 27,152 crore vs Rs 26,645 crore in FY24. Net profit at Rs 6,502 crore vs Rs 6,412 crore. Quarterly profits continue steady.
Cash flows : Operating cash flow improved to Rs 8,229 crore. Net cash flow turned positive at Rs 5,657 crore from negative last year.
Leverage : Debt-to-equity is high at 7.83, with interest coverage at just 1.3x, leaving little buffer.
Returns and margins : Return on equity stands at 12.3%, but margins have narrowed from earlier highs.
Valuation : P/E around 25 and P/B at 3.1 suggest the stock is not cheap given its nature as a financing PSU.
in.tradingview.com
Summary
IRFC appears to be in the final stages of a complex W–X–Y correction. Wave Y is unfolding, and price can either find support near 108.04 to form a double bottom or stretch further toward the 100.70 zone. The 129 area is key resistance for the current B wave bounce, and 148.95 remains the invalidation level.
While the company’s fundamentals are stable with steady sales and profits, the balance sheet remains heavily leveraged, and valuations are not inexpensive. Investors should watch for price action around 108–100 for signs of a structural bottom and confirmation before positioning for the next major trend.

XAU/USD – Gold Under Heavy Pressure, 4,000$ Break Looks ImminentGold continues to slide as the US Dollar strengthens, fueled by resilient US data. With markets waiting for the final week of November and the upcoming FOMC decision, safe-haven flows remain weak—making XAU/USD extremely vulnerable to further downside.
📊 Technical Outlook – H1/H30
The short-term structure remains clearly bearish:
1️⃣ Trend Bias: Bearish
Price keeps rejecting the descending trendline.
Every pullback is shallow and absorbed quickly by intraday supply zones.
2️⃣ Key Technical Levels
Resistance / Supply Zones:
4,078 – 4,089
4,104 (major confluence: Fibo + H1 supply)
Support / Liquidity Targets:
4,023 – 4,013
3,989 – 3,975 → major liquidity zone (high reaction probability)
3️⃣ Scenarios to Watch
🔻 Scenario 1 — Continuation Drop (Primary Bias)
Break below 4,044 → targets 4,023, then the liquidity sweep at 3,99x – 3,97x.
🔄 Scenario 2 — Pullback Before Drop
Retracement to 4,054 – 4,078 → rejection → continuation lower.
🔺 Scenario 3 — Deeper Recovery (Low Probability)
Only valid if price closes above 4,104, unlocking a move toward 4,13x – 4,15x.
🎯 MMF Trading Plan
SELL – Trend-Following (Primary)
Sell Zone 1: 4,054 – 4,078
SL: 4,105
TP: 4,023 → 4,013 → 3,99x
Sell Zone 2: 4,089 – 4,104
SL: 4,112
TP: 4,054 → 4,023
BUY – Only as a Reaction Trade (Liquidity Sweep)
Buy Zone: 3,99x – 3,97x
SL: 3,955
TP: 4,023 → 4,054
⚠️ Buy setups are counter-trend and require strong confirmation.
Primary bias remains SELL as long as price stays below 4,104.
⚜️ MMFLOW TRADING View
Gold is being pushed toward the psychological 4,000$ support.
A clean break could trigger a broader bearish expansion into 3,98x – 3,95x.
With month-end positioning, FOMC expectations, and shifting Fed sentiment, volatility is likely to increase sharply.
Stay with the trend—SELL the rallies. BUY only at deep liquidity zones with confirmation.

Gold Fluctuates in Support Range; Accumulation Signals Rise⏰ Timeframe: 30m
📅 Update: 24/11/2025
🔍 Market Context
After a corrective decline from the 4,104 USD area, gold is moving within a range-bound structure with strong support at the 4,003–4,023 USD area.
The market is in a short-term re-accumulation phase, as consecutive CHoCH movements appear around the bottom area — reflecting the buying side's effort to absorb liquidity.
The selling side temporarily controls, but balancing signals are becoming clearer as the price continuously rejects breaking deeply below the Demand Zone.
📊 Technical Structure
Resistance Zone (4,090–4,104 USD): main supply area, confluence with Fibo 1.0, where profit-taking reactions are likely if the price rebounds.
Support Zone (4,023 USD): intermediate support, playing a key role in the current sideways structure.
Demand Zone (4,003 USD): potential demand area, confluence with previous liquidity bottom – main BUY Zone area.
Structure Bias: still inclined towards accumulation – recovery, as long as the price maintains above 4,003 USD.
🎯 Market Outlook
1️⃣ Priority Scenario (Buy setup):
• The price may continue to retest the Demand Zone (4,003–4,023 USD).
• When a clear reaction signal appears, expect a recovery to the Fibo 0.618 → 1.0 area, corresponding to 4,075–4,104 USD.
2️⃣ Secondary Scenario (Breakdown):
• If the price breaks below 4,003 USD, the recovery structure will be invalidated, bringing gold back to the lower liquidity area around 3,985 USD.
💎 Key Zones
BUY Zone: 4,003 – 4,023 USD
SELL Zone: 4,090 – 4,104 USD
🧠 Analyst’s View
Gold is currently in a liquidity re-accumulation phase, as both sides are testing the lower boundary of the main support area.
The buying side needs confirmation with a break above 4,075 USD, while the selling side still holds the advantage if the price cannot maintain above the balance area.
In the current context, price behavior leans towards the “Sweep – Retest – Expansion” model, with the potential for forming a short-term technical recovery wave.
🛡️ Risk Note
The market is in a low volatility area – avoid emotional actions without clear structural confirmation.

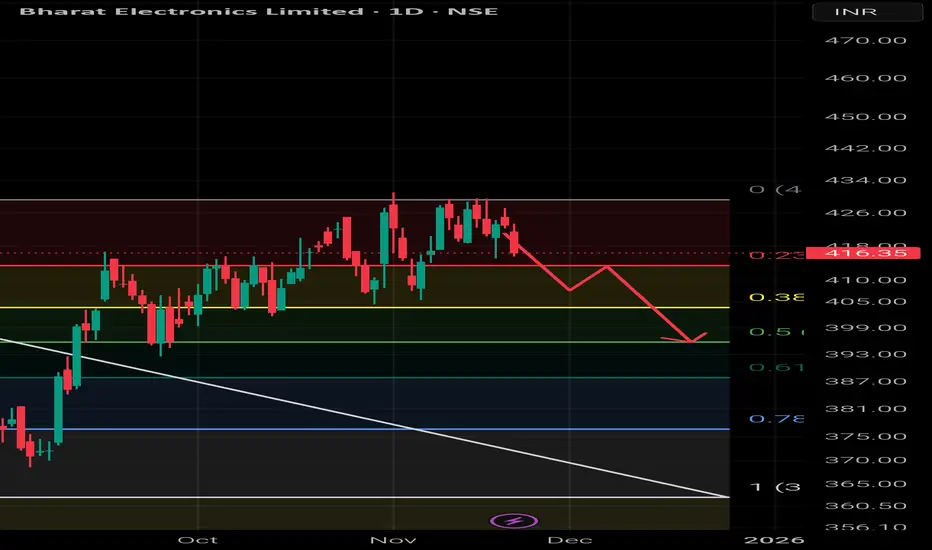
Start of sell Off in BELCan I say I feel bad on missing out on not twice, thrice. I made previous analysis on this and I found that the stock ideally goes down 7-8 % after s down move starts. If we check the RSI the downmove can be confirmed from it.
BSE Ltd TargetsThe Recent expected Targets from BSE Ltd can be set at 3135 and 3438. If the stock hits resistance at this level then the support levels of this stock can be 2710 and 2600. Held this stock even when it hit lows in Aug and Sept as RSI indicated a reversal and it paid off.

Possibility Due To Weak TrendTrend Started Became Weak
I already for daytime frame
this 4h time frame channel breakdown already happened may take support from fib level 0.6 but possible to maybe price come to 0.7 level easily.
Reverse Scenario:
Break his channel high price level
🧠 Always DYOR (Do Your Own Research)
⚖️ This is not financial advice or suggestion
👉 “Risk Is Real 💸 Stay Practical🚀”
💬 Please feel free to ask any questions (It's Free)
BINANCE:STRKUSDT
