Gold Recovers, Targeting FVG & Liquidity Zone 4.20x📊 Market Structure
Gold has completed a deep decline from the 4,20x zone and continuously created bearish BoS, indicating sellers controlled the period from 14–18/11.
However, a significant sign appeared when:
Price created an Order Block at 4,008 USD
Then surged to create a Change of Character (ChoCH) on the H1 timeframe
The market maintained higher lows on the intraday structure
This indicates that selling momentum has weakened, and buyers are starting to rebuild a short-term bullish structure.
Currently, the price is approaching the Supply & Resistance zone at 4,086 USD – the zone confirming the strength of the BUY side.
If the price decisively breaks this zone, the next targets are clear:
FVG 4,150 USD
Liquidity Zone 4,202 USD – where old peak liquidity is concentrated
💎 Key Technical Zones
• Order Block: 4,000 – 4,009 USD → the main reversal zone of the current rally
• Supply & Resistance: 4,078 – 4,086 USD → trend confirmation point
• FVG Zone: 4,132 – 4,150 USD → zone where a corrective reaction may occur
• Liquidity Zone $$$: 4,195 – 4,205 USD → target of large capital flows
🎯 Trading Plan – Prioritize BUY according to structure
1️⃣ BUY Setup – Trend Following
Activated when price breaks and retests the 4,086 USD zone:
Entry: 4,086 – 4,090
SL: 4,058
TP1: 4,132
TP2: 4,150
TP3: 4,202
→ This is the highest probability setup: a new uptrend is forming + retesting the invalidated supply zone.
2️⃣ BUY Setup 2 – Deep Retracement (safer)
If the price is rejected at 4,086 and returns to test the lower zone:
Entry: 4,050 – 4,058 (Premium Zone on chart)
SL: 4,028
TP: 4,086 → 4,132 → 4,150
→ This setup offers a higher R:R, suitable for patient traders.
3️⃣ SELL Scalp – For intraday only
If the price hits FVG 4,150 and shows strong rejection signals:
Entry: 4,148–4,150
SL: 4,160
TP: 4,130 → 4,100
→ Not for swing traders. This is merely a technical reaction at the FVG zone.
🧠 Vincent’s View
The main trend of the day leans towards recovery – expanding towards upper liquidity.
As long as the price remains above 4,008 USD, the BUY side will continue to lead the market.
“Follow the structure, follow the liquidity — the market never lies.” ⚜️
Fibonacci

L&T Technology Services: Correction Complete Near Golden Ratio?After a textbook five-wave impulse from ₹2,924 (2022 low) to ₹6,000 (2024 high), L&T Technology Services appears to have completed a proportional A–B–C correction, finding support precisely near the 0.618 retracement (₹4,099) of the entire advance.
Wave Structure
The advance from the 2022 low unfolded as a clean 5-wave impulse, capped by Wave 5 near ₹6,000.
The subsequent decline subdivides neatly into A–B–C, with Wave C forming a perfect five-wave internal pattern.
Sub-wave (v) of C bottomed around ₹3,951 — just below (iii), confirming structural completion with ideal symmetry.
Fibonacci & Channel Confluence
The decline halted exactly at the 0.618 retracement of the prior impulse — a zone that often attracts buying in post-impulse corrections.
The downward-sloping corrective channel that’s guided Wave C is now flattening, with price repeatedly testing its upper boundary.
A sustained breakout above ~₹4,300–₹4,400 would signal that the market may be transitioning into a new impulsive phase.
Trade Perspective (Educational View)
Scenario 1 – Bullish:
A weekly close above ₹4,400 confirms breakout from the C-wave channel, opening the door toward ₹5,200 → ₹5,650 in subsequent impulsive waves.
Scenario 2 – Extended Correction:
Failure to clear the channel and a close below ₹3,950 would extend the correction toward deeper retracements near ₹3,600 or even ₹3,400.
Summary
L&T Technology Services has now checked every box of a mature corrective phase — Fibonacci alignment, structural symmetry, and wave alternation.
A breakout above the declining channel would be the first real hint that the larger uptrend is ready to resume. Until then, patience beats prediction.
Disclaimer :
This analysis is for educational purposes only and does not constitute investment advice. Please do your own research (DYOR) before making any trading decisions.

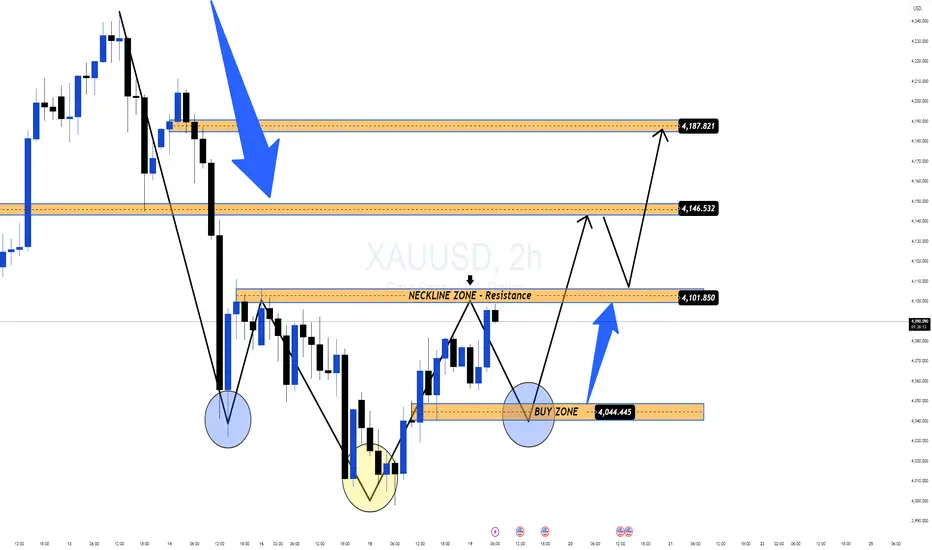
Gold Forms Inverted Head & Shoulders: Reversal Signal!After a short-term corrective decline, the $4,000 level has triggered strong BUY momentum, creating a clear price rebound at the end of yesterday's session. The increase in buying volume indicates that the BUY side is returning to the market after several sessions of being pushed down.
📊 Prominent Technical Structure
On the 2H chart, gold is completing the Inverted Head & Shoulders pattern – one of the strongest bullish reversal patterns.
• Head: liquidity bottom at 4,00x
• Two shoulders: forming symmetrically with good bounce
• Neckline: area 4,101–4,102, currently a key resistance
Price is likely to:
1️⃣ Slightly adjust to the neckline area or BUY ZONE 4,044–4,046
2️⃣ Retest – Accumulate – Confirm breakout
3️⃣ Break out towards 4,146 → 4,187 when the pattern is complete
🎯 Short-term Expectations
Volatility may increase ahead of upcoming economic data, so the reasonable strategy remains:
✅ Prioritize BUY according to the pattern
• Wait for retest of neckline or area 4,044–4,046
• Observe confirmation force (Volume – Momentum – Rejection)
• Target towards 4,146 → 4,187 if the pattern is activated
⚠️ Note
– The reversal trend is only truly confirmed when the price clearly breaks the 4,101–4,102 area.
– Market sentiment currently leans towards recovery, but clear signals are needed before entering large (long-term HOLD) positions.
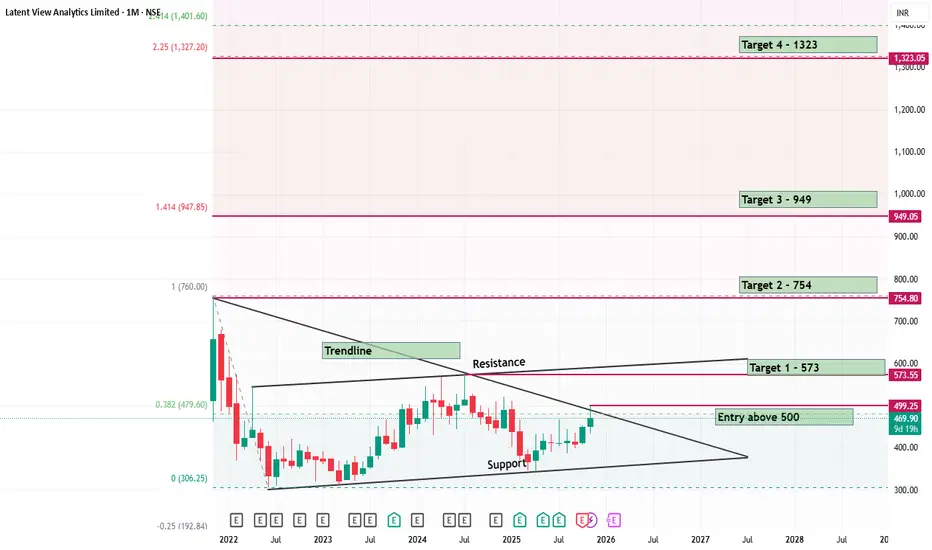
Latent View a Hidden Gem BUY with 2 Years Horizon
BUY LATENT VIEW
BUY ABOVE RS500 AND HOLD FOR 2 YEARS FOR A TARGET OF 1323.
Stock needs to break the upside resistance of Rs 573 with an entry on monthly close above 500.
It will rocket above 754 with is the the all time high.
Plotted the trendline for your understnading.
Below is the companies details. Great Share for Investors with a long time view.
The Company is a global digital analytics firm that inspires and transforms businesses to excel in the digital world by harnessing the power of data and analytics. The Company provides a 360-degree view of the digital consumer, enabling companies to predict new revenue streams, anticipate product trends and popularity, improve customer retention rates and optimize investment decisions. It is a trusted partner to enterprises worldwide, including over 30 Fortune 500 companies in the Retail, CPG, Financial, Technology and Healthcare sectors and has 860 employees in offices in Princeton, N.J., San Jose, California, London, Singapore, and Chennai, India.
The Company launched GenAI solution in FY23. It acquired Decision Point, by making a strategic move to enhance its capabilities in revenue growth management, in the Consumer-Packaged Goods Division (CPG) in 2024.
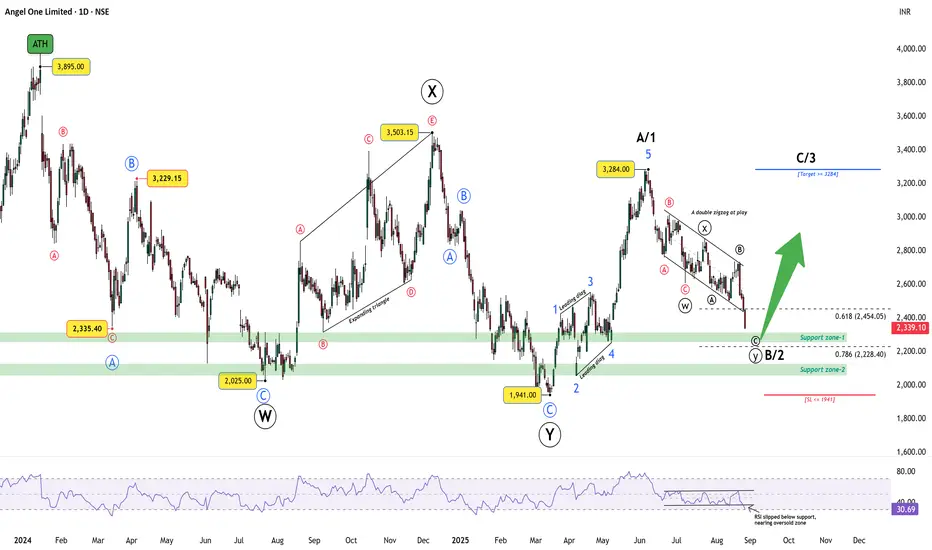
Angel One: Corrective pattern aligning for bounceAngel One topped at an all-time high of 3895 before entering a corrective phase. The decline into 2025 marked Wave W, followed by a rally into 3503 as Wave X, and then a fall to 1941 completing Wave Y. From there, the stock advanced to 3284, counted as Wave A/1 with a leading diagonal.
The decline since 3284 has unfolded as a double zigzag (W–X–Y) within a parallel bearish channel. Wave Y is testing key supports at 2454 (0.618 Fib) and 2228 (0.786 Fib). RSI is near the oversold band around 30, setting up the possibility of bullish divergence if price makes a marginal new low. The bullish view remains valid above 1941; a close below this level invalidates the count.
Trade Plan:
Bias: Expecting Wave B/2 to complete around 2228
Trigger: Watch for bullish divergence or reversal candles near support
Target: A break above 3284 would confirm Wave C/3
Risk: Stop loss at 1941
Disclaimer: This analysis is for educational purposes only and does not constitute investment advice. Please do your own research (DYOR) before making any trading decisions.
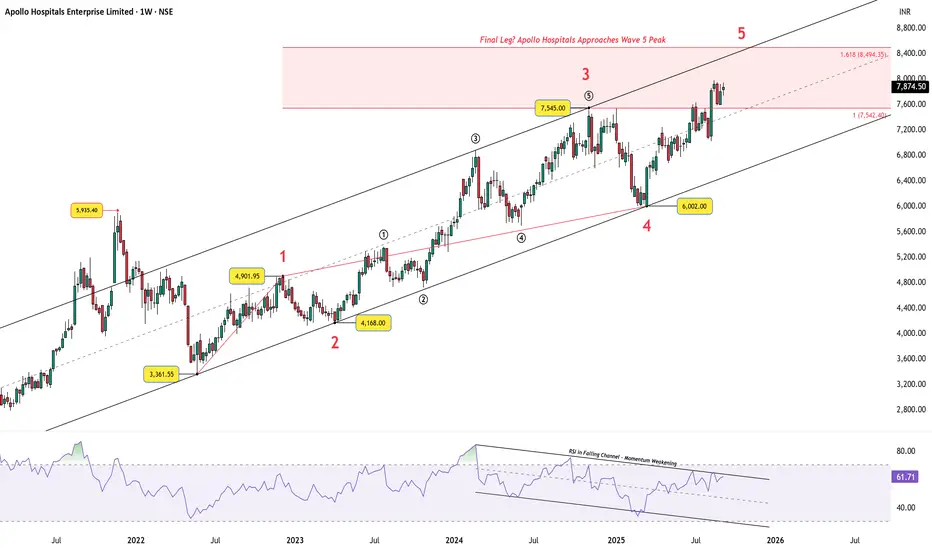
Apollo Hospitals – Wave 5 Approaches Completion at ATH ZoneAfter a strong multi-year uptrend, Apollo Hospitals now trades inside the projected terminal zone of Wave 5. The stock has rallied from its Wave 4 low near ₹6,002 and is advancing toward the Fibonacci cluster between ₹7,542 – ₹8,494, where 1.0x and 1.618x extensions converge.
The long-term channel has guided price action well: Wave 4 respected the lower boundary, and now Wave 5 is pressing near the upper half of the channel.
However, the RSI tells a different story . Momentum has been stuck in a falling channel, even as price climbs higher. This bearish divergence signals exhaustion — a common occurrence when a fifth wave approaches completion.
Key Takeaways:
Wave 5 is nearing its potential terminal zone.
Price resistance sits between ₹7,542 – ₹8,494.
RSI falling channel highlights weakening momentum.
Signs of exhaustion suggest caution at current levels.
Disclaimer: This analysis is for educational purposes only and does not constitute investment advice. Please do your own research (DYOR) before making any trading decisions.
XAU/USD – Rebalancing Structure, Support Zone Holding Steady⏰ Timeframe: 30m
📅 Update: 17/11/2025
🔍 Market Context
After the extended decline late last week, gold is gradually stabilizing around the 4,050–4,080 USD zone, showing a positive reaction at the structural support zone.
The recent Break of Structure (BOS) sequence indicates that the selling momentum is gradually weakening, while the newly formed Order Block is acting as a temporary balance for the market.
The current structure slightly leans towards a technical recovery, as buying flows are returning around the main support zone.
📊 Technical Structure
Support Zone (4,049–4,080 USD): a critical support zone, confluencing with the previous liquidity bottom.
Order Block (4,096–4,115 USD): a short-term supply-demand area, potentially a retest point before the price expands higher.
Resistance Zone (4,145 USD): the first intermediate level to overcome to confirm upward momentum.
Target Zone (4,210 USD): the upper liquidity zone, corresponding to the potential expansion mark of the recovery wave.
🎯 Market Outlook
Priority scenario for the day:
1️⃣ Gold may retest the Order Block zone 4,096–4,115 USD before forming the first push up to 4,145 USD.
2️⃣ If buying pressure is maintained and this resistance zone is broken, the expansion momentum may head towards 4,210 USD, corresponding to a higher liquidity zone.
3️⃣ Losing the 4,049 USD mark will invalidate the recovery structure and bring the market back to a lower balance zone.
🧠 Analyst’s View
The market is currently in a reaccumulation phase after a strong correction.
Buyers still maintain a technical advantage as long as the price remains above the 4,049 USD support zone.
Observing price behavior around the Order Block and the 4,145 USD zone will be key signals to confirm the strength of this recovery wave.
🛡️ Risk Note
The current phase is a “pullback phase” within the larger structure.
Traders should wait for clear price behavior confirmation at technical zones rather than predicting movements in advance.

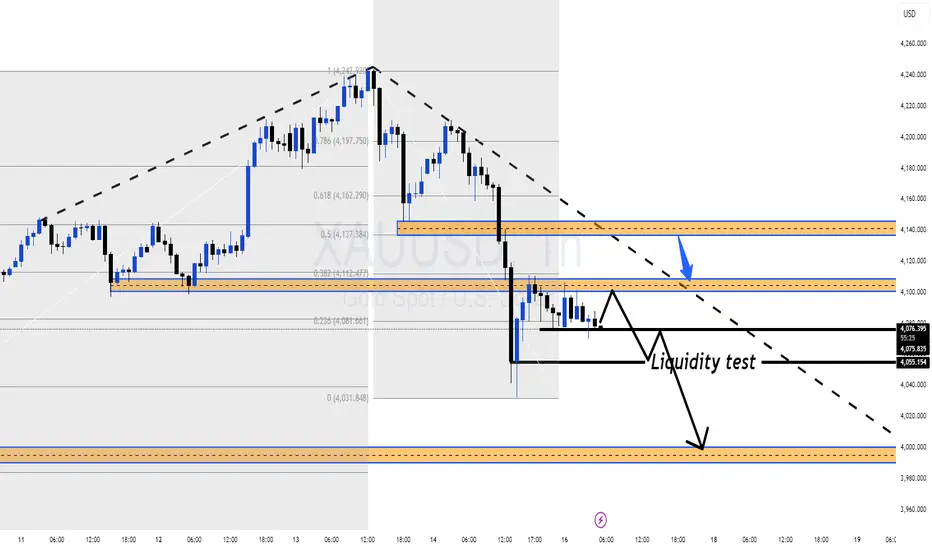
Gold Technical Rebound to FVG, Prioritise WATCHING FOR SELL at 4📊 Market Structure
Gold has completed a strong decline from the peak of 4.21x, leaving consecutive Break of Structure (BoS), confirming a short-term bearish structure.
The drop through the Breakout zone of 4.10x indicates a dominant selling force.
Currently, the price is bouncing from the Premium Zone 4.05x, aligning with the technical rebound behaviour after a strong sell-off.
The BUY side is merely pulling the price back to the abandoned liquidity zones (FVG 4.12x – 4.15x) before the SELL side can regain control.
The upper FVG zone is where the price often returns to fill after a steep fall. This is also the confluence zone between:
FVG (Fair Value Gap)
Old candle body Breaker
Fibonacci Premium
→ The risk of selling at these zones is very high.
💎 Key Technical Zones
Rebound zone for Sell
FVG 1: 4.101 – 4.126
FVG 2 (Strong Confluence): 4.126 – 4.150
Support zone – target to hit
Premium Zone $$$: 4.050 – 4.052
Lower FVG: 4.030 – 4.035
High probability price scenario: Rebound to FVG → reaction → continue to decline to 4.03x.
🎯 Trading Plan – Prioritise SELL
1️⃣ SELL Setup – High Probability
Wait for price to rebound to the above FVG zones:
Entry SELL:
4.118 – 4.126
Can add orders at higher: 4.140 – 4.150
Stop-loss: above 4.158
TP1: 4.101
TP2: 4.050
TP3: 4.030
✔️ This is a trend-following setup, selling at premium, adhering to SMC principles.
✔️ The current price is just beginning the rebound, not yet meeting BUY conditions.
2️⃣ BUY Setup – Only activate on deep Discount
Entry BUY: 4.030 – 4.035 (Lower FVG)
SL: below 4.020
TP: 4.070 – 4.100
→ BUY is only for counter-trend traders and must wait for a clear discount.
🧠 Vincent’s View
The market is in a distribution – decline phase, every rebound aims to pull liquidity.
As long as the price does not close above 4.150, SELL remains the optimal strategy for the day.
Observe closely when the price hits 4.12x – 4.15x, this is a “high-risk” zone for the BUY side and a “great opportunity” for the SELL side.
“Sell where the liquidity lives — that’s where institutions strike.” ⚜️
⏰ Timeframe: 1H
📅 Update: 17/11/2025
✍️ Analysis by: Captain Vincent

Gold Still in Distribution, FOCUS ON SELL Setups at 4,10x–4,14x 🔍 Market Context
Risk sentiment remains fragile as investors reassess the global rate and stimulus story.
Goldman Sachs notes that rising worries about the size of Japan’s fiscal stimulus are bringing financial risk premia back, putting pressure on long-term JGBs and the JPY. Capital tends to rotate into USD and yield-bearing assets in this environment, which limits the upside for gold in the short term.
📊 XAU/USD Technical Structure (H1)
After topping around 4,242 USD, gold broke its short-term uptrend and is now moving in a descending structure.
Price is currently capped below the 0.5–0.382 Fibonacci area around 4,11x, which overlaps with a strong supply / Sell Liquidity zone on the chart.
Below price, we have a series of liquidity / support pockets:
4,098 – 4,077 – 4,048 USD: short-term downside liquidity levels.
OBS BUY ZONE around 4,00x: major demand zone where price previously launched a strong rally.
Current price action shows sellers still in control – every bounce into 4,10x–4,14x is being rejected quickly, which fits a “sell the rally” approach.
🎯 Trend-Following Trade Ideas (for reference)
Zones below are technical areas to watch, not signals or financial advice.
Scenario 1 – Shallow Pullback Sell
Sell Zone 1: 4,102 – 4,104
SL: 4,110
TP levels:
TP1: 4,098
TP2: 4,077
TP3: 4,048
Idea: Price makes a minor intraday pullback into local supply, then resumes selling pressure toward lower liquidity pockets.
Scenario 2 – Deeper Pullback into Fib/Trendline Confluence
Sell Zone 2: 4,142 – 4,144
(confluence of descending trendline + Fibonacci combo)
SL: 4,150
TP levels:
TP1: 4,133
TP2: 4,105
TP3: 4,088
TP4: 4,060
Idea: If the market grabs more upside liquidity first, the 4,14x zone offers a better R:R area to align with the H1 downtrend.
⚜️ MMFLOW TRADING View
As long as price stays below 4,14x and H1 structure keeps printing lower highs, gold remains in a distribution phase.
Pullbacks into the 4,10x–4,14x liquidity band are treated as opportunities to optimize SELL entries, while the 4,00x OBS BUY ZONE is the key area to reassess any potential larger bottoming process.
“In a downtrend, our job isn’t to call the bottom – it’s to use every weak bounce to sell from a better position.”
Higher low formationInfosys took support of the Fib level 0.618 at 1490 and is moving upwards. 1560 becomes an immediate resistance

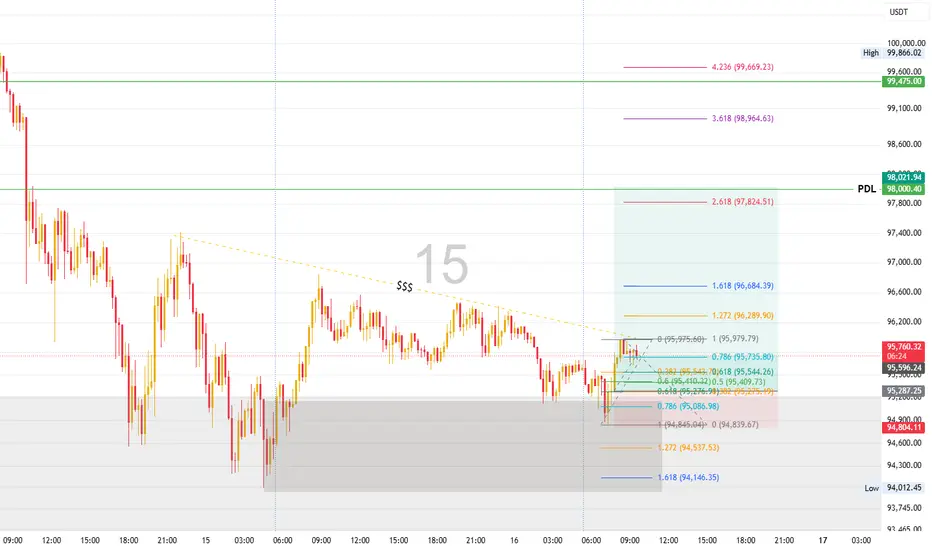
BTCUSD Retest Play: Buying the Dip Toward PDLYesterday BTC failed to tap the Previous Day’s Low (PDL), leaving an untouched liquidity pool below.
Today, price has already formed a liquidity buy zone at 95,665.95, which sits in a premium area.
I’m expecting BTC to potentially test the PDL, so I’m planning to buy on the dip.
📌 Entry: 95,279.63
🛡 Stop Loss: 94,814.54
🎯 Target: PDL 98,000
#BTCUSD
#Bitcoin
#BTC
#Crypto
#CryptoTrading
#LongSetup
#LiquidityGrab
#PDL
#SmartMoney
#PriceAction
#DayTrading
#SwingTrading
#LiquiditySweep
#MarketStructure
#BuyTheDip
#ForexCrypto
#PremiumZone
#OrderFlow
#TechnicalAnalysis
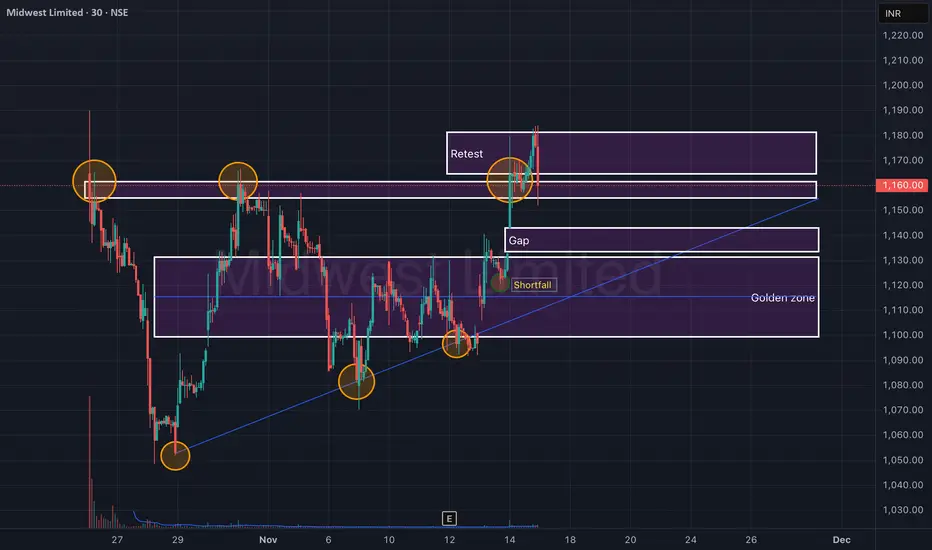
Midwest Ltd – Retest Confirmation After Breakout (30-Min)Midwest Ltd has shown a clean breakout–retest structure on the 30-minute timeframe, respecting both the trendline support and supply zones. The price successfully reclaimed the ₹1,140–₹1,150 range after a short pullback, confirming a bullish retest setup.
The chart highlights how historical rejections (orange circles) have turned into support retests, strengthening the validity of the breakout. If momentum sustains above ₹1,165, a continuation move toward ₹1,180+ could unfold.
🎯 Key Levels:
CMP: ₹1,160 (+3.95%)
Immediate Resistance (Retest Zone): ₹1,165 – ₹1,180
Support / Gap Zone: ₹1,130 – ₹1,145
Golden Zone (Major Support): ₹1,090 – ₹1,115
Stop-Loss: Below ₹1,120 (on 30-min closing basis)
📊 Technical View:
Ascending structure forming higher lows along trendline support.
Gap zone retested successfully, showing demand absorption.
Shortfall recovery followed by a sharp volume rise on breakout.
Sustaining above ₹1,165 may lead to a new swing leg toward ₹1,200.
🧠 View:
Midwest Ltd is showing a textbook breakout–retest structure. Sustaining above ₹1,165 with volume confirmation could trigger a quick 3–4% upside, while ₹1,115 remains the key demand zone.
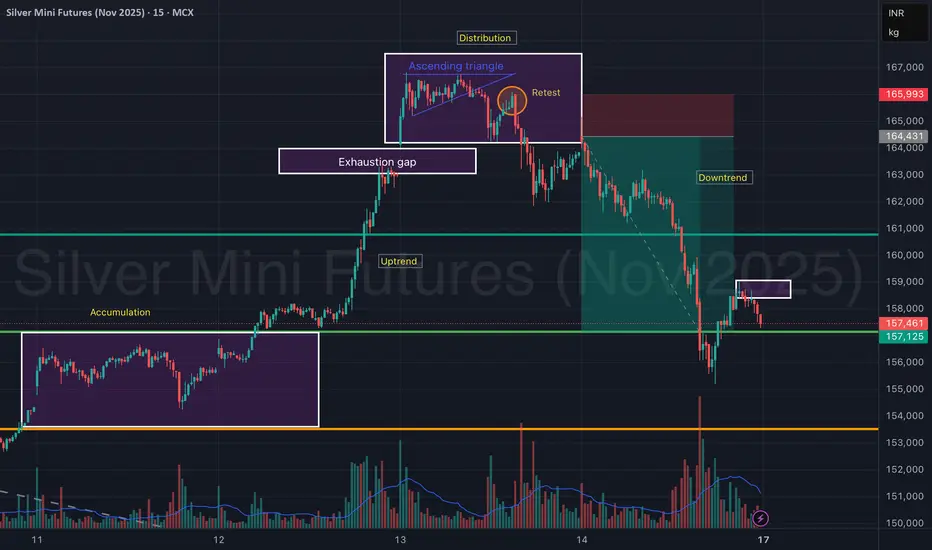
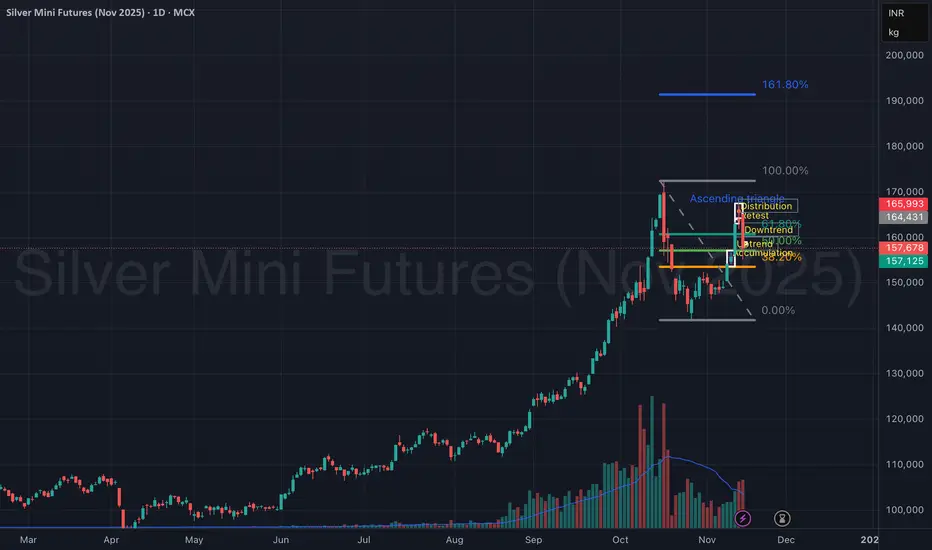
Silver Mini Futures (Nov 2025) – Accumulation to Distribution Silver Mini Futures on the 15-min chart clearly showcases a complete market cycle structure — transitioning from accumulation → uptrend → distribution → downtrend, providing an excellent study in price behavior and volume confirmation.
The move began with accumulation around ₹1,55,000, followed by a strong uptrend breakout, leading to a sharp rally. However, as price entered the ascending triangle near the ₹1,66,000 zone, momentum weakened, signaling distribution.
An exhaustion gap and a failed retest confirmed a reversal, leading to a steep downtrend, which remains active after a minor pullback.
📊 Phase Breakdown:
Accumulation Phase: ₹1,54,800 – ₹1,55,800
Sideways base formation with increasing volume at lows.
Uptrend Phase: Breakout above ₹1,56,000 triggered momentum.
Distribution Phase: Formed an ascending triangle with weak breakout follow-through.
Retest failure at ₹1,65,000 signaled exhaustion.
Downtrend Phase: Sharp decline with heavy volume, currently finding support near ₹1,57,000.
🎯 Key Technical Zones:
Resistance: ₹1,64,400 – ₹1,66,000 (supply zone)
Immediate Resistance (Retest Box): ₹1,58,200 – ₹1,58,800
Support Zone: ₹1,56,800 – ₹1,57,100
Major Support: ₹1,54,500
🧠 View:
Silver Mini Futures is currently in a downtrend continuation phase after a distribution top. A minor retest near ₹1,58,800 could invite short opportunities, while only a sustained move above ₹1,60,000 may signal trend reversal strength.
Silver Mini Futures (Nov 2025) – Accumulation to DistributionSilver Mini Futures on the 15-min chart clearly showcases a complete market cycle structure — transitioning from accumulation → uptrend → distribution → downtrend, providing an excellent study in price behavior and volume confirmation.
The move began with accumulation around ₹1,55,000, followed by a strong uptrend breakout, leading to a sharp rally. However, as price entered the ascending triangle near the ₹1,66,000 zone, momentum weakened, signaling distribution.
An exhaustion gap and a failed retest confirmed a reversal, leading to a steep downtrend, which remains active after a minor pullback.
📊 Phase Breakdown:
Accumulation Phase: ₹1,54,800 – ₹1,55,800
Sideways base formation with increasing volume at lows.
Uptrend Phase: Breakout above ₹1,56,000 triggered momentum.
Distribution Phase: Formed an ascending triangle with weak breakout follow-through.
Retest failure at ₹1,65,000 signaled exhaustion.
Downtrend Phase: Sharp decline with heavy volume, currently finding support near ₹1,57,000.
🎯 Key Technical Zones:
Resistance: ₹1,64,400 – ₹1,66,000 (supply zone)
Immediate Resistance (Retest Box): ₹1,58,200 – ₹1,58,800
Support Zone: ₹1,56,800 – ₹1,57,100
Major Support: ₹1,54,500
🧠 View:
Silver Mini Futures is currently in a downtrend continuation phase after a distribution top. A minor retest near ₹1,58,800 could invite short opportunities, while only a sustained move above ₹1,60,000 may signal trend reversal strength.
MARUTI, DARVAS BOX BREAKOUTBUY MARUTI 13400 TILL 13100 for 13650/14200 in short term. Clear Darvas box breakout happening with volumes. Stock after multi year breakout above 10000 is now heading towards 18500 as medium term investment bet (Fibonacci extension levels)

Gold Near Breakout Point — The Next Move Will Be BigGold is holding firmly inside a tight compression zone, and the market is signalling that a major breakout is loading. Despite yesterday’s pullback, buyers defended key demand levels, showing that bullish momentum is still alive as we approach the weekend session.
📊 Technical Outlook (H1)
Price is currently moving inside a symmetrical triangle, with volatility compressing and liquidity building on both sides.
Key observations from MMFlow structure:
• Zone 1 – Support (Potential Reversal Area)
4,174 – 4,159
→ Strong confluence of trendline support + Fibonacci 38.2% + liquidity sweep potential.
→ If price taps this zone, it's a high-probability long setup.
• Zone 2 – Resistance / Breakout Line
4,207 – 4,212
→ This is the key breakout ceiling.
→ A clean break and retest opens the door toward the next expansion wave.
• Measured Move Target (MMF Expansion Target)
4,244 – 4,252
→ Aligns with Fib 1.618 extension and previous liquidity pocket.
🎯 Trading Scenarios (MMFlow Style)
🟢 BUY Scenario (Primary Bias)
Buy Zone 1: 4,174 – 4,159
SL: below 4,150
TP: 4,205 → 4,212 → 4,228 → 4,244+
Why?
This zone carries the strongest confluence for a bullish reaction before the breakout. Ideal spot for Market Makers to reload.
🔵 BUY Scenario 2 (Break & Retest)
Trigger: Break above 4,207 – 4,212
Entry: Retest of 4,207
SL: below retest wick
TP: 4,228 → 4,244 → 4,252
Why?
Breakout from triangle compression usually leads to fast displacement toward untested liquidity highs.
🔴 SELL Scenario (Short-Term Only — Not Preferred)
Only valid if price fails to break 4,207 and forms a clear rejection.
Entry: 4,207 – 4,212
SL: above 4,220
TP: 4,174 → 4,159
Note: This is a counter-trend micro-play. Primary bias remains bullish.
🧠 MMFlow Insight
The market has been accumulating for multiple sessions, and every dip into demand is being bought aggressively. As long as price stays above 4,159, the bullish structure is intact. A breakout above 4,212 could be the ignition point for the next impulsive expansion toward 4,244 – 4,252.

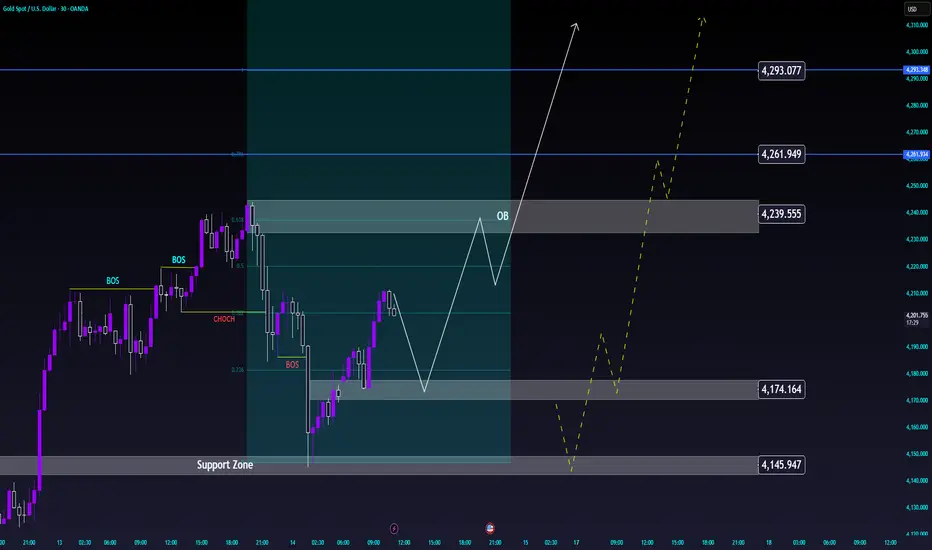
Gold Technical Retracement Before Continuing Main Uptrend⏰ Timeframe: 30m
📅 Update: 11/14/2025
🔍 Market Context
After establishing a short-term peak around 4,239 USD, gold is undergoing a technical retracement to rebalance its structure.
The most recent decline formed a Break of Structure (BOS), but the Support Zone around 4,145–4,174 USD continues to serve as a foundation for the medium-term uptrend.
The current price structure indicates the market is re-accumulating momentum before expanding again.
📊 Technical Structure
Order Block (4,239 USD): a short-term resistance zone where the price may react slightly before continuing upward.
Support Zone (4,145–4,174 USD): a confluence zone with Fibo 0.236–0.382, playing a balancing role in the current cycle.
Liquidity Targets:
• 4,261 USD – intermediate liquidity zone.
• 4,293 USD – main expansion target if the uptrend is maintained.
🎯 Market Outlook
High probability scenario:
1️⃣ The price may retrace to the Support Zone or form a higher low around 4,174 USD, then recover to the OB zone at 4,239 USD.
2️⃣ If the uptrend structure breaks, the market may test deeper towards 4,145 USD before bouncing back.
As long as the price holds above this support zone, the primary trend remains bullish continuation.
🧠 Analyst’s View
This is a phase of market re-accumulation after a rapid increase.
Maintaining a higher low structure will be a confirmation signal for the next expansion phase towards 4,261–4,293 USD.
Buyers are still controlling the cash flow, while sellers mainly participate in the short-term resistance zone.
🛡️ Risk Note
The market is in a slight correction phase – avoid impulsive actions when the price has not completed the accumulation zone.
Gold Maintains Bullish Structure, Prepares for New ExpansionWave⏰ Timeframe: 30m
📅 Update: 11/13/2025
🔍 Market Context
After a short correction at the start of the week, gold has clearly formed a Break of Structure (BOS) on the 30-minute chart, indicating that bullish momentum has returned.
This morning's Asian session witnessed a strong recovery from the Support Zone, confirming that buying pressure remains dominant in the current structure.
The market is approaching the “expansion phase” – where prices typically expand to seek liquidity above.
📊 Technical Structure
Order Block 1 (4,208 USD): a short-term support area, likely to serve as a retest point after the expansion move.
Order Block 2 (4,184 USD): confluence of Fibonacci 0.5–0.618, a deep equilibrium zone within the bullish structure.
Support Zone: the main foundation of the medium-term uptrend, still being preserved.
Extension Levels:
• 4,249 USD → first expansion target.
• 4,267 USD → intermediate liquidity zone.
• 4,292 USD → maximum expansion target within the current cycle.
🎯 Market Outlook
Today's scenario leans towards a continuation bullish direction:
1️⃣ Price may technically correct to the OB 4,208 or 4,184 USD area.
2️⃣ Upon a bullish reaction, the market is likely to expand to 4,267 – 4,292 USD, where short-term selling liquidity is concentrated.
3️⃣ Losing the 4,184 USD level will temporarily shift the structure to rebalancing (sideways).
🧠 Analyst’s View
Gold is in the “expansion reaccumulation” phase, meaning after attracting liquidity below, prices begin to expand following the main trend.
Continuous BOS signals indicate that buyers are reasserting control.
As long as prices remain above the 4,184 USD area, the intraday bias remains predominantly bullish.
🛡️ Risk Note
The market is expanding rapidly, so pullback reactions to the OB area may be highly volatile.
Let your trade ideas run and let's observe together.

Gold Maintains Uptrend, Watch for Pullback to Buy with Cash Flow🔍 Context & Market Structure
After a strong upward impulse from a low liquidity area, the price has broken the downtrend structure and formed a bullish BoS on H1.
Currently, gold is accumulating above the Support Zone at 4,183 USD after creating a new peak and leaving a FVG just below the current price .
Above is the Liquidity Zone $$$ around 4,232 USD – a concentration of sell-side stop losses and buy-side profit-taking orders, likely to create a “final push” that attracts liquidity.
=> Overall: the main trend remains bullish , prioritising waiting for a pullback to discount levels to buy with the trend rather than chasing orders at high levels.
💎 Key Technical Zones
Liquidity Zone $$$: around 4,232 USD – upper liquidity area, prone to profit-taking reactions.
Current FVG: price gap area just below the current price (around 4.20x) – expected to “fill the gap” before continuing.
Support Zone 1: 4,183 USD – nearest support, confluence with the area where the upward impulse began to slow.
Support Zone 2: 4,140 USD – stronger support, aligning with the old structure.
Liquidity Clear: 4,101 USD – lower liquidity area, if swept, it would be a very attractive discount for swing buyers.
📈 Proposed Trading Scenarios
1️⃣ Main Scenario – Buy with the trend at FVG / 4,183 USD
Priority to wait for the price to:
Either fill the FVG around 4.20x and show a rejection candle,
Or clearly retest Support 4,183 USD with a bullish reversal signal on M15–H1.
When a confirmation signal appears:
→ Consider buying (BUY) around 4.19x – 4.18x .
Stoploss: below 4,175 USD (below the nearest low and support).
TP reference:
TP1: 4,210 USD
TP2: 4,232 USD (Liquidity Zone $$$)
TP3: trailing if the price breaks through 4,232 and maintains the bullish structure.
2️⃣ Alternative Scenario – Deeper Pullback Before Continuing Upward
If the price clearly breaks 4,183 USD and closes an H1 candle below:
→ Avoid buying hastily, wait for the price to continue adjusting to Support 4,140 USD or even Liquidity Clear 4,101 USD .
At these zones, if there appears:
strong rejection candles,
or small reversal structures (bullish ChoCH on M15),
→ Then consider buying at a discount with better RR, targeting a return to 4,183 → 4,210 → 4,232 USD.
3️⃣ Short-term Sell Scenario (for experienced scalpers only)
If the price hits Liquidity Zone 4,232 USD but shows strong rejection (long wick, high sell volume):
→ Consider short-term sell scalp back to the 4.20x – 4,183 USD area.
This is a counter-trend trade, so:
keep the volume small,
short TP,
tight SL above the newly formed peak.
⚠️ Risk Management Notes
Do not FOMO buy when the price is testing near the 4.23x area – this is a prone-to-sell area.
Prioritise waiting for a pullback to FVG / Support for a better entry point and RR.
Always adjust volume according to actual SL, avoid over-leverage during strong market volatility.
“Buy the dip in liquidity zones, do not chase orders at the peak – that's how to go with the big money flow.”

Bharat Dynamics Ltd – Symmetrical Triangle Breakout on Watch (D)Bharat Dynamics is currently trading near a key breakout point of a symmetrical triangle pattern on the daily chart. After a prolonged downtrend, the stock has entered a consolidation phase, forming higher lows and compressing price action — a setup that often leads to a strong directional move.
Bharat Dynamics Q2 Results
✅ Net Profit: ₹216 Cr vs ₹123 Cr (YoY) — 🔼 up 75.5%
✅ Revenue: ₹1,147 Cr vs ₹545 Cr (YoY) — 🚀 strong growth
✅ EBITDA: ₹188 Cr vs ₹98.8 Cr (YoY) — 🔼 up 89.4%
✅ EBITDA Margin: 16.4% vs 18.1% (YoY) — 🔽 slight dip
The price has reclaimed the ₹1,500–₹1,530 zone, and a sustained close above ₹1,550 could confirm a breakout, opening the path for a quick momentum rally toward ₹1,650 and beyond.
🎯 Key Levels:
CMP: ₹1,525.70 (−0.95%)
Breakout Zone: ₹1,550 – ₹1,560
Target 1: ₹1,650 – ₹1,670
Target 2: ₹1,710 – ₹1,740
Resistance: ₹1,950 – ₹2,000
Stop-Loss: ₹1,470 (on daily close basis)
📊 Technical View:
Symmetrical triangle pattern forming after a prolonged correction.
Price compression with reduced volume indicates breakout buildup.
Breakout confirmation expected above ₹1,560 with increasing volume.
If sustained, the move could extend toward the higher resistance zone around ₹1,950+.
🧠 View:
Bharat Dynamics is at a decisive point — a breakout above ₹1,550–₹1,560 with volume can mark the start of a short-term uptrend. Keep an eye on price action near this level for confirmation.

ETH - 2 hour chart - Trend based Fibonacci Retracement Price took strong support from the green demand zone and bounced, starting a fresh upward move. This rally reached the Fibonacci 0.618–0.786 zone, where price faced resistance and started a pullback. During this pullback, a falling trendline formed, showing short-term selling pressure. Now price is moving between the 0.236 and 0.382 Fibonacci levels and is again testing the trendline from below. If price gives a clean breakout above this falling trendline and holds, it can continue its upward move toward higher Fibonacci levels. If the breakout fails, price may retest lower Fibonacci areas or even move back toward the support zone.
Entry: Buy on trendline breakout and retest around 3530–3550
Stop Loss: Below recent swing and Fibonacci 0.236 zone around 3450–3470
Targets:
• First target near 0.382 zone around 3600
• Second target near 0.5 zone around 3680
• Final target near 0.618–0.786 zone around 3750–3850
Disclaimer: This analysis is for educational purposes only and not financial advice. Always do your own research before trading or investing.

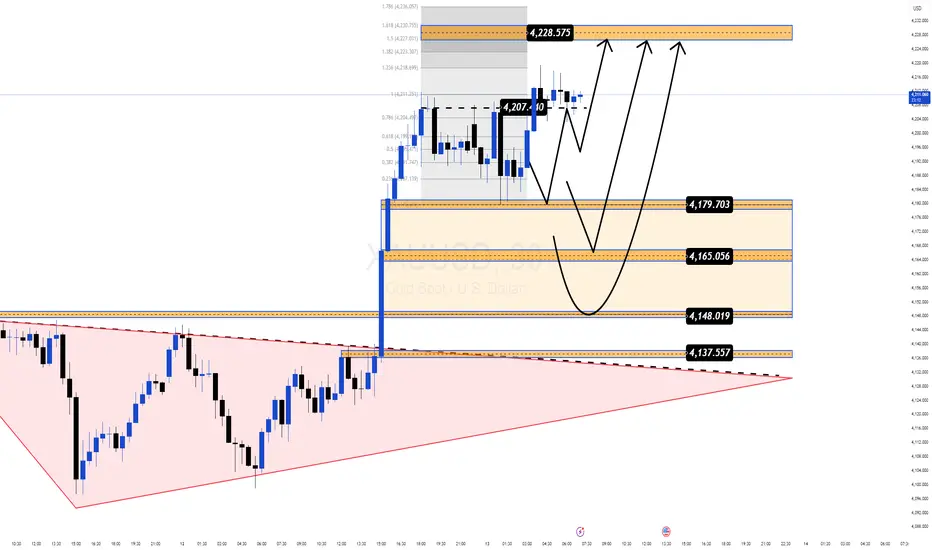
Gold Hits a 3 Week High but the Real Move Might Still Be LoadingGold just tapped $4,213 — the highest level in three weeks, powered by growing expectations of a dovish Fed and optimism around the potential reopening of the US government.
But the real story isn’t the headline spike — it’s the structure forming right beneath it.
📌 Why this zone matters right now
Price is pulling back into $4,179–$4,165, a clean Demand zone aligning with Fibo + breakout structure.
Buyers remain firmly in control despite a mild USD recovery.
The market swept liquidity around $4,207, hinting at accumulation before the next expansion.
The broader pattern resembles a falling-wedge breakout, often appearing before strong upside continuation phases.
🎯 Most Probable Scenario (Mind Insight)
Gold is in a “compression before expansion” phase.
Once this squeeze resolves, momentum is likely to continue in the direction that’s already dominant — and right now, that’s the bulls.
🔶 MMF BUY Zone
$4,179 → $4,165
Looking for a shallow pullback before the next leg.
🔼 Bullish Targets
• $4,207 (liquidity tap)
• $4,228 (Fibo 1.618)
• $4,236 (Fibo 1.786 — major reaction zone)
🧠 Key Takeaway
As long as Gold holds above $4,165, the bullish structure remains intact and the upside expansion toward the upper Fibo cluster stays in play.
XAU/USD – Price Accumulating in a Narrow Range, Ready to Expand⏰ Timeframe: 30m
📅 Update: 11/12/2025
🔍 Market Context
Gold maintains a neutral structure after forming a Change of Character (CHoCH) around the 4,144 USD area.
Yesterday's session witnessed a narrow fluctuation between the Demand Zone – Support Zone, indicating the market is absorbing liquidity before determining the next direction.
The medium-term upward momentum remains unbroken, but the price needs a clear balancing phase before continuation.
📊 Technical Structure
Demand Zone (4,144 USD): a short-term supply – demand area where the market previously reacted strongly, now becoming a potential testing zone.
Support Zone (4,099 USD): confluence structure – an area where buying flows may return when the price retests.
Order Block (4,081 USD): a deep defensive zone, corresponding to the main Discount area in the current cycle.
Equal Lows (EQL) & CHoCH: indicate a short-term transition between two sides, but the overall bias slightly leans towards an increase.
🎯 Market Outlook
High probability scenario for the day:
1️⃣ Price may fluctuate within the 4,099–4,144 USD balance zone to attract liquidity.
2️⃣ If a strong reaction occurs from the Support Zone or Order Block, gold may establish a new upward move towards 4,165–4,180 USD.
3️⃣ Conversely, if the price closes below 4,081 USD, the short-term structure will temporarily shift to neutral, prioritizing a re-accumulation phase.
🧠 Analyst’s View
Current price behavior reflects a “pause phase” in the larger upward structure.
When the market balances at lower levels, the key observation is not the bounce, but the reaction when liquidity is swept — where the true momentum of the trend is reignited.
As long as the price does not break the 4,081 USD mark, the medium-term upward trend remains intact.
🛡️ Risk Note
This is a technical analysis, not investment advice.
The market can change rapidly during US sessions – wait for clear confirmation from price action before participating.
