Gold Rebuilds Structure Above $3940, Eyeing $4030 Liquidity Pool🔍 Market Context
Gold is attempting to regain bullish momentum as safe-haven demand remains supported by rising geopolitical tensions and uncertainty around the upcoming US ADP employment data.
The market continues to oscillate between risk aversion and rate expectations — with the Fed’s hawkish tone keeping the Dollar capped but steady.
At the same time, capital flow rotation from equities into defensive assets is quietly supporting the metal’s structural recovery, with gold holding above key liquidity levels despite intraday volatility.
📊 Technical Analysis (H1–H4)
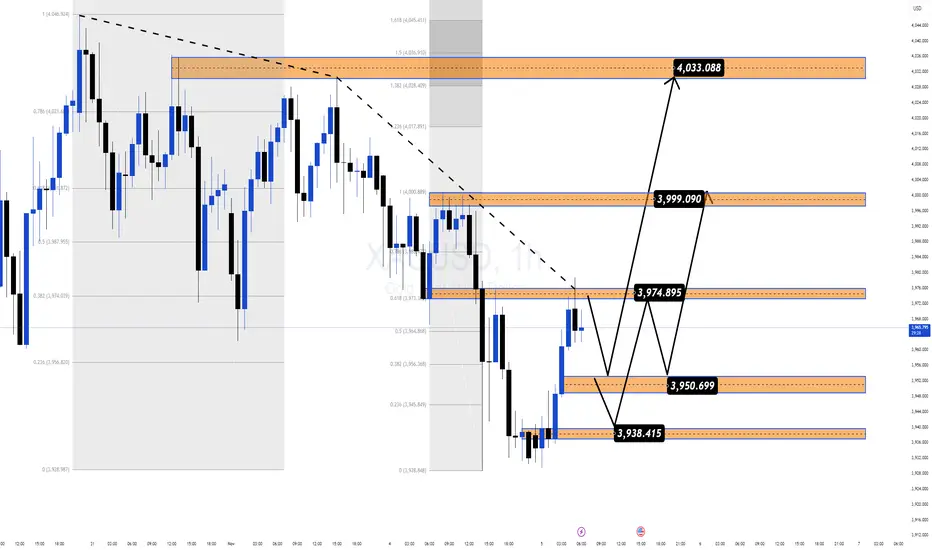
After forming a double-bottom structure near $3,938, XAU/USD has reclaimed the 38.2% retracement zone (3,974–3,975) from its previous bearish leg.
This area now acts as a pivot zone, separating short-term bullish continuation from potential retracement.
The chart reveals a classic liquidity cycle shift:
Phase 1: Sweep of downside liquidity below 3,930, marking an internal structural low.
Phase 2: Expansion leg reclaiming short-term FVGs, signaling a potential smart money accumulation phase.
Phase 3: Repricing toward upper liquidity targets aligned with Fibonacci extensions.
Key Technical Zones:
• 💎 Liquidity Base: 3,938 – 3,950 (recent demand re-entry area)
• 🎯 Rejection Zone 1: 3,974 – 3,999 (previous inefficiency block)
• ⚙️ Target Zone: 4,033 – 4,045 (1.272–1.618 Fibo extensions, liquidity pool)
• ⚠️ Invalidation: Break below 3,920 would shift structure back to distribution.
🎯 MMFLOW Scenario
If gold sustains above the 3,950 support cluster, buyers are likely to extend the retracement toward 3,999–4,033 where resting liquidity sits.
A clean rejection from 4,000 could trigger an intraday pullback — but as long as price holds above the 3,938 OB base, the bullish recovery structure remains intact.
The short-term narrative favors controlled accumulation, suggesting that smart money is building positions into liquidity zones before the next impulsive move.
⚜️ MMFLOW Insight:
“Liquidity isn’t random — it’s engineered. Every move leaves a footprint, and gold is tracing its next one above $3,950.”
Fibonacci
Accumulated Gold on Support, 3,952 USD is the Gateway for a New 🔍 Market Context
Gold is oscillating within a symmetrical triangle pattern , reflecting price compression and waiting for a breakout signal.
Buyers still maintain a short-term bullish structure, but the series of lower highs indicates increasing selling pressure.
The zone 3,959–3,964 USD is currently the “balance point” — if this area is breached, the downtrend may extend to the lower liquidity zone around 3,929–3,921 USD .
💎 Key Technical Zones
• Resistance Zone: 4,020 – 4,040 USD → the main resistance of the triangle, where strong reactions are likely.
• Support Zone: 3,959 – 3,964 USD → the support zone maintaining the bullish structure.
• Liquidity Zone: 3,929 – 3,921 USD → a low liquidity zone, potentially attracting price sweeps before reversing.
🎯 Trading Scenarios
1️⃣ BUY Setup – Preferred when price holds above support
• Entry: 3,959 – 3,964 USD
• Stop Loss: 3,940 USD
• Take Profit:
– TP1: 3,985
– TP2: 4,020
– TP3: 4,040
– TP4: 4,096
✳️ “Buy the discount” – Buy at the trendline support zone when a confirmation signal appears (rejection or bullish ChoCH).
2️⃣ SELL Setup – Scenario if support breaks
• Entry: 3,950 – 3,955 USD (after closing a candle below the support zone)
• Stop Loss: 3,970 USD
• Take Profit:
– TP1: 3,935
– TP2: 3,925
– TP3: 3,912
✳️ “Sell the breakdown” – Sell when support is clearly breached, targeting the lowest liquidity zone (3,912 USD).
💬 Summary
Gold is in a phase of accumulation before a major move .
If it holds above 3,952 USD → prioritize BUY according to the bullish structure .
If it breaks below 3,952 USD → SELL according to the breakout towards the Liquidity Zone.
The scenario will be clearly confirmed when the current symmetrical triangle is broken.
💡 Today's Tagline:
“Liquidity defines direction — follow where the money hides.”
⏰ Timeframe: 1H
📅 Update: 04/11/2025
✍️ Analysis by: Captain Vincent

Fibonacci in Action – A Lesson from J.K. CementFibonacci retracement is one of the simplest yet most consistent tools for studying how markets correct within trends.
To understand it better, here’s a clean example from J.K. Cement .
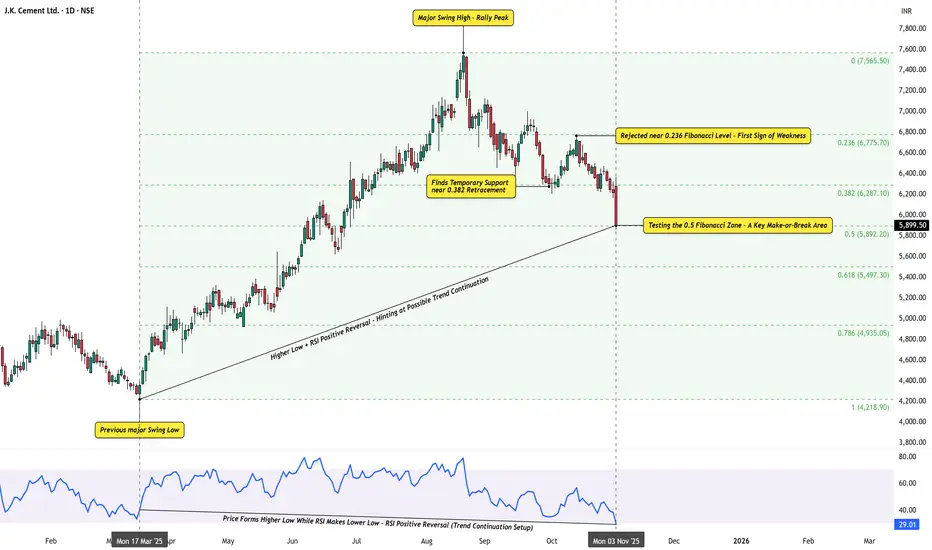
After a strong uptrend from the March 2025 swing low to ₹7,565 , the stock began to retrace. Notice how price behavior respected the Fibonacci structure:
It bounced from the 0.382 level , illustrating a temporary reaction point.
Later, it faced resistance near 0.236 , where rallies often stall during corrective phases.
The 0.5 retracement zone now serves as a classic testing ground that often helps define trend continuation or deeper correction.
Even the RSI pattern offers insight — price forms a higher low while RSI makes a lower low, a textbook positive reversal setup that often aligns with trend studies.
The purpose of this example isn’t prediction, but to show how Fibonacci ratios and RSI behavior interact — highlighting rhythm, structure, and market psychology in motion.
Disclaimer: This analysis is for educational purposes only and does not constitute investment advice. Please do your own research (DYOR) before making any trading decisions.
Bharat Forge Ltd – Flat in Formation, Bulls Still in Command
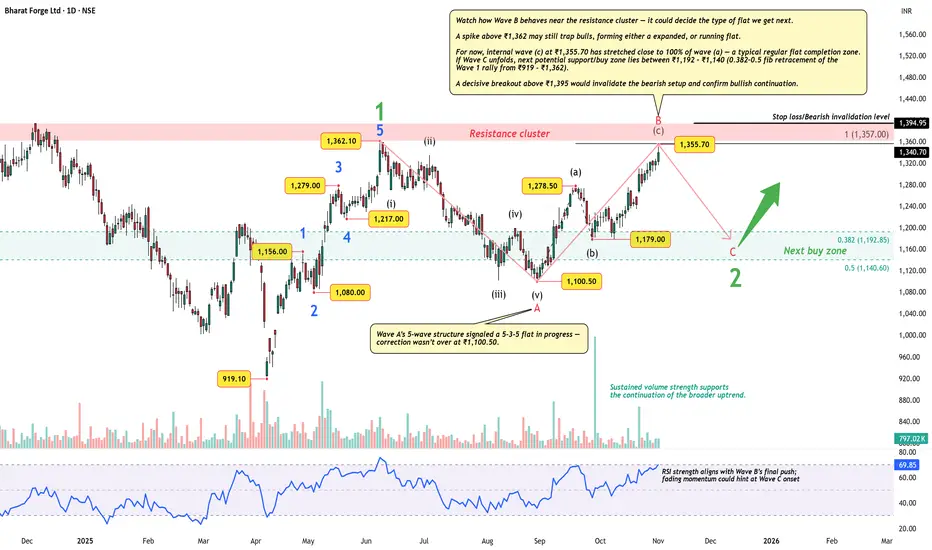
The impulse from ₹919 - ₹1,362 looks complete, and price is now likely carving a 5-3-5 flat correction as Wave 2.
Wave B has already stretched to the prior Wave 1 peak, keeping regular , expanded , and running flat options open.
Wave C could retrace toward ₹1,192 – ₹1,140 — the 0.382-0.5 fib zone — before the broader uptrend resumes.
Sustained volume and RSI momentum continue to support the larger bullish structure.
A breakout above ₹1,395 invalidates the bearish setup.
Disclaimer: This analysis is for educational purposes only and does not constitute investment advice. Please do your own research (DYOR) before making any trading decisions.
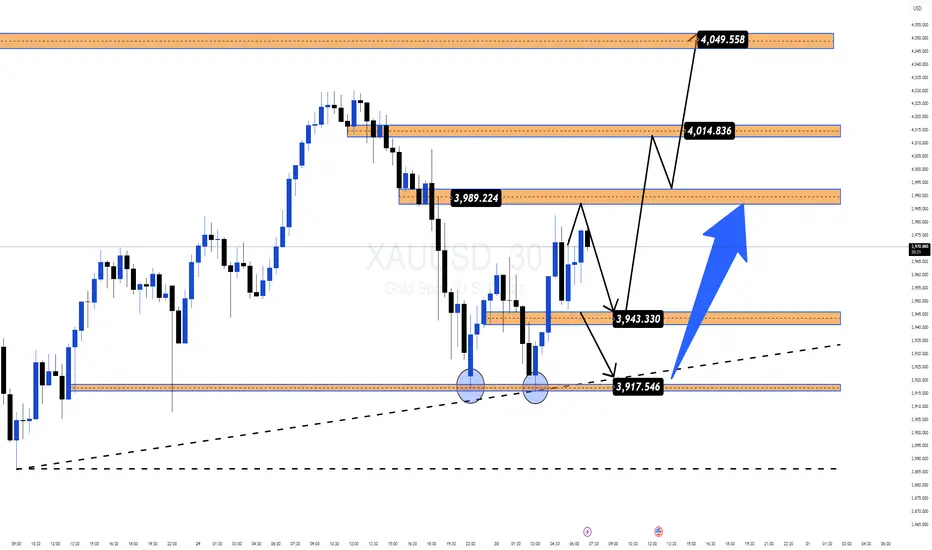
XAU/USD – Gold Accumulating Before Breakout, Target 4,096 USD🔍 Market Context
Gold is trading within a symmetrical triangle pattern , indicating short-term accumulation before forming a new breakout wave.
Following a sharp decline from the peak region of 4,096 USD, the market has shown two instances of Change of Character (ChoCH) – early signs of buying pressure returning.
As long as the price holds above the 3,959 – 3,917 USD zone, the short-term bullish structure remains intact. This support zone acts as a crucial “discount zone” in the current accumulation cycle.
💎 Key Technical Zones
• Support Zone 1: 3,959 USD → main structure holding zone, coinciding with the lower trendline.
• Support Zone 2: 3,917 USD → final liquidity reaction zone.
• Resistance Zone: 4,040 USD → potential break & retest zone.
• Liquidity Zone: 4,096 USD → expansion target if the peak is breached.
🎯 Trading Scenarios
1️⃣ BUY Setup – Prioritise bullish structure
• Entry: 3,959 – 3,917 USD
• Stop Loss: 3,905 USD
• Take Profit:
– TP1: 3,985
– TP2: 4,040
– TP3: 4,072
– TP4: 4,096
✳️ “Buy the discount” – prioritise buy orders at the confluence support zone of trendline + FVG to follow the SMC flow.
2️⃣ SELL Scalp – Secondary strategy when price reacts at the peak
• Entry: 4,096 USD
• Stop Loss: 4,108 USD
• Take Profit:
– TP1: 4,072
– TP2: 4,040
– TP3: 3,985
✳️ “Sell the premium” – only activate if there is a strong price rejection signal at the liquidity peak.
💬 Summary
The short-term trend of gold remains bullish as the price stays above the trendline and continuously forms higher lows.
The main strategy is buy the dip – sell reaction around the 3,959 → 4,096 USD zone.
The confirmation of a strong uptrend will be when the price closes steadily above 4,040 USD .
“Smart money accumulates in silence before the market makes noise.”
⏰ Time Frame: 1H
📅 Update: 03/11/2025
✍️ Analysis by: Captain Vincent

Sun Pharma trades sideways within a defined rangeTopic Statement:
Sun Pharma has remained in a sideways zone throughout the year, presenting recurring opportunities for accumulation at key technical levels.
Key Points:
1. The stock is rangebound between 1550 and 1800, with no clear breakout direction so far
2. It consistently takes strong support at the 23.6% Fibonacci retracement level at 1568
3. The stock can be accumulated when it dips below the 50-day EMA, with heavier investment opportunities when it falls below the 200-day EMA

Sona BLW Precision Forgings Ltd. (SONACOMS) — pullback setup(SONACOMS) — Bullish Pullback Setup
📅 Timeframe: 1D | 💰 CMP: ₹472.75 | 📈 Volume: Above average
Technical View
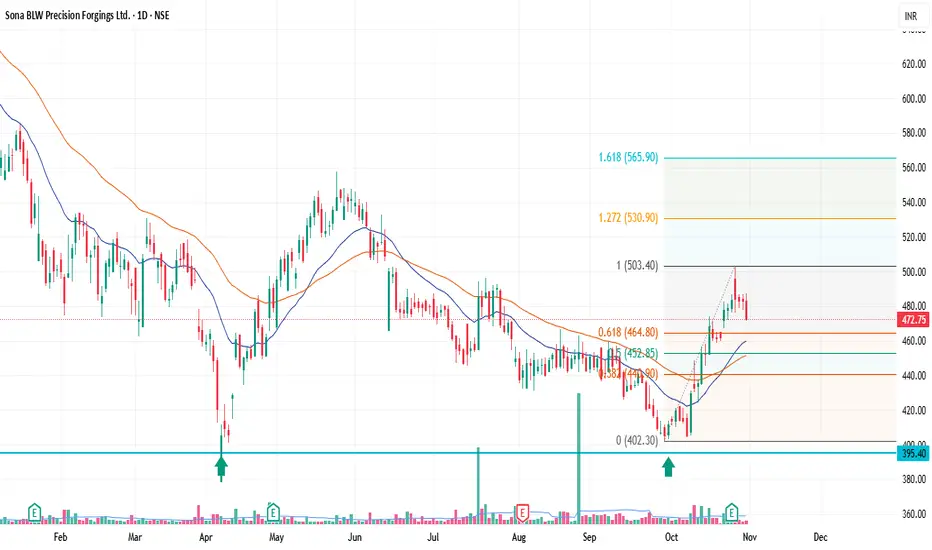
Sona BLW has completed a strong impulse wave from ₹402 → ₹503, followed by a healthy pullback.
Price is now retracing near the 0.618 Fib level (₹464.8), aligning with the 21EMA — a zone that often acts as support during trend continuation.
Volume on the breakout was strong, showing accumulation interest.
Trade Plan
Entry Zone: ₹465–₹470
Stop Loss: ₹450 (below 0.5 Fib and 20EMA)
Targets:
🎯 T1: ₹503
🎯 T2: ₹530 (Fib 1.272)
🎯 T3: ₹566 (Fib 1.618)
Summary
✅ Uptrend resumption likely if ₹450 holds
✅ Rising 21EMA & 50EMA support the structure
✅ Strong breakout volume confirms institutional buying
Bias: Bullish
Risk–Reward: ~1:2.5+
Invalidation: Close below ₹450
Disclaimer : Risk management is crucial in this volatile market, so keep position sizing appropriate. This analysis is intended for educational purposes and not financial advice.
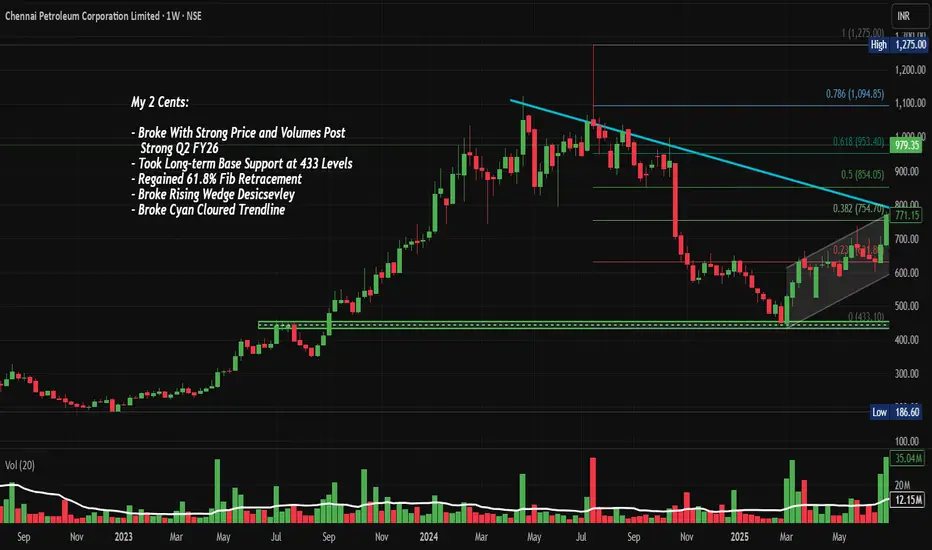
ChennaiPetro: Wedge & Trendline BO with 61.8%, Chart of the WeekNSE:CHENNPETRO Explosive Breakout: Why This Refinery Stock Could Rally Another 30% After Its Q2 Turnaround. This PSU Refinery Stock Broke Through ₹979 Levels - Here's What Traders Need to Know About the Next Move. Let's Analyse in our Chart of the Week Below.
As per the Latest SEBI Mandate, this isn't a Trading/Investment RECOMMENDATION nor for Educational Purposes; it is just for Informational purposes only. The chart data used is 3 Months old, as Showing Live Chart Data is not allowed according to the New SEBI Mandate.
Disclaimer: "I am not a SEBI REGISTERED RESEARCH ANALYST AND INVESTMENT ADVISER."
This analysis is intended solely for informational purposes and should not be interpreted as financial advice. It is advisable to consult a qualified financial advisor or conduct thorough research before making investment decisions.
Price Action Analysis:
Trend Structure and Momentum:
- The stock experienced a prolonged uptrend from March 2023 to July 2024, rallying from base levels around ₹433 to a peak of ₹1,275, representing approximately 195% appreciation
- Post the July 2024 peak, the stock entered a corrective phase characterised by lower highs and consolidation
- Recent price action shows a breakout above the descending cyan trendline that had been capping rallies since mid-2024
- Current price of ₹979.35 (as of October 31, 2025) represents a 26.80% gain, indicating strong buying momentum
- The stock is trading above all key Fibonacci retracement levels, having reclaimed the 61.8% level at approximately ₹953
Candlestick Patterns and Formations:
- The most recent candle shows a strong bullish close with a substantial body, indicating conviction in the upward move
- The chart displays a rising wedge/descending channel pattern that was broken decisively in recent sessions
- Prior consolidation between ₹700-₹850 formed a re-accumulation base, which has now been breached to the upside
- The breakout candle demonstrates strong price and volume expansion, a classic sign of institutional participation
Volume Spread Analysis:
Volume Characteristics:
- Recent volume surge to 90.39 million shares significantly exceeds the average volume of 13.46 million, representing approximately 6.7x normal trading activity
- The volume spike coincides with the price breakout, validating the move as genuine rather than a false breakout
- Historical volume analysis shows similar spikes during major trend reversals, particularly during the March 2023 base breakout
- Volume expansion without corresponding price weakness suggests strong demand absorption at current levels
Volume-Price Relationship:
- The volume profile indicates heavy accumulation in the ₹700-₹800 zone, which now serves as a critical support cluster
- Recent sessions show sustained above-average volume, suggesting institutional interest rather than retail speculation
- The volume pattern aligns with a classic "breakout with expansion" scenario, increasing the probability of trend continuation
Support and Resistance Levels:
Key Support Zones:
- Primary Support (S1): ₹854 - This represents the 0.5 Fibonacci retracement level and previous consolidation high
- Secondary Support (S2): ₹754 - The 0.382 Fibonacci level and recent breakout point from the descending trendline
- Critical Support (S3): ₹631 - The 0.236 Fibonacci level and long-term base support at ₹433-₹450 zone
- The grey trendline originating from the 2024 lows provides dynamic support, currently positioned around ₹720
Key Resistance Zones:
- Immediate Resistance (R1): ₹1,094 - The 0.786 Fibonacci retracement level
- Major Resistance (R2): ₹1,275 - The all-time high achieved in July 2024 and psychological resistance
- Extended Resistance (R3): ₹1,400-₹1,500 - Projected based on measured move from the consolidation range
Technical Patterns and Indicators:
Chart Patterns:
- Descending Channel Breakout: The stock has successfully breached the cyan-colored descending trendline that acted as resistance since July 2024
- Rising Wedge Resolution: The consolidation pattern between August and October 2025 has resolved to the upside
- Base-on-Base Formation: The ₹433 level established in early 2024 served as the foundation for the subsequent rally, demonstrating strong long-term base support
- Cup and Handle (Potential): If the stock consolidates between ₹950-₹1,050 and then breaks out, it could form a cup and handle pattern projecting toward ₹1,400+
Fibonacci Analysis:
- The 61.8% Fibonacci retracement at ₹953 has been convincingly reclaimed, suggesting the corrective phase may be complete
- Golden ratio support held perfectly during the September-October consolidation
- The next Fibonacci target at 0.786 (₹1,094) represents the immediate upside objective
- Fibonacci extension levels project Upmove at ₹1,350 (1.272 extension) and ₹1,500 (1.618 extension) if the rally extends
Risk Factors and Invalidation Levels:
- A close below ₹920 would signal a potential false breakout
- Sustained trading below ₹850 would invalidate the bullish setup and suggest resumption of the downtrend
- Weekly close below the broken trendline (currently around ₹940) would be a bearish reversal signal
- Failure to maintain above 61.8% Fibonacci retracement could trigger another corrective leg
Fundamental and Sectoral Backdrop:
Company Fundamentals:
- Chennai Petroleum Corporation (CPCL) reported Q2 FY26 revenue of ₹16,327 crore with profit after tax of ₹719 crore
- The company achieved a crude throughput of 3.013 million metric tonnes (MMT) with a Gross Refining Margin (GRM) of $9.04 per barrel in Q2 FY26
- However, Q1 FY26 saw challenges with a net loss of ₹40 crore compared to a profit of ₹357 crore in Q1 FY25, primarily due to inventory losses and lower GRM of $3.22 per barrel
- For H1 FY26, CPCL recorded net profit of ₹689.68 crore versus a net loss of ₹294.45 crore in H1 FY25, with average GRM at $6.17 per barrel
- The company achieved a record crude throughput of 11.642 MMT with 111% capacity utilisation
Business Operations and Product Portfolio:
- CPCL is engaged in refining crude oil to produce various petroleum products, including LPG, Motor Spirit, Kerosene, Aviation Turbine Fuel, High Speed Diesel, Naphtha, Fuel Oil, and Bitumen
- The company also produces speciality products like Paraffin Wax, Mineral Turpentine Oil, Hexane, and Petrochemical feedstocks
- Most fuel products are marketed by the parent company, Indian Oil Corporation (IOC), while CPCL directly markets speciality products
- In 2024, CPCL commissioned new infrastructure, including Pharma Grade Hexane production and Sustainable Aviation Fuel
Financial Metrics and Valuation:
- Market capitalisation stands at approximately ₹14,584 crore, with the company maintaining a healthy dividend payout of 35%
- CPCL has demonstrated strong return on equity with a 3-year ROE of 31% and has reduced debt levels
- Current price-to-earnings and other valuation metrics suggest the stock is reasonably valued considering sectoral challenges
Sector Outlook and Industry Trends:
- India's refining capacity increased to 258.1 MMTPA as of FY25, with domestic consumption at 239.2 MMTPA
- India is expected to drive global oil demand growth, with consumption projected at 5.74 million barrels per day in 2025 and 5.99 million bpd in 2026
- The country plans to expand refining capacity to 309.5 MMTPA by 2028
- Refinery output has been strong, with manufacturing IIP for refined petroleum products rising 4.24% in June 2025, driven by auto-fuel demand growth of 7.9% year-on-year
- However, refining margins are expected to fall below mid-cycle levels in FY25, indicating potential profitability challenges
Opportunities and Challenges:
Opportunities:
- Downstream activities driven by refinery-petrochemical integration are projected to post the highest 5.2% CAGR through 2030
- Growing domestic demand for petroleum products with urbanisation and economic growth
- Government initiatives supporting energy infrastructure development
- Indian refiners have benefited from processing discounted Russian crude, generating significant margins
Challenges:
- Net profit declined for the last two quarters, with an average decrease of 108.5% per quarter, and revenue fell 14.1% per quarter
- Volatile crude oil prices and fluctuating gross refining margins
- India's domestic crude oil production has fallen 26.3% and natural gas by 24.1% during FY12-FY25, leading to increased import dependency
- Environmental regulations and pressure to transition toward cleaner energy
- Institutional investment in CPCL decreased by 37.83% over the past 30 days
Competitive Position:
- CPCL is a subsidiary of Indian Oil Corporation, providing strategic advantages in product marketing and distribution
- The company competes with major refiners, including Reliance Industries, Bharat Petroleum, Hindustan Petroleum, and Mangalore Refinery
- CPCL's core vision is to be the most admired Indian energy company, creating value through world-class performance and ethical governance
- The company's location in South India provides strategic advantages for serving the region's growing energy needs
Fundamental Risks:
- The stock trades at reasonable valuations with potential upside to fair value estimates around ₹1,050
- Strong Q2 performance suggests earnings momentum is improving after a weak Q1
- Sectoral tailwinds from growing domestic demand support medium-term prospects
- Key risks include GRM volatility, crude price fluctuations, and regulatory changes
My 2 Cents:
- CPCL presents a compelling technical setup following the breakout from a multi-month consolidation pattern
- The combination of volume expansion, Fibonacci support, and trendline breach suggests potential for further upside
- Risk management is critical given sectoral volatility; strict adherence to stop losses is recommended
Full Coverage on my Newsletter this Week
Keep in the Watchlist and DOYR.
NO RECO. For Buy/Sell.
📌Thank you for exploring my idea! I hope you found it valuable.
🙏FOLLOW for more
👍BOOST if you found it useful.
✍️COMMENT below with your views.
Meanwhile, check out my other stock ideas on the right side until this trade is activated. I would love your feedback.
As per the Latest SEBI Mandate, this isn't a Trading/Investment RECOMMENDATION nor for Educational Purposes; it is just for Informational purposes only. The chart data used is 3 Months old, as Showing Live Chart Data is not allowed according to the New SEBI Mandate.
Disclaimer: "I am not a SEBI REGISTERED RESEARCH ANALYST AND INVESTMENT ADVISER."
This analysis is intended solely for informational purposes and should not be interpreted as financial advice. It is advisable to consult a qualified financial advisor or conduct thorough research before making investment decisions.
Gold for next week -> 3 Nov 2025I'm expecting a drop into the demand zone and from there expecting a rally into the next supply zone which I marked above.

XAU/USD – Gold Maintains Short-Term Uptrend, Target $4,108🔍 Market Context
Gold continues to uphold a short-term uptrend structure after forming a clear Change of Character (ChoCH) around the 3,926 USD zone.
Buyers are in control as prices consistently create higher lows and react positively at the Order Block + Supporting Trendline zone.
As long as prices remain above the 3,940–3,926 USD area, the uptrend structure is preserved.
💎 Key Technical Zones
• Order Block Bullish: 3,926 USD → main support zone, confluence with rising trendline.
• Fair Value Gap (FVG): 3,942 – 3,972 USD → potential liquidity absorption zone.
• Resistance Zone: 4,032 USD → short-term resistance, needs to be broken to confirm continued uptrend.
• Liquidity Zone: 4,108 USD → expansion target if the above resistance is breached.
🎯 Trading Scenarios
1️⃣ BUY Setup – Prioritise catching the retracement from support zone
• Entry: 3,942 – 3,926 USD
• Stop Loss: 3,910 USD
• Take Profit:
– TP1: 3,972
– TP2: 4,032
– TP3: 4,064
– TP4: 4,108
✳️ “Buy the discount” – Prioritise orders in the confluence zone of OB + FVG to follow Smart Money flow.
2️⃣ SELL Scalp – Short-term at resistance zone
• Entry: 4,032 – 4,048 USD
• Stop Loss: 4,060 USD
• Take Profit:
– TP1: 4,010
– TP2: 3,972
– TP3: 3,942
✳️ “Sell the premium” – Activate only if clear price rejection signals appear at resistance.
💬 Summary
The current structure still leans towards bullish short-term with the 3,926 USD zone as the key invalidation zone .
As long as prices stay above the trendline, the immediate target is the 4,108 USD liquidity zone.
Optimal strategy: Buy on dip – Sell on reaction.
“Smart Money buys fear, sells greed — follow the footprints, not the noise.”
⏰ Timeframe: 1H
📅 Update: 31/10/2025
✍️ Analysis by: Captain Vincent

XAU/USD – Gold Eyes 4,100$ as Safe-Haven Demand Holds Firm🔍 Market Context
Gold continues to attract buyers for the second consecutive day, as renewed safe-haven demand supports a modest recovery from last week’s lows near 3,890$.
While the Fed’s hawkish stance keeps the Dollar firm, concerns over a prolonged US government shutdown and weaker macro sentiment have limited further USD gains — allowing gold to stabilize above the 3,970–3,990$ zone.
Still, with mixed fundamentals in play, traders remain cautious ahead of next week’s US data releases and policy speeches.
📊 Technical Outlook (H1–H4)
Gold has successfully broken its short-term downtrend, reclaiming momentum from the 3,933–3,973$ liquidity zone.
Price is now consolidating below the psychological 4,000$ handle, forming a clean breakout–retest structure.
Key Levels:
• Immediate Support: 3,973$ – 3,933$ (Breakout & Retest Zone)
• Resistance 1: 4,035$ – 4,050$
• Resistance 2 / Target: 4,114$ – 4,127$ (Fibo 1.618 extension)
• Extended Bull Target: 4,148$+ if momentum sustains
Invalidation: A breakdown below 3,930$ would invalidate the bullish scenario and re-open short-term downside liquidity toward 3,890$.
🎯 Trading Outlook
If gold holds the breakout above 3,970$, the bias remains bullish —
buyers may continue driving price toward 4,100$+, aligned with fib extensions and prior supply structure.
However, any hawkish narrative from Fed speakers could trigger intraday pullbacks before continuation.
⚜️ MMFLOW Insight:
“Smart money never rushes the breakout — it builds conviction where liquidity confirms direction.”

Gold Futures MCX-2H — A Possible Double Zigzag at PlayThe decline from 132,294 unfolded into a clean 5-wave impulse, with Wave 3 extending 1.618 × Wave 1 and Wave 5 measuring nearly equal to Wave 1 — a classic Fibonacci rhythm confirming the completion of Wave W at 117,628.
The ongoing rebound appears corrective, unfolding as an A-B-C structure for Wave X. A move toward the 124–125 k zone could complete Wave C, setting the stage for another 5-3-5 leg lower as Wave Y — potentially mirroring Wave W.
Gold might just be correcting a bit more before it gleams brighter.
Disclaimer: This analysis is for educational purposes only and does not constitute investment advice. Please do your own research (DYOR) before making any trading decisions.

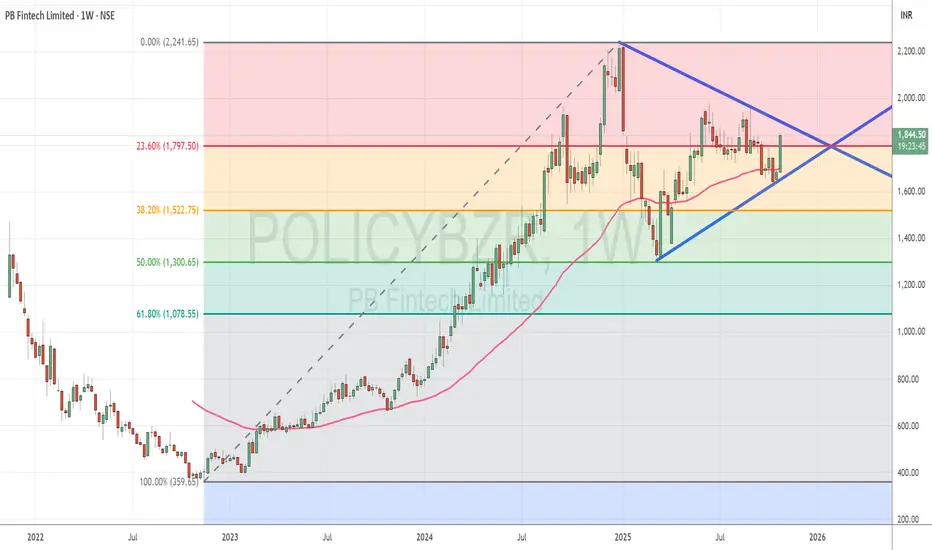
PB Fintech attempts recovery after first major correctionTopic Statement:
PB Fintech Ltd (PolicyBazaar) is recovering from its first significant correction following a steady bull run, with price action now approaching key resistance levels.
Key Points:
1. The stock retraced to the 50% Fibonacci level at 1300, where it found strong support and began to stabilize
2. A wedge candlestick pattern is forming, and a breakout in either direction could determine the next trend
3. The price faces stiff resistance at the 2000 mark, which may act as a ceiling unless bullish momentum drives a breakout
South Indian Bank Ltd — Going South Before It Heads North?After a stellar impulsive rise, South Indian Bank seems to be taking a short trip south — just to refuel for its next northern journey.
The weekly chart unfolds a beautiful Elliott Wave sequence, where Wave 5 of (3) topped precisely at ₹40.30 , aligning exactly with the 2.618 Fibonacci extension of Wave 1 (₹22.30–₹26.95) projected from Wave 4 (₹28.11).
Such precision often signals wave exhaustion — and that’s what we’re seeing now, as prices cool off from the climax of Wave (3). The retracement zone between ₹31.30 (0.5) and ₹29.18 (0.618) may act as a potential support area for the upcoming Wave (4) .
Interestingly, the broader price curvature hints that this Wave (4) correction might also sculpt a handle-like structure , completing a larger cup base before Wave (5) takes the lead. But that’s a story for later — for now, the textbook Fibonacci alignment deserves the spotlight.
Disclaimer: This analysis is for educational purposes only and does not constitute investment advice. Please do your own research (DYOR) before making any trading decisions.

Gold Extends Decline Below $4,000 as Risk Appetite Returns🔍 Market Context
Gold continues to weaken as renewed optimism over US–China trade relations reduces safe-haven demand.
Despite the Fed’s dovish tone after the latest FOMC meeting, the Dollar remains relatively capped, offering limited support to bullion.
However, the technical landscape remains bearish — the decisive break below the $4,000 handle signals a continuation of the downside structure that’s been unfolding since early in the week.
📊 Technical Analysis
• Structure: Clear downtrend across H1–H4, with consistent lower highs and controlled liquidity sweeps.
• Key Resistance: 3,985 – 4,000 (former support now turned supply).
• Short-Term Targets:
– 3,925 – 3,930 → initial liquidity pocket.
– 3,880 – 3,860 → extended bearish target aligned with Fibo 1.618 extension.
• Invalidation: Only a confirmed break & hold above 4,020 – 4,030 would shift bias neutral-to-bullish.
🎯 Trading Outlook
If gold retests the 3,985–4,000 zone and fails to reclaim it, sellers are likely to extend control toward 3,920 or lower ahead of the FOMC-driven volatility.
Momentum remains bearish as long as the market trades below the 4,000 pivot — liquidity below 3,900 may attract smart money before any meaningful rebound.
⚜️ Summary
This decline isn’t random — it’s a structural reset.
The market is rebalancing after months of overextended bullish sentiment.
Watch how price reacts between 3,920–3,880 — this zone could define the next shift in gold’s short-term direction.
📊 MMFLOW TRADING Insight:
“Smart money doesn’t chase candles — it waits for liquidity to shift.”
XAU/USD – Gold in Equilibrium Zone: Sell Opportunities Around...🔍 Market Context
Gold is currently consolidating within a triangle structure , showing short-term accumulation before a potential breakout.
Buyers are trying to maintain a minor bullish structure, but the series of lower highs indicates that sellers still hold the upper hand.
At the moment, price is reacting within the FVG 3,942–3,979 USD area, staying below the descending trendline.
If this zone fails to break, selling pressure may return.
💎 Key Technical Levels
• Bearish Order Block: 4,022 USD → main supply zone, aligning with the descending trendline.
• FVG Zone 1: 3,979 USD → short-term liquidity test area.
• FVG Zone 2: 3,942 USD → potential retracement zone before further downside.
• Bullish Order Block: 3,882 USD → key support aligning with long-term bullish trendline.
• Liquidity Zone: 3,789 USD → extended target if main support breaks.
🎯 Trading Scenarios
1️⃣ Sell Setup – Reaction from Resistance Zone
• Entry: 4,012 – 4,022 USD
• Stop Loss: 4,035 USD
• Take Profit:
– TP1: 3,979
– TP2: 3,942
– TP3: 3,900
– TP4: 3,882
– TP5: 3,789
✳️ “Sell the premium” – utilise supply and FVG reactions following Smart Money flow.
2️⃣ Buy Setup – Reaction from Demand Zone
• Entry: 3,882 USD
• Stop Loss: 3,865 USD
• Take Profit:
– TP1: 3,910
– TP2: 3,942
– TP3: 3,979
– TP4: 4,012
– TP5: 4,022
✳️ “Buy the discount” – valid when strong absorption or reversal signal forms near the lower OB.
💬 Summary
Current structure remains short-term bearish , yet the market is balanced.
The most efficient approach is to sell near premium zones (4,022) and buy back near discount (3,882) .
Expected range in the next 24–48 hours: 3,880–4,020 USD .
💡 Tagline:
“Trade where institutions act — not where retail reacts.”
⏰ Timeframe: 1H
📅 Updated: 30/10/2025
✍️ Analysis by: Captain Vincent

GOLD | Is This the FINAL Short Setup Before the Next Move? Welcome Traders!
Forget the noise — focus on structure and sentiment. Gold is holding firm near $3,950, but the macro backdrop just got tighter.
The question now: Can demand strength beat Powell’s new hawkish tone?
1. Market Insight – Powell vs. Demand
Two forces are pulling Gold in opposite directions:
🐻 Bearish Catalyst:
Powell hinted that another rate cut in December is unlikely, and the Fed plans to continue balance sheet reduction — strengthening the USD and weighing on non-yielding assets like Gold.
🐂 Bullish Support:
Persistent central bank demand and ETF inflows continue to provide a safety net, tightening overall Gold supply.
🎯 Outlook:
Expect sideways compression before a potential breakout. We’re stalking the strategic Sell Zone to align with the bearish fundamentals.
📊 2. Structure Check – Where Bears Wait
The market is approaching a major confluence zone:
SELL LIMIT Zone: $4,057 — intersection of the descending trendline and key horizontal resistance.
Immediate Support: $4,005 — target for the first leg down.
3. Action Plan – The Short Sniper Setup
Entry: SELL LIMIT $4,057
Stop-Loss: just above the descending trendline
TP1: $4,005 (short-term support retest)
Extended Target: $3,938 if breakdown accelerat
Powell’s hawkish tone is clear — but will bears finally take control from $4,057$, or will central bank demand defend the rally?

Gold Rebounds Toward OB, but Deeper Correction May Follow🔍 Market Context
After forming a Change of Character (ChoCH) and a clear Break of Structure (BoS) to the downside, gold dropped sharply from 4,080–4,100 USD, confirming a shift from bullish to bearish structure.
Price is now making a technical rebound, forming Lower Highs toward the Order Block 4,012 USD — aligning with a small Fair Value Gap (FVG) , suggesting new selling pressure may emerge.
This rebound is seen as a “pullback retest supply” within a completed bearish setup.
If the 4,012 USD supply zone reacts strongly, price may extend its drop toward lower liquidity pools.
💎 Key Technical Structure
BoS (bearish): confirms a break below prior bullish structure.
Order Block (OB): 4,010–4,020 USD → main supply area confluencing with FVG.
FVG zone: 3,985–4,010 USD → technical retracement zone.
Supply Zone: 3,891–3,895 USD → temporary support, may be swept.
Liquidity Zone: 3,850–3,860 USD → key liquidity target.
📈 Trading Scenarios
1️⃣ SELL Setup – Retest OB 4,010–4,020 USD
Entry: 4,010 – 4,020
SL: 4,035
Take Profit: 3,985 - 3,965 - 3,945 - 3,915 - 3,890/Open
✅ Condition:
Wait for price to retest FVG–OB with clear bearish confirmation (strong rejection, bearish engulfing, or minor ChoCH on M15).
➡️ Trend-follow setup – sell after price retests supply zone.
2️⃣ BUY Setup – Reversal at Liquidity Zone 3,850 USD
Entry: 3,850 – 3,860
SL: 3,830
TP1: 3,870 - 3,885 - 3,900 - 3,920 - 3,940/Open
✅ Condition:
Wait for strong absorption or bullish reversal signal (long-tail rejection or bullish ChoCH on M15–H1).
➡️ Counter-trend scalp setup for reversal traders.
⚠️ Risk Management
Prioritise SELLs below 4,035 USD.
BUYs only valid with confirmation at Liquidity Zone.
Avoid mid-range trading (3,920–3,970) to reduce noise.
💬 Conclusion
Gold remains in a bearish trend after breaking prior bullish structure.
As long as price stays below 4,035 USD , downside momentum prevails.
Next major target: 3,891 – 3,851 USD .
👉 Strategic Plan:
Sell 4,010–4,020 | SL 4,035 | TP 3,985 → 3,890 🎯
Buy 3,850–3,860 | SL 3,830 | TP 3,870 → 3,940 🎯
💎 Price never lies — liquidity always reveals the truth.
⏰ Timeframe: 1H
📅 Updated: 29/10/2025
✍️ Analysis by: Captain Vincent

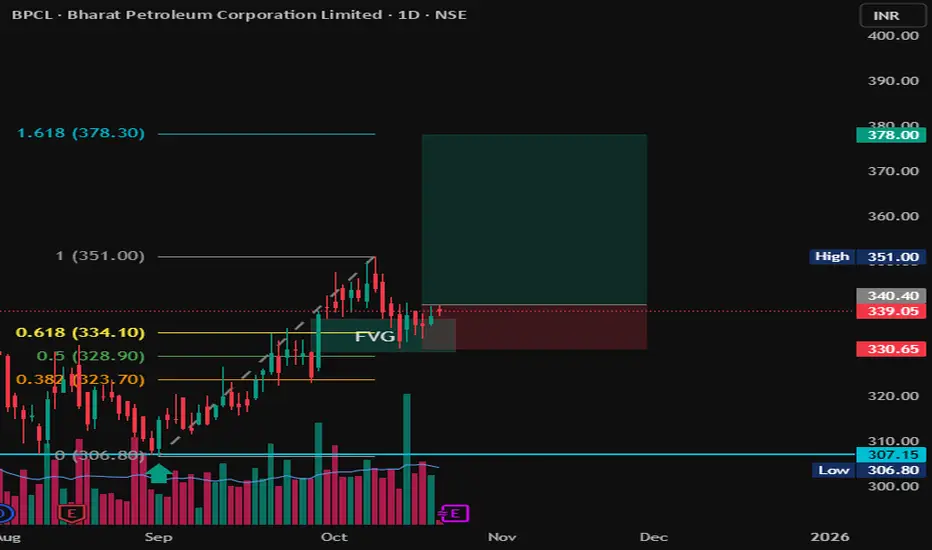
BPCL | FVG + Fibonacci COnfluence | Long Setup toward 378 💬 Description:
Chart Type: 1D (Daily)
Stock: BPCL – Bharat Petroleum Corporation Ltd.
🧩 Setup Overview
BPCL has completed a clean retracement into a Fair Value Gap (FVG) aligning with the 0.5–0.618 Fibonacci retracement zone from the previous upswing (306 → 351).
The zone around ₹334–₹340 acted as strong demand support, hinting at a possible continuation leg to the upside.
📊 Trade Plan
Entry Zone: ₹338–₹340
Stop Loss: ₹330
Target 1: ₹351
Target 2: ₹378 (1.618 Fib Extension)
Risk–Reward Ratio: ~1:3
📈 Technical Confluence
✅ FVG + 0.618 Fib alignment
✅ Retest & bounce confirmation
✅ Volume showing accumulation
✅ Clear higher-low structure maintained
🚨 Invalidation
Setup invalid if price closes below ₹330, which would break FVG and shift structure to bearish.
🧠 Bias: Bullish continuation
Time Horizon: Swing (2–4 weeks)
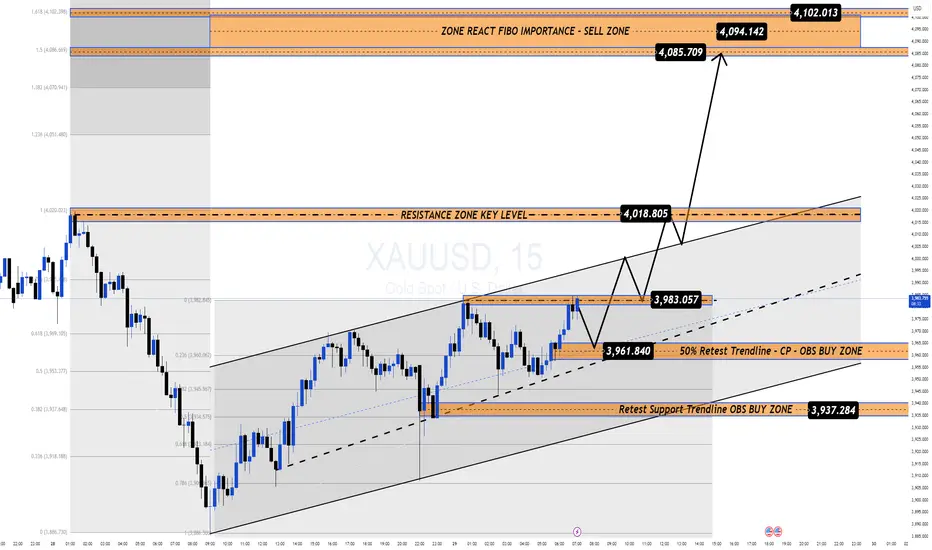
Gold Recovers 1000 Pips Ahead of FOMC: Key Levels in Focus📊 Market Overview
After a sharp selloff that shook long positions, Gold has rebounded nearly 1000 pips, recovering from the 388x area toward 398x ahead of the upcoming FOMC meeting.
Despite the short-term recovery, Gold remains down around 3.5% this week, showing caution as traders reposition before the Fed decision and amid easing U.S.–China trade tensions.
Currently, the price is trading near $3,980–3,990 during the Asian session, consolidating below the psychological $4,000 mark.
💎 Technical Outlook (H1–M15)
Gold continues trading in a short-term ascending channel, showing a corrective recovery inside a larger downtrend.
Immediate Support Zones:
• 3,961 – 3,937 → Trendline retest & OBS Buy Zone
• 3,918 → Structural invalidation area
Resistance & Key Reaction Levels:
• 4,018 – 4,085 → Mid-term resistance
• 4,094 – 4,102 → Major Sell Zone (Fibo 1.5–1.618 confluence)
📍If Gold breaks and holds above 4,018, momentum could extend toward 4,085–4,102.
📍If it rejects near 4,094–4,102, a correction toward 3,961–3,937 is likely.
🌍 Macro Context – FOMC Ahead
Markets expect a 25bps rate cut. A hawkish tone from Powell may pressure Gold, while a dovish one could send it above $4,100.
🧭 Summary
Gold keeps a short-term bullish bias but remains fragile ahead of FOMC.
Expect volatility around 4,000–4,100; key reactions near 4,094–4,102 will decide the next move.
🛡 Stay patient — liquidity builds before clarity.
GOLD (XAU/USD) — Calm Before the FOMC Storm Gold is currently consolidating above $3,950, signaling a pause in volatility as traders await the FOMC decision for the next directional move.
1️⃣ Macro Outlook & Core Bias – FOMC in Focus 🔑
Market Pause: After rebounding during the Asian session, Gold’s upside momentum remains limited. Market participants are cautious ahead of the Fed’s policy update.
Headwinds: Renewed optimism on US–China trade and a slightly stronger USD are capping Gold’s advances.
Game Plan: Stay tactical — identify scalp zones and prepare for a major breakout once the FOMC event unfolds.
2️⃣ Technical Setup – Descending Channel in Play 📉
Structure: Price action is holding above $3,950, but movement remains confined within a descending channel/flag.
Bias: Short-term demand persists, yet the broader structure still favors bears.
Preferred Setup: Watch for BUY scalps from lower demand zones toward the Fibo/channel resistance area.
3️⃣ Trading Plan – Precision & Patience 💰
🟩 BUY Scenario (Long Scalp)
Buy Zone: $3,939.468
Strategy: Look for long scalps targeting the Fibo 0.5 resistance.
Stop-Loss: Tight SL just below the $3,939 level.
🟥 SELL Scenario (Short Setup)
Scalp Sell Zone: $4,015.646 (Fibo 0.5)
→ Short scalps targeting a retest of the channel midline.
Main Sell Zone: $4,046.448 (Fibo 0.618 / Channel Ceiling)
→ Ideal entry for a continuation short, aligning with the overall bearish channel.
4️⃣ Trader’s Take 🚀
The FOMC decision will set the tone —
Are you eyeing a bounce from $3,939, or waiting for the $4,046 rejection to ride the next wave down?

Gold Extends Decline Below $4,000 as Risk Appetite Returns🔍 Market Context
Gold continues to struggle amid renewed optimism around US–China trade talks.
The shift in sentiment has reduced safe-haven demand, while softer expectations of further Fed rate cuts keep the US Dollar capped — offering limited downside support for XAUUSD.
However, the technical landscape remains clearly bearish.
The break below the ₹4,000 handle confirms continuation of the downtrend first outlined in early-week plans.
📊 Technical Analysis
Structure: Gold maintains a clean bearish channel on the H1–H4 frame.
Immediate resistance: ₹3,985 – ₹4,000 (former support, now supply zone).
Target zones:
• Short-term liquidity area near ₹3,925–₹3,930
• Extended target sits around ₹3,880–₹3,860, aligning with Fibo 1.618.
Invalidation: Only a sustained break and hold above ₹4,020–₹4,030 would neutralize this short-term bearish bias.
🎯 Trading Outlook
If gold retests the broken ₹4,000 zone and fails to regain it,
expect sellers to extend control toward ₹3,920 or lower ahead of the FOMC meeting.
That event may later define the next recovery point — but for now, momentum remains firmly on the downside.
⚜️ Summary
Gold’s recent slide isn’t random — it’s structural.
The market is rebalancing after excessive bullish sentiment,
and liquidity below ₹3,900 is likely to attract attention before any significant rebound.
Watch the reaction near ₹3,920–₹3,880 —
that’s where the next meaningful decision for gold may emerge.
📊 MMFLOW TRADING Insight:
Smart money doesn’t chase candles — it waits for liquidity to shift.

GOLD DIP ALERT! Sniping the $3,89x FIBO Floor Ahead of FOMC!FranCi$$_FiboMatrix Quick Insight (H1/M30 Focus)
Welcome Traders! Gold paused its sell-off near $4,065 as safe-haven demand returned pre-FOMC. Dovish Fed expectations are weakening the USD, setting the stage for a major rally. This is the final BUY ON DIPS setup!
🧠 INSIGHT & LOGIC
Fundamental Anchor: Weak US inflation and strong expectations for a Fed rate cut are the key drivers limiting downside. Long-term bias is Bullish.
Technical Focus: We are tracking the final deep correction to the $3,89x zone (Fibo 1.5 - 1.618 Extension). This is the ultimate technical floor for the ATH rally.
Action Plan: WAIT for the price to hit this extreme zone and confirm reversal (H1/M30).
🎯 KEY ACTION ZONES
🔥 CRITICAL BUY: $3,89x region ($3,881.435$).
Strategy: BUY on confirmation here.
TP TARGET 1: $4,037.647 (Immediate Resistance).
TP TARGET 2: $4,232.374 (Major Structural Resistance).
SL MANDATE: Place SL safely below the 1.618 Fibo zone.
Patience is key. Do NOT rush the entry! Is the $3,89x$ floor strong enough for the ATH rally? 👇
