NZDCHF Bullish OpportunityICMARKETS:NZDCHF is forming nice Lower Lows and Lower Highs on Daily time frame with a strong Bearish Trend.
I was eying on Double Bottom but it broke that level too.
Also I was looking after H4 time frame to let the price create a bullish divergence while still got loads of benefits from its bearish move.
Now when we check H1 timeframe it formed a nice diveregence with an expected full back at 0.4675.
The Bearish Daily trendline on Daily time frame stops us from getting more greater reward yet we are going bullish aiming our 2nd TP to that area.
I will take two positions both at the breakout Higher Low at 0.4675. Both position has 2% risk in total with the stop loss at 0.4643
IMPORTANT: Move the SL to BE after TP1 hits to aim for your 2nd TP with 0 risk.
Position 1 with 1 % Risk
Buy Stop: 0.4675
Stop Loss: 0.4643
TP: 0.4707
Position 1 with 1 % Risk
Buy Stop: 0.4675
Stop Loss: 0.4643
TP: 0.4730
Fibonacci

EURAUD Bearish SetupIf we look at H4 chart of ICMARKETS:EURAUD , it made a great reversal and formed a bearish Engulf at 70% Fib Level.
The H4 timeframe is forming a slid rationality to be bearish on H1 timeframe. The targets may take a week or so to hit while the SL may hit within a few days.
On H1 timeframe the MACD showed overboughtness and the price is probably to change its trend from Bullish to bearish.
the MACD divergence is second by Lower High formation indicating a bearish signal.
Now we need a confirmation for the price to cross the HIgher Low at 1.7795.
I will place a sell stop order 1.7793 with my SL at the Higher High at 1.7863
I will take two positions both at the breakout Higher Low at 1.7793. Both position has 2% risk in total with the stop loss at 1.7863
Note: The Sell stop order is a must. If its not triggered then we are not aiming for any other trade.
Important: If TP1 Hit, we will move our SL to Break even to trade the rest 2.5x reward with 0 risk.
Position 1 with 1 % Risk
Sell Stop: 1.7793
Stop Loss: 1.7863
TP: 1.7723
Position 1 with 1 % Risk
Sell Stop: 1.7793
Stop Loss: 1.7863
TP: 1.7615

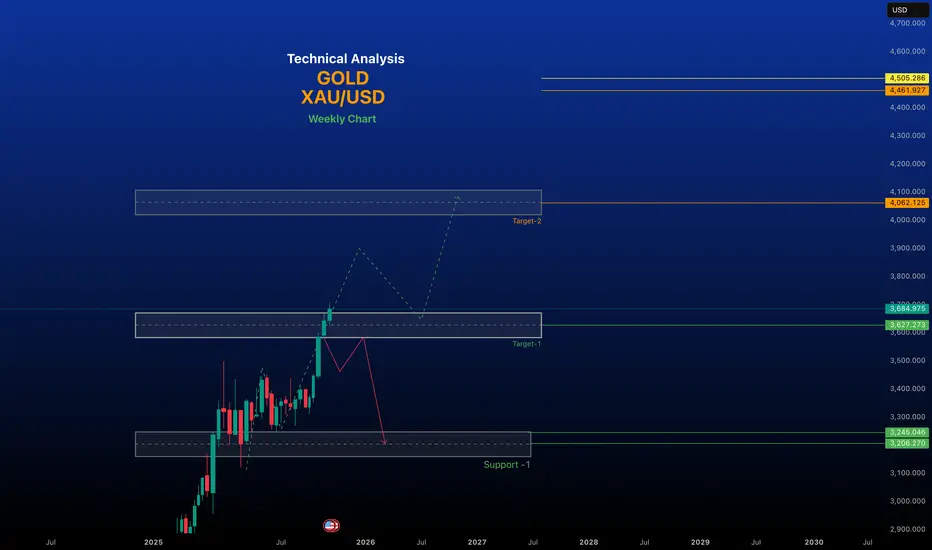
Gold Hits New Record: Should You Buy or Sell in This Hot Market?Namaste traders,
This past week, gold surprised everyone by closing strong. On Friday (19/09), it moved higher again, marking its 5th consecutive weekly gain at $3,683.24/oz, while futures touched $3,718.50/oz. This surge followed the Fed’s rate cut, which many thought would cool the yellow metal. So, is this a genuine rally or just a bull trap?
Fundamentals: Rate Cut Pushes Gold Higher
Lower interest rates reduce the cost of holding gold.
Fed’s dovish signals raised expectations for more easing.
In India, physical gold demand is at a 10-month high, while China also shows strong appetite despite higher prices.
Technical Outlook
Gold broke its downward trendline, signaling bullish continuation. Buyers are in control.
This Week’s View: Focus on buying near-term targets at $372x and $373x, but stay alert to macro news.
Trading Setups (with strict risk management):
Buy Scalp: $3671–$3669 | SL: $3666 | TP: $3674–$3694
Buy Zone: $3657–$3659 | SL: $3647 | TP: $3669–$3709
Sell Scalp: $3713–$3715 | SL: $3719 | TP: $3705–$3785
Sell Zone: $3731–$3733 | SL: $3741 | TP: $3723–$3683
Will gold shine brighter and set another all-time high? Share your view! 👇

XAU/USD – Captain Vincent Weekly Plan🔎 Captain’s Log – Context
📈 Main Trend : Strong uptrend after BoS.
📊 Price moving sideways within the rising channel, staying below Weak High 3674 .
📌 EMA 50 > EMA 200 → bullish trend remains solid.
🎯 Captain’s Map – Trading Scenarios
1️⃣ Golden Harbor (BUY – Main Priority)
🎯 Entry:
FVG Dock: 3602 – 3593
FVG Deep: 3567 – 3560
OB Harbor: 3535 – 3540
⛔ SL: below 3520
✅ TP1: 3674 (sweep Weak High)
✅ TP2: 3720 – 3740
2️⃣ Quick Boarding (Short-term SELL – Counter-trend)
Condition: If price breaks 3674 first → watch for false break.
🎯 Entry: 3670 – 3680
✅ TP: back to 3602 – 3567
⚠️ Note : scalp only, don’t hold long.
3️⃣ Storm Breaker Alert (Bearish Scenario)
If 3535 breaks → short-term uptrend invalidated.
🎯 Bearish target: 3480 – 3500
Captain’s Note ⚓
“The golden sail still catches the wind after BoS, leading the captain and crew on the bullish tide. Golden Harbor 🏝️ (3593 – 3560 – 3535) remains the preferred docking point to load cargo and continue the voyage. Quick Boarding 🚤 at Storm Breaker 🌊 (3670 – 3680) is only a short ride when the ship sweeps liquidity at Weak High 3674 . Should 3535 break, the ship might be dragged toward 3480 – 3500, but as long as it anchors at Golden Harbor, the grand journey still heads north toward 3720+.”

Gold Market Analysis: September 20, 2025Gold (XAU/USD) continues its remarkable bullish run in 2025, driven by persistent geopolitical tensions, central bank buying, a weakening US dollar, and expectations of further Federal Reserve rate cuts. As of today, the spot price stands at approximately $3,685 per ounce, marking a 1.06% increase from the previous day and a staggering 40.47% year-over-year gain. This follows a 26% rise in the first half of the year and nearly 41% year-to-date, with the metal recently touching an all-time high near $3,707 earlier this month. The market remains in a structural uptrend, though short-term volatility—exacerbated by the recent FOMC meeting—has led to some profit-taking and consolidation.
Technical Analysis
Gold's chart on the daily and H1 timeframes shows a bullish bias, with the price trading above key moving averages (50-day MA at $3,520 and 200-day MA at $3,200). The recent pullback from $3,707 appears corrective, testing demand zones around $3,638-$3,644 where buyers stepped in aggressively.Key Support Levels:Immediate: $3,644–$3,638 (recent demand zone; strong buying interest here).
Long term Support and resistance
Support : $3,525–$3,580
Key Resistance Levels: $3,900 - $4,000
Trend Bullish
~~ Disclaimer ~~
This analysis is based on recent technical data and market sentiment from web sources. It is for informational \ educational purposes only and not financial advice. Trading involves high risks, and past performance does not guarantee future results. Always conduct your own research or consult a SEBI-registered advisor before trading.
# Boost and comment will be highly appreciated.
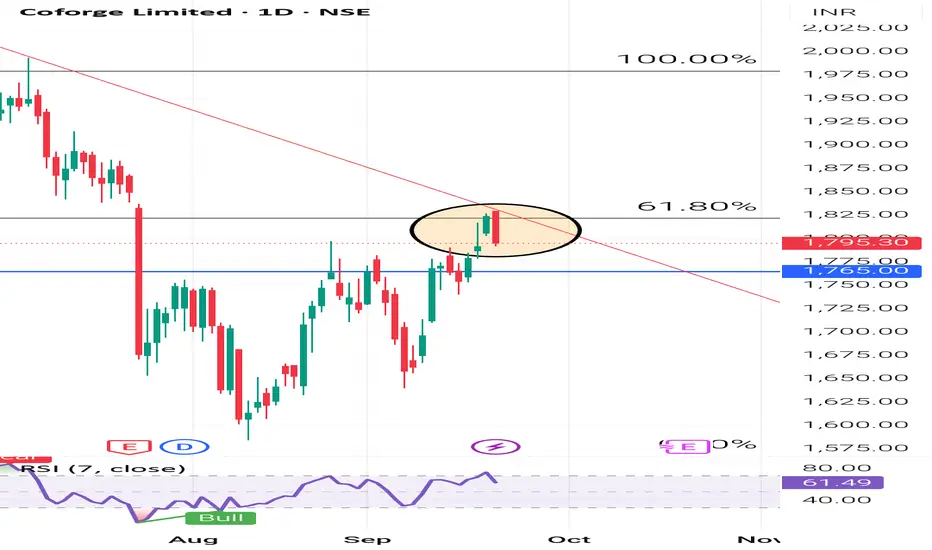
COFORGE LIMITED ( 1D ) 🔑 KEY LEVELS 🔑
✔ Fibonacci Retracement 61.80%
✔ Trend Line Act As Resistance.
✔ RSI Also Overbought Zone.
🎯 TRADING PLAN 🎯
✔ Near the key levels , Bearish Engulfing
Candlestick Pattern has formed.
✔ The Entry Point is Below @ 1792.10
✔ The Stoploss Point is @ 1830.00
✔ The First Target is @ 1681.00
✔ The Second Target is @ 1601.00
💡 Never, ever argue with your trading
System.
Disclaimer : Educational & Informational
Purpose Only. Not a Buy / Sell
Recommendation.
Gold holds firm at 3,63x | Caution for Friday session🟡 XAU/USD – 19/09 | Captain Vincent ⚓
🔎 Captain’s Log – Market Context
FED : Probability of a 25bps cut in October is 91.9%, while holding rates is only 8.9% → almost certain FED will continue easing.
US News : No major data today, market remains quiet.
Gold : Sharp moves in Asia session, but support 3,632 – 3,630 held strong.
Yesterday’s Buy at 3,62x delivered 200 pips , confirming this zone as a “fortress” support.
Note : Today is Friday – end of the week session, unexpected volatility may occur before the weekly close → strict risk management required.
⏩ Captain’s Summary : Gold remains bullish, but caution is needed with end-of-week swings. Golden Harbor around 3,63x continues to be a solid anchor.
📈 Captain’s Chart – Technical Analysis
Storm Breaker (Resistance / Sell Zone)
3,661 – 3,663 (intraday resistance)
3,683 – 3,685 (strong OB, likely profit-taking zone)
Golden Harbor (Support / Buy Zone)
3,602 – 3,605 (FVG zone – deeper support if 3,63x breaks, waiting for strong demand)
Market Structure
After rebounding from 3,62x, Gold consolidated around 3,65x – 3,66x.
Main trend stays bullish, but needs support retest to confirm buyers’ strength.
3,66x is the pivot barrier:
• Breakout → targets 3,68x
• Rejection → retest 3,64x – 3,62x
🎯 Captain’s Map – Trade Plan
✅ Buy (priority)
Entry: 3,602 – 3,605
SL: 3,588
TP: 3,629 – 3,661 – 3,683
⚡ Sell (short scalp)
Entry: 3,683 – 3,685
SL: 3,695
TP: 3,665 – 3,645
⚓ Captain’s Note
“The 3,63x fortress continues to hold, keeping the Golden ship safe on its northward journey. Golden Harbor 🏝️ (3,602 – 3,605) remains the main dock for sailors to gather strength. Storm Breaker 🌊 (3,683 – 3,685) may raise waves, suitable for short Quick Boarding 🚤 . Today is Friday – the sea can shift unexpectedly, so keep the sails full but hands steady on the helm.”

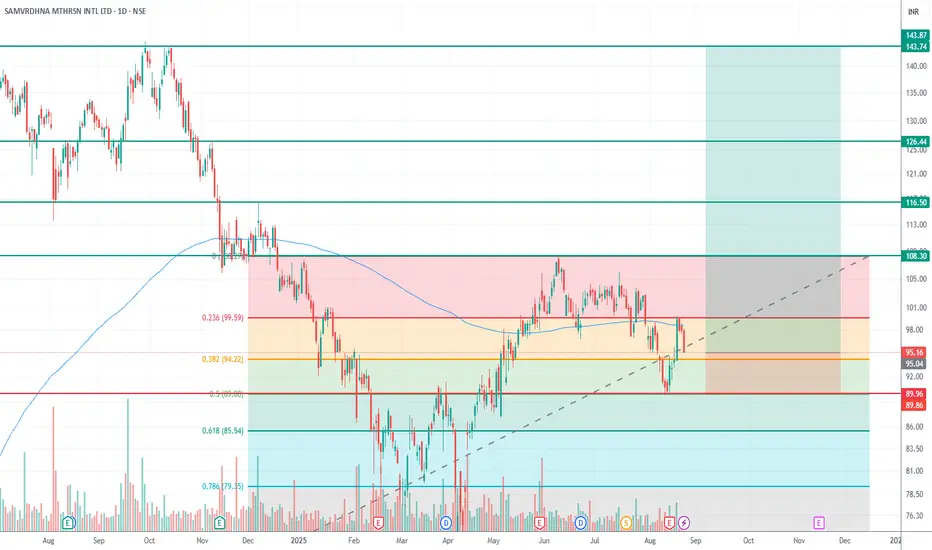
MOTHERSON (Weekly + Daily Analysis)Disclaimer: This is my personal analysis for educational purposes only. I am not SEBI-registered. Please consult your financial advisor before making any trading decisions.
🔎 Weekly Chart Setup
On the weekly timeframe, when plotting Fibonacci from the bottom (below 200 EMA) to the top (above 200 EMA):
Price retraced to the 0.5 level.
After holding this zone, it is again moving towards the highs.
📈 Daily Chart Confirmation
Entry near CMP ~95.16.
Stop Loss: below 0.618 Fibonacci retracement → around 85 (safer SL).
Once the price crosses the first target, SL can be revised upward to the 0.5 level (~89–90).
🎯 Targets
First Target: Weekly high → 103–108
Second Target: 116
Third Target: 126
Final Target: 143
⚖️ Risk-Reward
Initial SL: 85
Entry: 95.16
Multiple profit targets with an approximate R:R > 1:5.
📌 Summary:
Weekly chart supports a bullish continuation after holding the 0.5 retracement.
The daily chart provides a clear risk-defined setup with a stop below 0.618.
Scaling out at targets and trailing SL increases the probability of locking profits.
GOLD SHOWING A GOOD UP MOVE WITH 1:10 RISK REWARD GOLD SHOWING A GOOD UP MOVE WITH 1:10 RISK REWARD
DUE TO THESE REASON
A. its following a rectangle pattern that stocked the market
which preventing the market to move any one direction now it trying to break the strong resistant lable
B. after the break of this rectangle it will boost the market potential for break
C. also its resisting from a strong neckline the neckline also got weeker ald the price is ready to break in the outer region
all of these reason are indicating the same thing its ready for breakout BREAKOUT trading are follws good risk reward
please dont use more than one percentage of your capitalfollow risk reward and tradeing rules
that will help you to to become a bettertrader
thank you

FED slows down: Cuts 25bps, gold stays flat🟡 XAU/USD – 18/09 | Captain Vincent ⚓
🔎 Captain’s Log – News Context
FED : Cut rates by 25bps as expected, hinted at 2 more cuts this year → initially supported Gold to rebound around 3,65x.
Powell turned hawkish :
• “No need to move quickly on rate cuts.”
• “Today’s cut is mainly risk-management.”
This message signaled that the FED is not fully opening the easing door → Gold fluctuated and stalled its upside momentum.
Tonight: Awaiting Jobless Claims & Philly Fed for more clarity on the FED’s path.
⏩ Captain’s Summary
Gold is supported by the rate cut, but Powell’s “braking” caused volatility.
Zone 3,663 – 3,665 has become the pivot support to determine the next move.
📈 Captain’s Chart – Technical Analysis
Storm Breaker (Resistance / Sell Zone)
3,684 – 3,686 (strong OB)
3,717 – 3,719 (ATH Zone – very strong, likely heavy selling)
Golden Harbor (Support / Buy Zone)
Pivot Dock: 3,663 – 3,665 (new pivot support)
Main Harbor: 3,629 – 3,630 (BoS confluence & old sideway)
Market Structure
After breakout and profit-taking, Gold returned to test support.
3,663 – 3,665 : pivot support.
• If it holds → rebound to 3,684 – 3,717.
• If it breaks → deeper correction to 3,629.
🎯 Captain’s Map – Trade Plan
✅ Buy (priority)
Buy Zone 1
Entry: 3,663 – 3,666
SL: 3,655
TP: 3,684 – 3,717
Buy Zone 2
Entry: 3,629 – 3,630
SL: 3,618
TP: 3,663 – 3,684 – 3,717
⚡ Sell (only at resistance)
Sell Zone OB
Entry: 3,684 – 3,686
SL: 3,695
TP: 3,665 – 3,645
Sell Zone ATH NEW
Entry: 3,717 – 3,719
SL: 3,727
TP: 3,706 – 3,690 – 3,675
⚓ Captain’s Note
“The Golden sails caught wind as the FED cut rates, but Powell’s headwind slowed the advance. Golden Harbor 🏝️ (3,663 – 3,629) is the pivot dock to decide the next course. If it holds, the ship may rebound to test Storm Breaker 🌊 (3,684 – 3,719) . If it breaks, the ship will retreat deeper to gather strength. For now, Quick Boarding 🚤 should only be done at strong resistance, while the larger voyage still leans northward.”

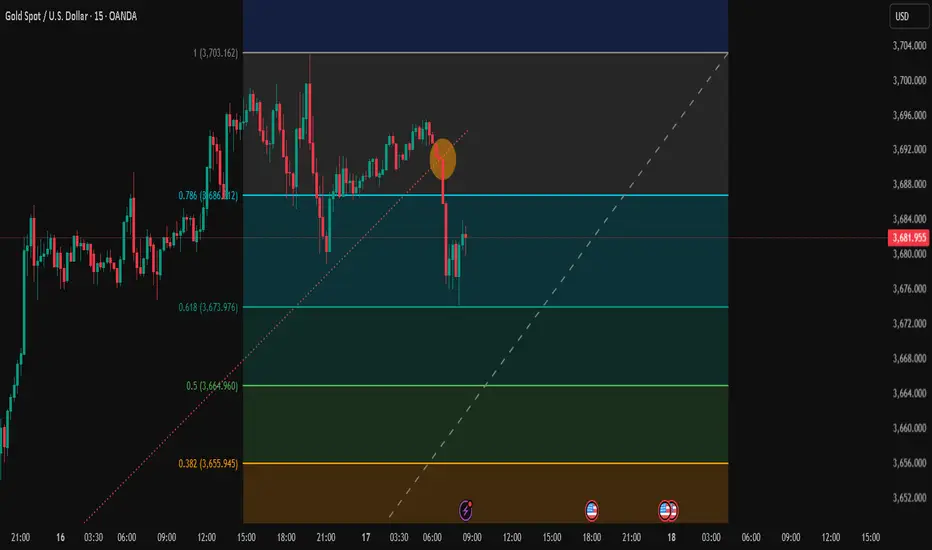
Trading Analysis for Gold Spot / U.S. Dollar (15-Minute Chart)Sell XAU/USD now at 3688.00 level and take a stop loss of 3703.00 and the targets will be as follows.
Entry range 3691.00 to 3687.00
Take Profit 1 = 3673.00
Take Profit 2 = 3665.00
Take Profit 3 = 3655.00
Take Profit 4 = 3645.00
Stock Loss 3703.00
Based on the provided 15-minute chart for Gold Spot / U.S. Dollar (XAU/USD), published by NaviPips on TradingView.com on June 30, 2025, at 17:53 UTC, here’s a suggested trading setup for a buy position:
Current Price and Trend: The current price is 3,241.875, with a slight increase of +0.250 (+0.01%). The chart shows a recent downtrend that appears to be stabilizing near the current level, suggesting a potential reversal point.
Buy Entry: Enter a buy position at 3,312.875 (current price), as it aligns with a support zone where the price has found a base, indicated by the horizontal dashed line and recent consolidation.
Stop Loss: Place a stop loss at 3,295.250, below the recent low, to protect against further downside. This level is approximately 10.625 points below the entry, defining the risk.
Take Profit Levels:
Take Profit 1: 3,317.875, a conservative target about 20.000 points above the entry, aligning with a minor resistance zone.
Take Profit 2: 3,324.750, a mid-range target approximately 31.875 points above the entry.
Take Profit 3: 3,332.500, a deeper target about 45.625 points above the entry, indicating a potential trend reversal.
Price Action: The chart indicates a downtrend with a possible bottoming pattern near the current level. The support zone and upward candlestick suggest a buy opportunity if the price holds.
Risk-Reward Ratio: The distance to the stop loss (10.625 points) compared to the take profit levels (20.000 to 45.625 points) offers a favorable risk-reward ratio, ranging from approximately 1:1.9 to 1:4.3.
Conclusion
Enter a buy at 3,241.875, with a stop loss at 3,295.250 and take profit levels at 3,317.875, 3,324.750, and 3,332.500. Monitor the price action for confirmation of an upward move, and be cautious of a potential continued downtrend if the price breaks below the stop loss level. (Note: I assume "take profot" was a typo for "take profit" and have corrected it accordingly.)
FED countdown | Buy at support, Sell at resistanceXAU/USD – 17/09 | Captain Vincent ⚓
🔎 Captain’s Log – News Context
18/09, 01:00 (US time): FED rate decision + Dot Plot → policy outlook for upcoming meetings
01:30: Powell’s speech – the key market focus
Market consensus: FED almost certain to cut -25bps. However, the -50bps scenario still exists → if it happens, it will be a “big boost” for Gold
During Asia–Europe session, Gold faced early profit-taking, dropping quickly to 3,677 – 3,675, reflecting caution ahead of the FED
⏩ Captain’s Summary
Gold is making a technical pullback before the FED.
Medium-term trend remains bullish, but patience is needed to wait for better Buy entries.
📈 Captain’s Chart – Technical Analysis
Storm Breaker (Resistance / Sell Zone)
Nearby OB: 3,693 – 3,695 (short scalp)
ATH Zone: 3,717 – 3,720 (strong resistance, potential heavy selling)
Golden Harbor (Support / Buy Zone)
Shallow Dock: 3,656 – 3,657 (short-term)
Main Harbor: 3,629 – 3,630 (trendline confluence + old BoS)
Market Structure
Multiple BoS confirm bullish trend
Price retracing to support, likely to bounce back and test 3,693 – 3,717
Break above 3,720 → confirms new ATH
🎯 Captain’s Map – Trade Plan
✅ Buy (priority)
Buy Zone 1
Entry: 3,656 – 3,657
SL: 3,648
TP: 3,675 – 3,693 – 3,717
Buy Zone 2
Entry: 3,629 – 3,630
SL: 3,618
TP: 3,656 – 3,690 – 3,717
⚡ Sell (only at resistance)
Sell Zone OB
Entry: 3,693 – 3,695
SL: 3,705
TP: 3,690 – 3,685 - 3680 - 368x - 36xx
Sell Zone ATH
Entry: 3,717 – 3,720
SL: 3,727
TP: 3,715 – 3,710 – 3,705 - 37xx
⚓ Captain’s Note
“Before the FED countdown, profit-taking waves pulled the Golden ship toward Golden Harbor 🏝️ (3,656 – 3,629) .
Yet the main current still flows north, the bullish trend remains intact.
Storm Breaker 🌊 (3,693 – 3,720) is the big wave, suitable for short Quick Boarding 🚤 scalps.
Sailors must stay patient – the FED wind could be the force to propel Gold to new peaks.”

ASIAN PAINTS LTD ( 1D ) 🔑 KEY LEVELS 🔑
✔ Fibonacci Retracement 38.20%
✔ Trend Line Act as Support.
✔ RSI Also Oversold Zone.
🎯 TRADING PLAN 🎯
✔ Near the key levels , Bullish Harami
Candlestick Pattern has formed.
✔ The Entry Point is Above @ 2496.90
✔ The Stoploss Point is @ 2474.50
✔ The First Target is @ 2601.00
✔ The Second Target is @ 2705.00
💡 Discipline is the bridge between goals &
accomplishment.
Disclaimer : Educational & Informational
Purpose Only. Not a Buy / Sell
Recommendation.

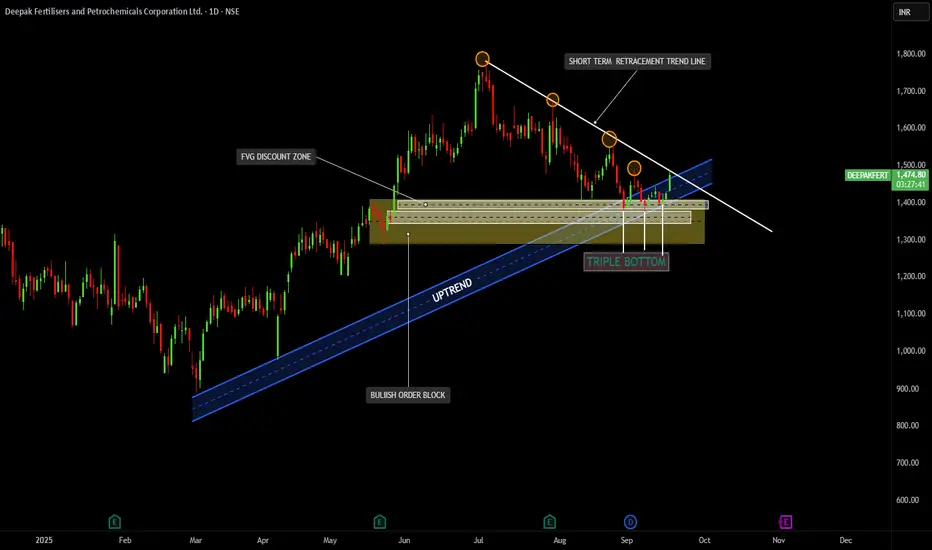
DEEPAK FERTILIZERTrend Structure:
The stock has been in a primary uptrend (marked with the blue ascending channel).
Recently, it went into a short-term retracement with a downward sloping trendline (white).
Support & Demand Zones:
Strong Bullish Order Block and FVG Discount Zone around the ₹1350 – ₹1400 level, where buyers are stepping in.
Price formed a Triple Bottom at this support, indicating strong demand and rejection of lower prices.
Pattern & Candlestick Structure:
Triple Bottom is a reversal pattern confirming that sellers are unable to push below ₹1350.
Current candles show bullish momentum, reclaiming above the retracement trendline.
Breakout:
Price has broken the short-term retracement trendline on the upside, signaling a potential end to the correction.
Fresh momentum is visible with today’s +3.70% rise, closing near ₹1478.
Volume:
Breakout accompanied with decent volume (296K), strengthening the bullish signal.
🔹 Technical Outlook:
Bullish Bias: The combination of triple bottom support, order block demand zone, and trendline breakout suggests bullish continuation.
Immediate Resistance Levels: ₹1520 – ₹1560 (near-term supply zone).
Major Resistance: ₹1650 – ₹1700 (previous swing highs).
Support Levels: ₹1400 (strong demand zone), followed by ₹1320 if broken.
🔹 Trading View:
Aggressive Traders: Can look for long entries near ₹1450–₹1470 with a stop loss below ₹1400.
Conservative Traders: Wait for a daily close above ₹1520 to confirm strength before entering.
Targets: First target ₹1560, second target ₹1650–₹1700
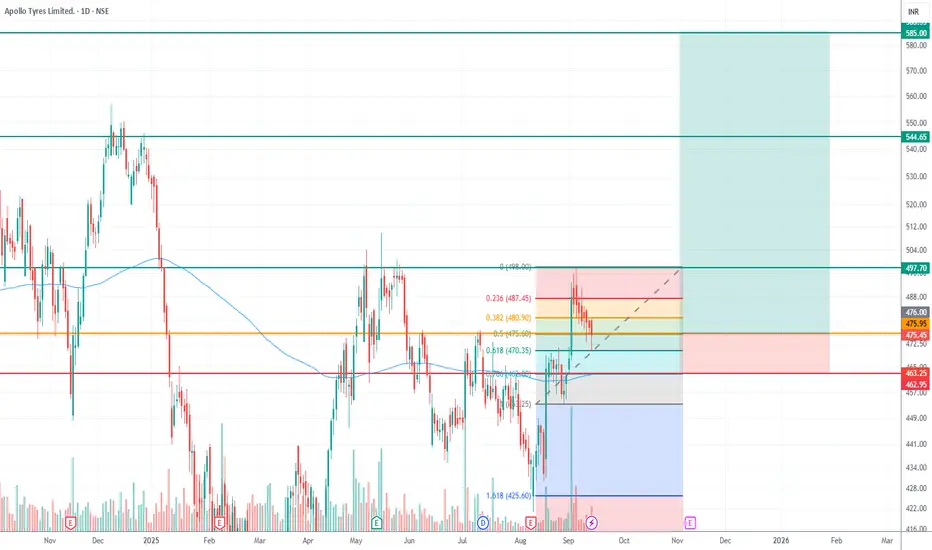
APOLLOTYRE: Interesting Breakout and Consolidation PatternWe are observing a strong technical setup in the stock, marked by a clear breakout followed by consolidation near key Fibonacci levels.
✅ Final Recommendation
▶ Buy at 475 (Fibo 0.618 level)
▶ SL at 463 (Fibo 0.7 level)
▶ Hold for Targets:
1️⃣ 497
2️⃣ 544
3️⃣ 585
This is a well-structured opportunity with clear technical validation. Trade wisely and manage risk appropriately
⚡ Risk-Reward: 1:8+
👉 Disclaimer: This is purely based on technical analysis and not financial advice. Investors should do their own research and invest responsibly..
FED shaken by politics | Gold eyes new ATH🟡 XAU/USD – 16/09 | Captain Vincent ⚓
🔎 Captain’s Log – News Context
FED & US Politics :
S. Miran elected to the FED Board but still serves as Trump’s economic advisor → concerns FED may face White House influence.
Michelle Mills elected with a narrow 48–47 margin.
Appeals Court blocked Trump from firing L. Cook, affirming FED’s independence, but raising the risk of a legal battle at the Supreme Court.
US Economy :
6:30 AM (US time): Retail Sales release – key consumer spending indicator.
Probability of a -50bps FED cut this week is down to 1.2% , nearly ruled out. FED is almost certain to deliver -25bps next week.
⏩ Captain’s Summary : Politics create noise, but the macro backdrop (FED easing + weak US data) remains the tailwind supporting Gold’s journey toward new ATH.
📈 Captain’s Chart – Technical Analysis
Storm Breaker (Resistance / Sell Zone) :
3706 – 3714 (Fibonacci resistance)
3722 – 3724 (Strong Sell Zone, potential ATH test)
Golden Harbor (Support / Buy Zone) :
FVG Dock: 3666 – 3668
OB Harbor: 3643 – 3645
Strong Low: 3611 (deep support)
Market Structure :
After a series of BoS , Gold broke out of sideways EqH/EqL and surged.
Preferred scenario: retrace to FVG 3666 , then bounce toward 3714 – 3722.
If 3722 breaks successfully → confirms new ATH and extends bullish momentum.
🎯 Captain’s Map – Trade Plan
✅ Buy (priority)
Buy 1 (FVG)
Entry: 3666 – 3668
SL: 3657
TP: 3690 – 3706 – 3714 – 372x
Buy 2 (OB)
Entry: 3643 – 3645
SL: 3632
TP: 3666 – 3700 – 3714 – 372x
⚡ Sell (short scalp at resistance)
Sell Zone
Entry: 3722 – 3724
SL: 3732
TP: 3714 – 3706 – 3690
⚓ Captain’s Note
“The Golden ship has broken free from sideways waters and is heading toward new peaks. Golden Harbor 🏝️ (3666 – 3643) is the safe dock for sailors to gather strength before sailing further. Storm Breaker 🌊 (3722 – 3724) is the big wave, suitable only for short Quick Boarding 🚤 . With dovish winds from the FED, the Golden sails are set toward new ATH.”

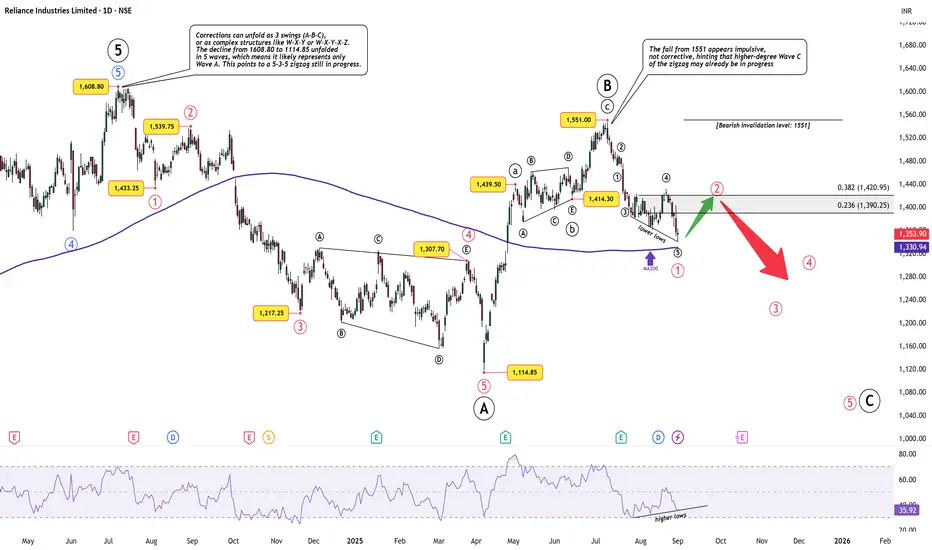
Reliance Industries – Short-Term Bounce, Bigger Zigzag UnfoldingWave Structure
The decline from the all-time high at 1608.80 to 1114.85 unfolded in a clean 5-wave impulse. Rather than a completed W–X–Y correction, this is best viewed as Wave A of a higher-degree zigzag (5-3-5).
The subsequent rally into 1551 was a clear 3-wave move, marking Wave B . With this structure, the larger Wave C is now favored to be unfolding to the downside.
Current Setup
The drop from 1551 is impulsive, not corrective, which supports the case that Wave C is already in progress.
Price is testing the MA200 and printed bullish RSI divergence (higher lows on RSI vs. lower lows on price), suggesting near-term exhaustion.
This favors a short-term Wave 2 bounce before further downside unfolds.
Outlook
Short-term (bullish): Relief rally toward 1390–1420 possible as Wave 2 plays out.
Medium-to-long term (bearish): Once Wave 2 completes, downside is expected in Wave 3–4–5 of C, with potential targets revisiting 1100 or lower.
Invalidation: A sustained break above 1551 negates the bearish outlook and would suggest the correction has already ended.
Summary
Short-term: Bounce likely.
Big picture: Bearish zigzag not yet complete.
Disclaimer: This analysis is for educational purposes only and does not constitute investment advice. Please do your own research (DYOR) before making any trading decisions.
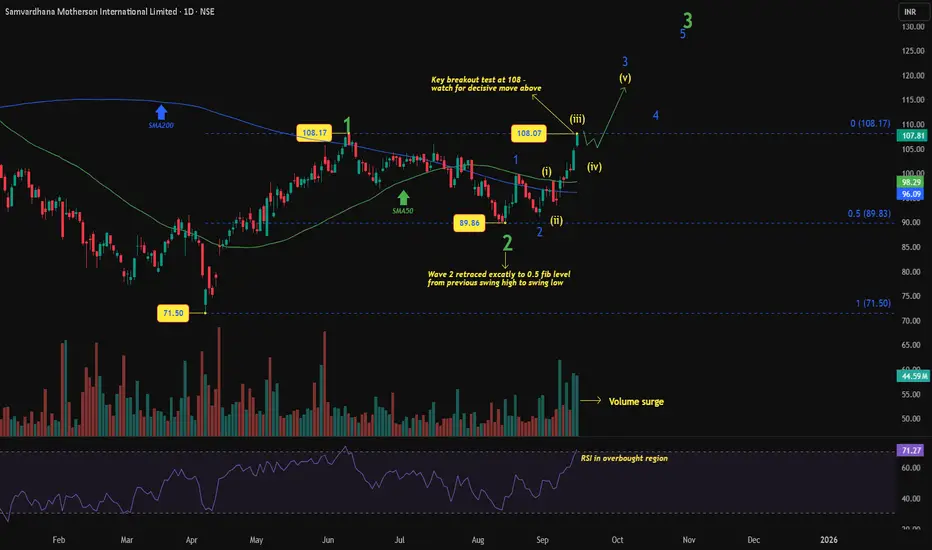
Samvardhana Motherson: Breakout or Double Top?Samvardhana Motherson has been carving a clean Elliott Wave structure since bottoming at ₹71.50.
Wave count : Wave 1 peaked at 108.17, followed by a textbook Wave 2 retracement to ₹89.86 (near the 0.5 Fib).
Current leg : Price has surged from Wave (ii) into 108, likely completing Wave (iii) of 3. A short Wave (iv) pullback would be natural before an eventual breakout in Wave (v) of 3.
Momentum factors : Strong volume surge supports the impulsive setup, while RSI in the overbought region suggests cooling off in the near term.
Moving averages : Price is now above both SMA50 and SMA200, the trend bias has turned positive, and moving averages may act as support on any pullback.
Summary : 108 is the make-or-break level. A brief consolidation is possible, but a sustained breakout above this zone in Wave (v) would confirm the Wave 3 extension.
Disclaimer: This analysis is for educational purposes only and does not constitute investment advice. Please do your own research (DYOR) before making any trading decisions.
ETH Setup You Can't Ignore:4k FVG to 5k Seller Zone ⚠️ ETH Setup You Can’t Ignore: 4K FVG to 5K SELLER ZONE!
ETHUSD – Fair Value Gap & Liquidity Sweep Setup
Ethereum is trading within a critical range, presenting a potential ICT-style setup:
Fair Value Gap (4000–4200) – Key demand zone with a “Golden Line” midpoint; price may dip to fill this imbalance before reversing.
Seller Zone (~5000) – Major supply zone where profit-taking or distribution could trigger.
Bias – Expect a sweep of downside liquidity, a reaction within the FVG, and a possible rally toward the 5000 zone if higher timeframe confluence supports it.
⚠️ Always wait for confirmation and manage risk before execution.

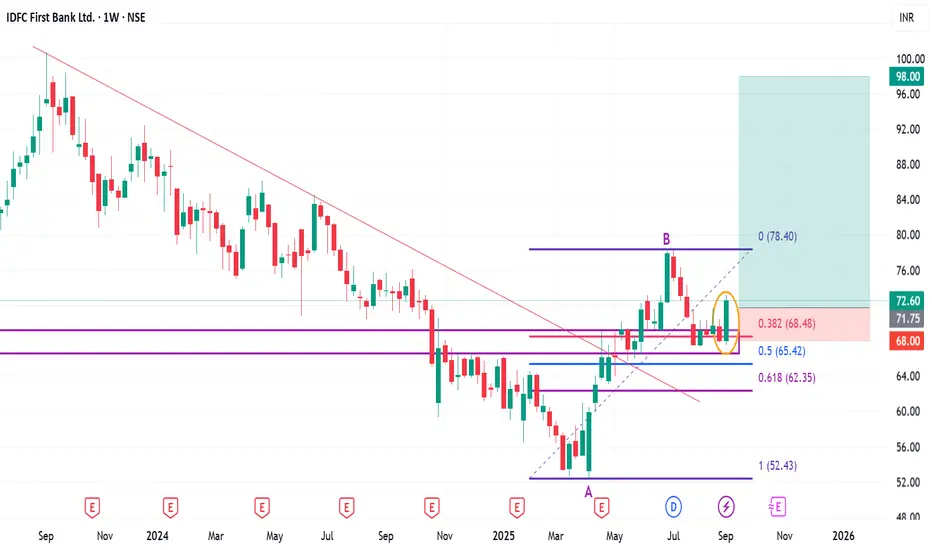
Positional or Long-term opportunity in IDFC First BankGo Long @ 71.75 for Targets of 82, 90.5, and 98 with SL 68
Reasons to go Long :
1. On Weekly timeframe If we draw Fibonacci retracement from the recent swing low (A) to the swing high (B) then the stock took support from the 0.382 Fibonacci level.
2. In addition to this, the stock formed a Bullish Engulfing Pattern (marked with a orange color) around 0.382 Fibonacci level.
3. Also there is a strong demand zone (marked with a purple color) from which the stock is taking support.
4. Besides the stock formed a Double Bottom (W) pattern at 0.382 Fibonacci level.
5. Also the stock gave a Trendline breakout (marked with a red color).
Trading Analysis for Gold Spot / U.S. Dollar (15-Minute Chart)Buy XAU/USD now at 3644.00 level and hold at 3631.00 and target will be specific.
Entry Range 3642.00 to 3644.00
Take Profit 1 = 3646.00
Take Profit 2 = 3650.00
Take Profit 3 = 3654.00
Take Profit 4 = 3658.00
Stock Loss 3631.00
Key News Timings Chart Per.
i will try to update continue.

BOMBAY BUMRAH TRADINGBombay Burmah Trading Corp Ltd
1. forming support near the opening gap/discount zone and reversing with a bullish engulfing candle.
2. Price has broken the downtrend channel and confirmed a market structure shift (MSS) above ₹1900.
3. If sustained, momentum can carry it towards ₹2100+, while a close back below ₹1850 would weaken the setup

Gold faces early selling pressure | Main trend still Buy🟡 XAU/USD – 15/09 | Captain Vincent ⚓
🔎 Captain’s Log – News Context
FED rate cut probabilities this week :
-25bps : 96.4% (up from 89.1%).
-50bps : only 3.0% (down sharply from 10.9%).
Trump : Announced more sanctions on Russia, urged NATO to stop buying Russian oil; also emphasized “the possibility of significant FED rate cuts.”
Key event today : New York Manufacturing Index at 1:30 (US time).
⏩ Captain’s Summary : The sharp drop in -50bps expectations caused early selling pressure on Gold this morning. But overall, FED is still certain to cut rates and inflation is cooling → the bigger trend continues to favor Buy .
📈 Captain’s Chart – Technical Analysis
Storm Breaker (Resistance / Sell Zone) : 3665 – 3670 (Weak High & upper cap).
Golden Harbor (Support / Buy Zone) : 3623 – 3603 – 3587.
Market Structure :
On H1, Gold is moving within a tightening triangle with EqH and EqL .
Main trend stays bullish, but needs a retest of support before rallying toward 3665 – 3670.
🎯 Captain’s Map – Trade Plan
✅ Buy (priority)
Buy Zone 1
Entry: 3623 – 3625
SL: 3612
TP: 3640 – 3650 – 3660 – 3665+
Buy Zone 2 (FVG)
Entry: 3603 – 3605
SL: 3592
TP: 3620 – 3640 – 3655 – 3665
Deep Buy Zone
Entry: 3587 – 3590
SL: 3575
TP: 3610 – 3630 – 3650
⚡ Sell (short scalp at resistance)
Sell Zone
Entry: 3665 – 3670
SL: 3678
TP: 3655 – 3645 – 3635 – 36xx
⚓ Captain’s Note
“The Golden ship faces headwinds this morning as sailors reduce expectations for a -50bps cut. But the larger sail remains filled with dovish FED winds, steering the voyage north. Golden Harbor 🏝️ (3623 – 3603 – 3587) is the safe dock to gather strength. Storm Breaker 🌊 (3665 – 3670) may raise waves, suitable for short Quick Boarding 🚤 . The main journey still favors Buy , waiting for the FED to blow more tailwind into the Golden sails.”
