XAU/USD – Market awaits JOLTS, Gold holds safe-haven role⚓️ Captain Vincent – XAU/USD: US–Venezuela tensions push Gold as safe haven
1. Market News 🌍
US Secretary of State Marco Rubio confirmed that the US military attacked a drug ship departing from Venezuela, as Washington steps up pressure on the Maduro government.
Earlier, Trump offered a $50 million bounty to force Venezuela’s President out of power, while deploying military forces near the Caribbean coast.
👉 These moves raise fears of a potential regional conflict, making Gold the top safe-haven asset. The strong rally this morning reflects safe-haven flows returning to GOLD.
📌 Tonight’s focus (3/9 – 21:00): JOLTS Job Openings report – a key gauge of US labour market health.
If the data comes weaker than expected → USD may face more pressure → Gold could accelerate higher.
2. Technical Analysis ⚙️
On the H1 chart, Gold has formed multiple BOS (Break of Structure), showing the bullish trend remains in control.
Buy Zone 3,478 – 3,480: Aligns with a major Order Block, strong support for pullback entries.
Sell Zone 3,577 – 3,579: Near fib extension 1.618, potential resistance where profit-taking may appear.
Key Support – Resistance zones:
Support: 3,528 – 3,507
Resistance: 3,562 – 3,585
3. Trade Scenarios 📌
🔺 BUY Zone (Priority)
Entry: 3,478 – 3,480
SL: 3,470
TP: 3,483 → 3,486 → 3,489 → 349x → 35xx
🔻 SELL Zone (Resistance)
Entry: 3,577 – 3,579
SL: 3,586
TP: 3,573 → 3,570 → 3,567 → 3,560 → 35xx
4. Conclusion ⚓
Gold continues to benefit from US–Venezuela geopolitical tensions, while maintaining a bullish structure with consecutive BOS signals.
In the short term, traders may:
Look to BUY around 3,478 – 3,480 to follow the main trend.
Watch for short-term SELL at 3,577 – 3,579 if price retests strong resistance.
👉 With geopolitical risks rising and US economic data (JOLTS) due tonight, Gold remains the No.1 safe-haven asset.
Fibonacci

FED dovish, Gold stays bullish; SELL only for scalps⚓️ Captain Vincent – Gold Plan XAU/USD
1. Market Wave 🌍
The probability of a FED rate cut in September surged to 96.6% (vs 90.4% earlier) after the JOLTS report showed weakening job prospects.
Several FED officials, from Kashkari to Bostic, shifted dovish. Only Musallim maintained a hawkish stance with a scenario of just one cut.
👉 Result: Capital flows returned to Gold as the No.1 safe haven, pushing prices strongly higher overnight.
📌 Key data today (04/09 – US time):
ADP Nonfarm (7:15)
Jobless Claims (7:30)
ISM Services PMI (9:00)
➡️ This trio of data will be crucial catalysts for GOLD volatility.
2. Technical Analysis ⚙️
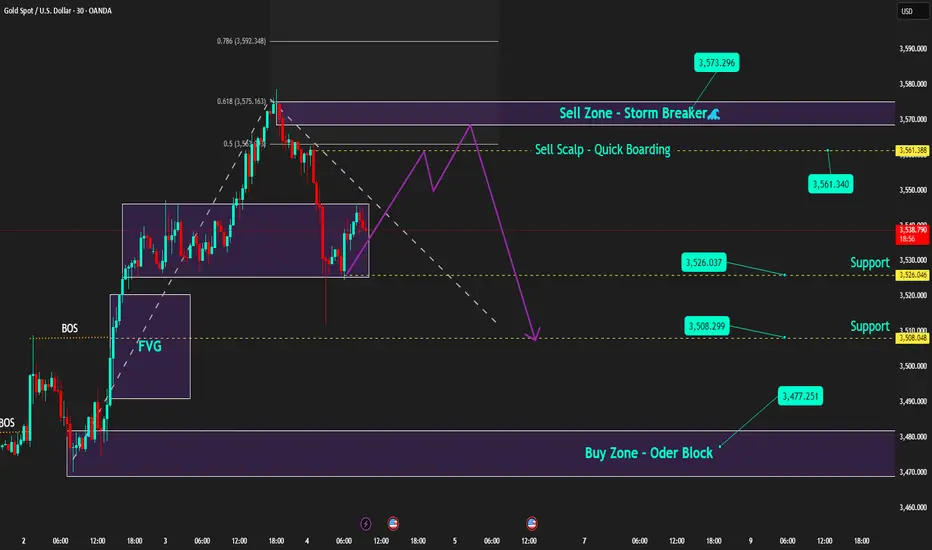
On M30/H1, Gold continues to form bullish BOS, keeping the main trend upward.
Golden Harbor 🏝️ (Buy Zone 3,477 – 3,479): Old Order Block, strong support if price pulls back.
Quick Boarding 🚤 (Sell Scalp 3,561 – 3,563): Only for short-term scalps.
Storm Breaker 🌊 (Sell Zone 3,573 – 3,575): Aligned with Fibo 0.618–0.786, strong resistance with potential selling pressure.
Captain’s Shield 🛡️ (Support): 3,526 – 3,515 – 3,508
3. Captain Vincent’s Map – Trade Scenarios 🪙
🔺 Golden Harbor 🏝️ (BUY – Priority)
Entry: 3,477 – 3,479
SL: 3,470
TP: 3,480 → 3,483 → 3,486 → 3,491 → 349x → 35xx
🚤 Quick Boarding (SELL Scalp – Short Ride)
Entry: 3,561 – 3,563
SL: 3,569
TP: 3,558 → 3,555 → 3,552 → 354x
🌊 Storm Breaker (SELL Zone – Strong Resistance)
Entry: 3,573 – 3,575
SL: 3,581
TP: 3,570 → 3,565 → 3,560 → 3,555 → 35xx
4. Captain’s Note ⚓
"The golden sail is filled with wind as the FED turns dovish. Golden Harbor 🏝️ (3477) remains the safe haven to align with the bullish trend. SELLs are just Quick Boarding 🚤 scalps at Storm Breaker 🌊 , not long voyages."
Bearish Pressure Builds: Gold Poised for More RetreatGold retreated sharply today as expected, and directly hit my expected retracement target of 3520-3510 area; the lowest point happened to be around 3511. We added a lot of short positions around 3575 and 3578 overnight, which helped us to make considerable profits during the gold retreat. All short positions made a total profit of 1830pips after being closed.
Since gold has begun to retreat from 3578, and the retracement has reached 670 pips in the short term, a retracement that is rare in recent times, as gold has shown obvious signs of retreat, once large funds begin to withdraw, it may trigger serious selling sentiment in the market. Taking this opportunity, the gold market may usher in a round of sharp correction. Moreover, after gold retreats, 3578 is expected to become the interim peak, which will limit the room for gold to rebound while being conducive to the downward pressure on gold.
In addition, gold rose sharply before the NFP market, probably to reserve room for the NFP market to fall, so I think gold still has the demand and space to continue to retreat, so the current decline has not ended yet, and I think the current short-term rebound provides us with good conditions for entering the short market.
According to the current structure, gold still needs to retreat after fluctuating at high levels. Therefore, in trading, we can still look for suitable opportunities to short gold during the gold rebound. First of all, we need to pay attention to the short-term resistance area of 3545-3555. Once gold cannot effectively stand in this area during the rebound, gold will also test the 3510-3500 area. After falling below this area, it is expected to continue to the 3490-3480 area.

Bullish Cup & Handle – A Powerful Continuation Chart Pattern🔹 Intro / Overview
☕ The Cup and Handle is a 📈 bullish continuation pattern often studied in technical analysis.
⚔️ It forms when there is a fight between bulls 🐂 and bears 🐻 — the Cup develops as both remain strong.
📉 During the Handle, sellers 🛑 temporarily gain strength.
📈 But when price closes above the Validation Line, buyers regain control 💪 and bullish momentum dominates.
____________________________________________________________
📖 How to Identify
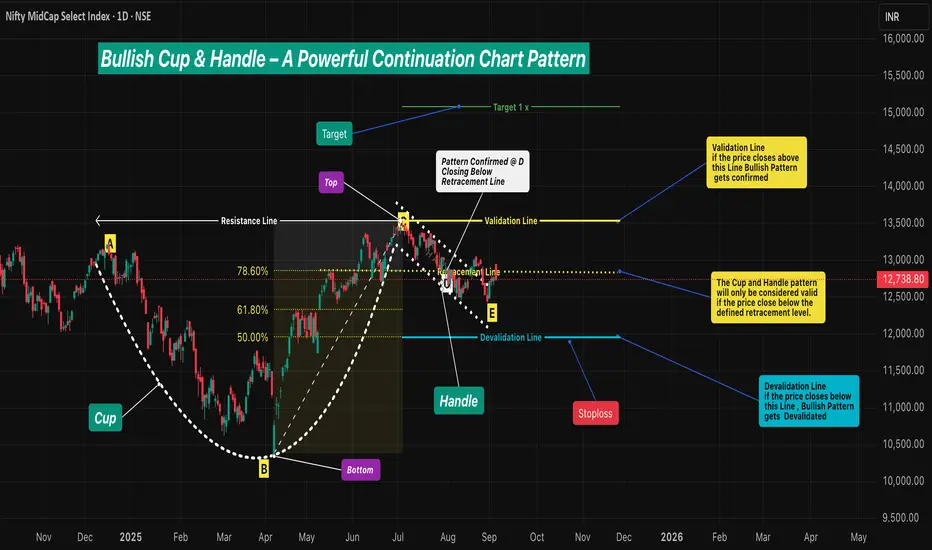
✅ Validation → The pattern is valid if price closes above the Validation Line.
❌ Devalidation → The pattern is invalid if price closes below the Devalidation Line(before Validation).
📉 Retracement Rule →The pattern is only confirmed if the price closes below the Retracement Line during the Handle formation.
This ensures a proper pullback forms before breakout .
____________________________________________________________
📖 Key Points of Pattern
✅ A valid Cup requires the retracement condition — confirmation occurs only if price closes below the Retracement Line .
⚖️ Balanced Highs → Point A (left peak) and Point C (right peak) should be relatively close in price, ensuring a proper Cup shape 🍵.
🔒 The Handle must not break the structural integrity of the Cup.(No Close Below Devalidation Lines)
____________________________________________________________
🎯 Trading Plan (Educational Only)
📌 Entry → Considered only after confirmation when price closes above the Validation Line.
🛡️ Stop-Loss (SL) → After validation, the Devalidation Line may act as an SL.
🎯 Target (TP) →
First Target → 1R (equal to the risk defined by Entry–SL distance).
Remaining Lots → Trail using ATR, Fibonacci levels, Box Trailing, or structure-based stops.
____________________________________________________________
📊 Chart Explanation
🍵 The Cup forms with a rounded base Point B and two balanced tops: Point A (left peak) & Point C (right peak) - The marginal price difference should be small to ensure a reliable Cup.
📈 The Retracement Line ( Point D ) confirms the pattern only if price closes below the Fibonacci Level of 78.60% and above the 50.00% .
📉 The Handle develops as price pulls back, with Point E marking the Handle low. and Good Handle of Cup is Formed (this low should not go below 50.00% Level )
📏 The Fibonacci retracement levels are drawn from Point B (Cup base) to Point C (right peak). These levels provide a reference framework to observe Retracement (minimum 78.60%) , Validation (100.00%) , and Devalidation (50.00%) areas for educational study of the structure.
____________________________________________________________
👀 Observations
✨ Works best after a strong uptrend 🚀 or at major support–resistance zones 🧱.
⚖️ A balanced Cup (Top Right ≈ Top Left) improves reliability.
📏 Handle Formation
The Handle should be shorter than the Cup depth — and should also be longer than the required minimum depth for proper structure.
If the Handle is too deep, it weakens the setup — and also if it is too short, the formation loses reliability.
____________________________________________________________
❗ Why It Matters
🔍 Shows the market battle between buyers and sellers.
💪 Highlights how buyers regain dominance after retracement validation.
⚖️ Balanced structure + strict rules = better filtering of weak setups.
📝 Provides clarity on entry, SL, and TP with a structured framework.
____________________________________________________________
🎯 Conclusion
The Cup and Handle pattern, when validated through Fibonacci retracement rules 📉, balanced highs ⚖️, and proper Handle structure 🔒, offers a disciplined framework for studying bullish continuation setups.
🔥 Patterns don’t predict. Rules protect.
____________________________________________________________
⚠️ Disclaimer
📘 For educational purposes only.
🙅 Not SEBI registered.
❌ Not a buy/sell recommendation.
🧠 Purely a learning resource.
📊 Not Financial Advice.
Atul Auto | MTF Fibonacci Confluence structuresWeekly Chart Analysis
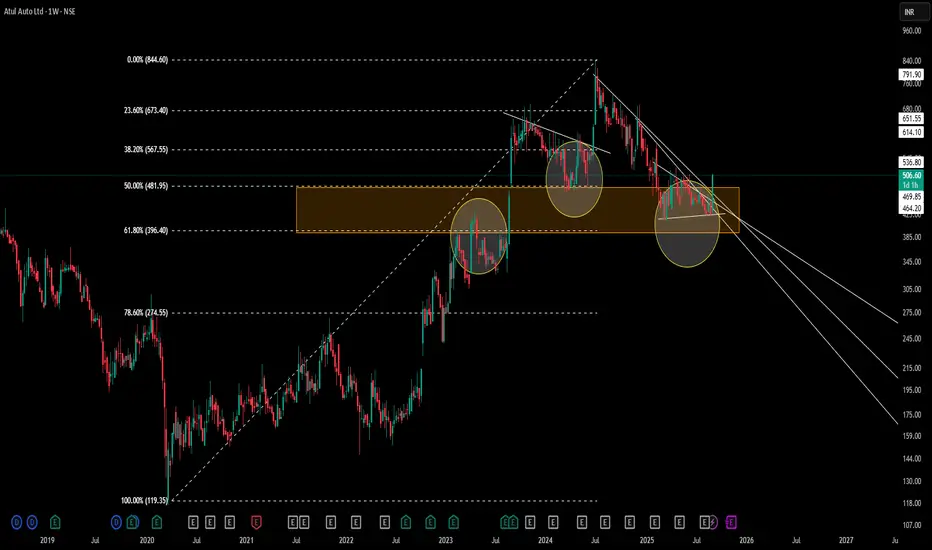
– Drew a multi-timeframe Fibonacci from the 119.35 low (Mar ’20) to the 844.60 high (Oct ’24) on the Monthly time frame .
– Highlighted the 50–61.8% retracement zone (481.95–396.40) as an orange supply/demand area.
– Circles mark historical pivots where price reacted as support or resistance within this zone.
Key Observations
-Price consistently respected the 50–61.8% band during prior rallies and pullbacks.
-Recent price action formed a contracting triangle (CT) at the lower edge of the Fibonacci zone.
-Volume contraction noted inside the triangle, suggesting supply–demand equilibrium.
Disclaimer: This analysis is provided for educational and informational purposes only and does not constitute financial advice. Trading involves risk, and you should perform your own research and consider your risk tolerance before making any trading decisions.
Bullish Look at this chart closely,
Market take a support of 53000 zone
Now structure is sideways to positive bullish
I think it's time for some time wise condition in 2000 points range
53k to 55k
Nothing else

Bullish This chart is amazing price & volume suggest that some thing is cooking under the table,now stock is in accumulation zone of 150 to 200
One can enter only buy on dips or if break out above 200 this week closing at list
This chart is only for learning purpose

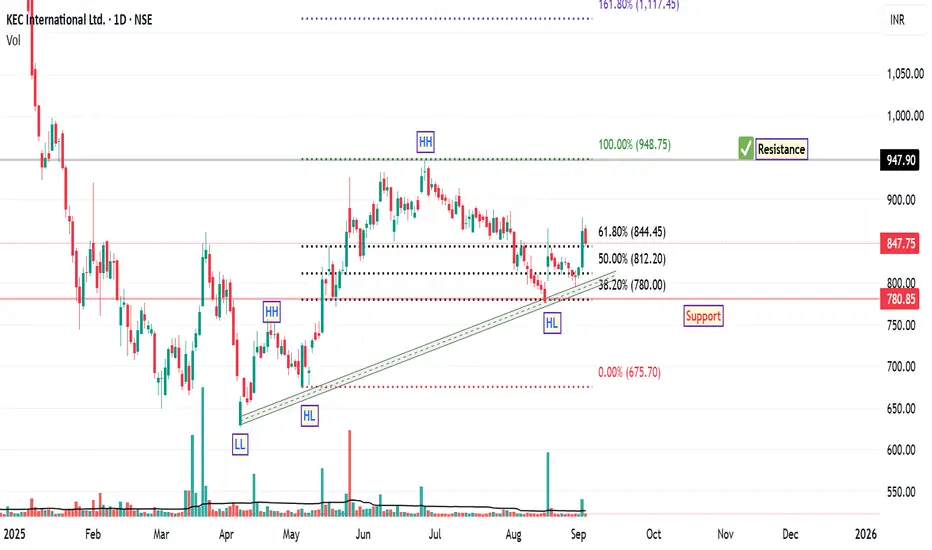
KEC International: Bullish Structure with StrengthSince April 7th, the price structure of KEC International has demonstrated a notable bullish trend reversal, characterized by the formation of higher highs and higher lows along an ascending trendline. This pattern is often interpreted by technical analysts as a sign of strengthening upward momentum.
A recent Fibonacci retracement, drawn from the swing low to the swing high of the current rally, revealed a pullback to the 38.2% level—a zone commonly viewed as a potential support area within a prevailing uptrend. The stock responded positively to this level, rebounding and subsequently closing above the 61.8% retracement level, which is another key technical threshold.
Interestingly, the price has retested the 61.8% level and held firm, suggesting that this area may be acting as a support base. Additionally, the stock has managed to close above its 200-day EMA, a long-term trend indicator that many market participants use to assess broader directional bias. A sustained position above the 200 EMA is generally considered constructive from a trend-following perspective.
From a structural standpoint, based on current chart dynamics, the next potential resistance zone appears to be near ₹948, while the suggested support level is around ₹780 . These levels are derived from historical price action and technical confluence zones, and may serve as reference points for monitoring future price behaviour.
Disclaimer: This analysis is intended solely for educational and informational purposes. It does not constitute investment advice or a recommendation to buy, sell, or hold any financial instrument. Market conditions are subject to change, and trading decisions should be made based on individual research, risk assessment, and consultation with a licensed financial advisor.
Bullish Finally we get triangle break out on this chart,now 3333 is very good support,my first short-term target is 3540
Some corrections visible at this level but trand is super bullish
My swing target is 3780 atleast and stoploss is 3333

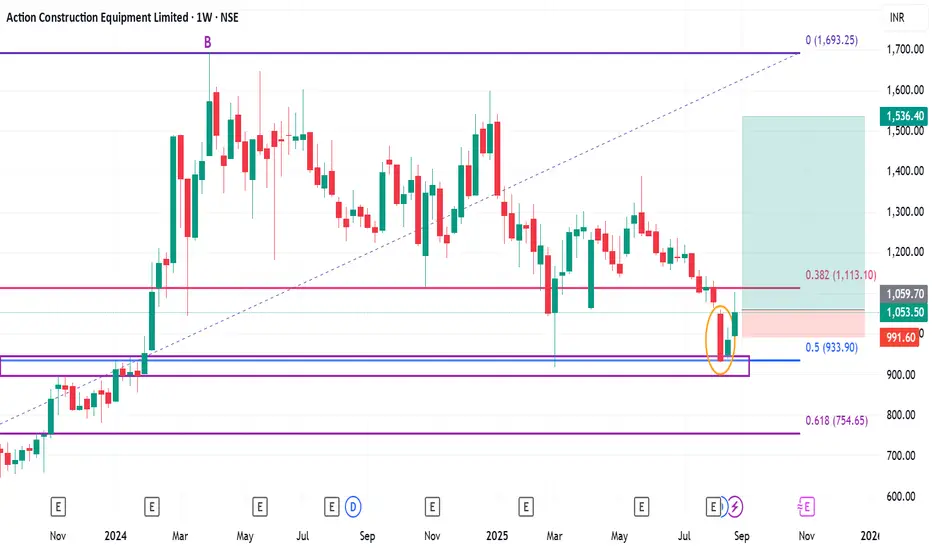
Positional or Long-term Opportunity in ACE Go Long @ 1059.7 for Targets of 1195.9, 1300, 1390, and 1536.4 with SL 991.6
Reasons to go Long :
1. On Weekly timeframe If we draw Fibonacci retracement from the recent swing low (A) to the swing high (B) then the stock took support from the 0.5 Fibonacci level.
2. In addition to this, the stock formed a Bullish Harami Pattern (marked with a orange color) around 0.5 Fibonacci level.
3. Also there is a strong demand zone from which the stock is taking support.
Bullish trend intact, waiting for PMI to spark the next waveCaptain Vincent – Gold Plan XAU/USD
1. Market Waves 🌍
The USD continues to weaken as investors grow more confident that the FED will cut rates in the coming months. With the greenback losing appeal, large flows are leaving cash and moving into safe-haven assets → gold stands out as the number one choice .
👉 This supports gold’s sustainable bullish trend . If USD selling pressure persists, the market could see fresh breakouts into year-end.
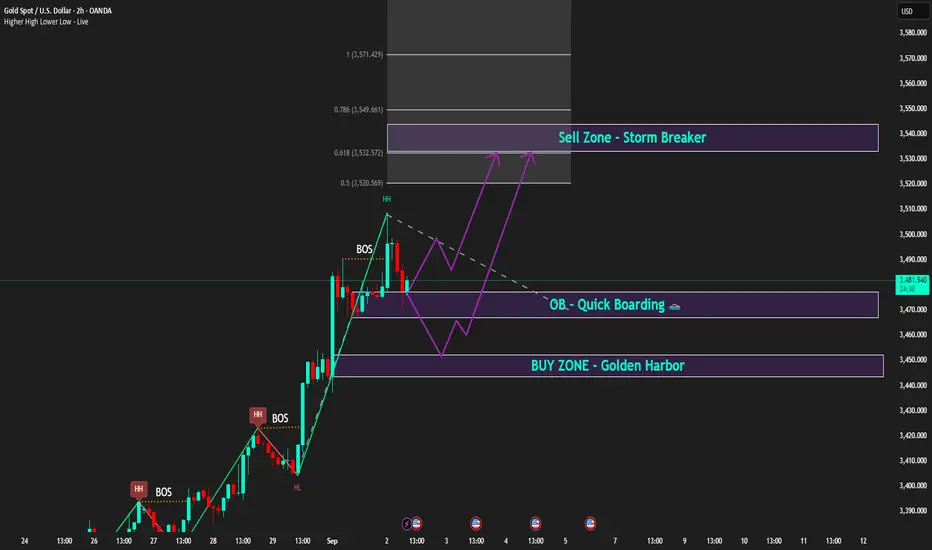
2. Technical Outlook ⚙️
H2 Chart: gold just created a Higher High after BOS , confirming bullish dominance.
Golden Harbor 🏝️ (Buy Zone 3,450 – 3,452): aligned with previous FVG , heavy liquidity zone.
Quick Boarding 🚤 (OB ~3,470): intermediate support, ideal for quick pullback entries.
Storm Breaker 🌊 (Sell Zone 3,538 – 3,540): resistance at Fibo 0.618 – 0.786 , strong chance of profit-taking if tested.
Intraday bias: Wait for pullback to Buy. Short-term Sell only if price hits Storm Breaker.
3. Captain Vincent’s Map – Key Levels 🪙
Golden Harbor 🏝️ (Buy Zone): 3,450 – 3,452
Quick Boarding 🚤 (OB Support): 3,470
Storm Breaker 🌊 (Sell Zone): 3,538 – 3,540
4. Trade Scenarios 📌
🔺 Golden Harbor 🏝️ (BUY – Priority)
Entry: 3,450 – 3,452
SL: 3,444
TP: 3,455 → 3,458 → 3,462 → 3,465 → 34xx
🔻 Storm Breaker 🌊 (SELL Reaction)
Entry: 3,538 – 3,540
SL: 3,548
TP: 3,535 → 3,532 → 3,529 → 35xx
5. Captain’s Note ⚓
“The gold sail is still filled with bullish wind, but Storm Breaker 🌊 above may create counter waves. Stay patient at Golden Harbor 🏝️ for precise entries, and watch the PMI at 21:00 – the catalyst for the next wave.”
BSE Ltd – Corrective W–X–Y In ProgressThe previous impulsive wave topped at ₹3030, marking an all-time high.
Since then, the structure has unfolded as a W–X–Y corrective double three. The market is now progressing within Wave Y, with Wave (a) already driving price down to ₹2090.
For Wave (b), watch for price rejection either at the midline of the channel or the upper boundary. A rejection from these levels should lead Wave (c) lower, targeting the 0.5–0.618 retracement zone between ₹2128 and ₹1915, where Wave Y may complete.
RSI is oversold and continues to print lower lows, showing no bullish divergence yet — momentum still favors the bears.
Bearish invalidation sits at ₹2550 — any sustained move above this would negate the immediate bearish view.
Disclaimer: This analysis is for educational purposes only and does not constitute investment advice. Please do your own research (DYOR) before making any trading decisions.

Multi-Confirmation Price Action: Fibonacci Zones, Base BreakoutsExplore multi-confirmation techniques using Fibonacci retracement to identify high-probability base breakout zones. Learn how to spot double bottom and inverted head & shoulders patterns at demand levels and execute confirmation trades for precision entries

Gold consolidates as new alliances emerge | Captain Vincent 1. News Wave 🌍
At the two-day summit in Shanghai, Prime Minister Modi and President Xi Jinping announced that India and China will become development partners rather than competitors.
The meeting also included Russia and four Central Asian nations, aiming to form a Southern Hemisphere bloc to counterbalance the US and the West.
👉 This signals a shift in geopolitical power, heightening concerns of global polarization → Gold continues to hold its safe-haven position.
2. Technical Analysis ⚙️
On the H2 chart, Gold has formed a Higher High after the recent strong breakout.
Storm Breaker 🌊 (Sell Zone 3511 – 3518): Strong resistance, potential for supply if price retests.
Golden Harbor 🏝️ (Buy Zone 3450 – 3448): Confluence with FVG + Fibonacci 0.5/0.618, a key support for pullback entries.
Main Trend: Gold likely to move sideways between 3450 – 3510 before choosing a major direction.
3. Captain Vincent’s Map – Trade Scenarios 🪙
🔻 Storm Breaker 🌊 (SELL Reaction)
Entry: 3511 – 3508
SL: 3518
TP: 3505 → 3500 → 3497 → 349x → 348x
🏝️ Golden Harbor (BUY Zone – Strong Support)
Entry: 3450 – 3448
SL: 3440
TP: 3453 → 3456 → 3459 → 3462 → 346x
4. Captain’s Note ⚓
"Political news continues to stir the golden sea 🌊. Bears are waiting at Storm Breaker 3511, but the safe harbor remains Golden Harbor 3450 – 3448. In such unpredictable waters, prioritise short-term sells to flow with safe-haven demand, rather than recklessly facing the storm."

Captain Vincent | Gold holds 3400, breakout or pullback next?” FED turns dovish, Gold challenges a new Storm Breaker
1. News Wave 🌍
FED – Waller: “Tariffs are a kind of tax and do not increase inflation. I’m back with the ‘transitory team’ on inflation.”
👉 A clear dovish hint supporting a 25bps rate cut in September, with potential for 1–2 more cuts in the next 3–6 months.
US Senate: Hearing scheduled on Sept 4th for FED nominee S. Miran → Political–monetary spotlight.
Tonight: Market awaits PCE data, FED’s preferred inflation measure.
➡️ Summary: FED leaning dovish = mid-term bullish for Gold.
But short-term, Gold faces profit-taking pressure near resistance.
2. Technical Outlook ⚙️
On H1, Gold has repeatedly formed bullish BOS and crossed above 3,400.
Golden Harbor 🏝️ (Buy Zone 3375 – 3373): Large volume accumulation, aligned with FVG → Attractive entry if price pulls back.
Storm Breaker 🌊 (Sell Zone 3432 – 343x): At old ATH zone, high probability of supply pressure if tested.
Key Levels:
3,375 → Critical support “anchor”.
3,438 → Resistance target if bullish momentum continues.
3. Captain Vincent’s Map – Trade Scenarios 🪙
🔺 Golden Harbor 🏝️ (BUY Zone – Priority)
Entry: 3375 – 3373
SL: 3365
TP: 3378 → 3381 → 3384 → 3387 → 33xx
🔻 Storm Breaker 🌊 (SELL Zone – Old ATH Reaction)
Entry: 3432 – 343x
SL: 3442
TP: 3428 → 3425 → 3423 → 3420 → 33xx
4. Captain’s Note ⚓
"The Gold ship has sailed past 3400, but Storm Breaker 🌊 at 343x remains a tough challenge. If corrective waves appear, patiently wait at Golden Harbor 🏝️ to board for a more bullish September journey."

#Nifty may see fall on Monday?Nifty appears to be in its minuette wave 4 and may resume its downtrend move on September 1 to complete wave 5.

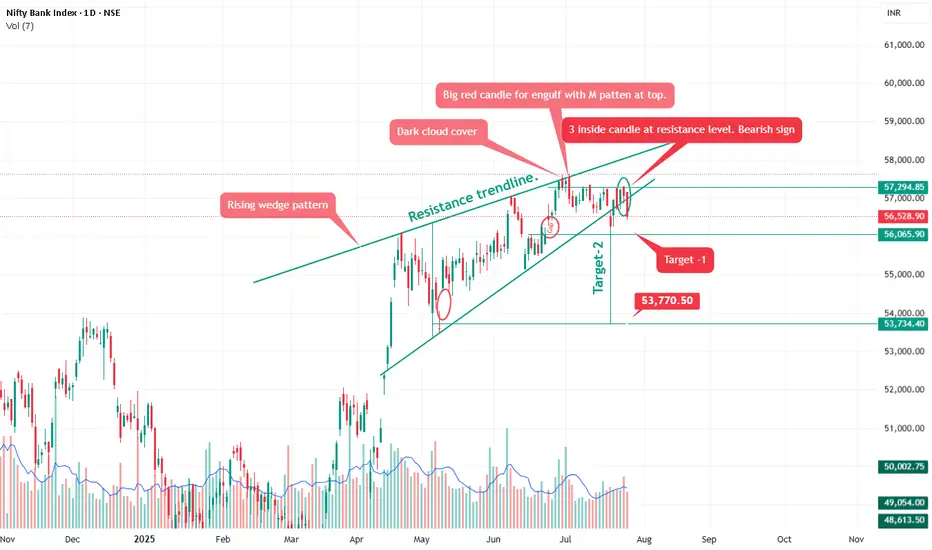
Bank nifty Rising wedge pattern.Pattern Analysis
Rising Wedge Pattern:
A bearish pattern typically seen near tops. It shows narrowing price movement with higher highs but declining momentum.
Breakdown confirmed as price has fallen below the lower wedge support trendline.
Confirms selling pressure and rejection from the top near 57,300–57,500 zone.
🕯️ Candlestick Signals
Dark Cloud Cover:
A bearish reversal pattern indicating sellers have taken control after a bullish phase.
Big Red Candle + ‘M’ Pattern:
Bearish engulfing at resistance – strong indication of a top formation.
3 Inside Down Candlestick Pattern at Resistance:
Recent red candles have higher volume, confirming institutional selling activity.
As anticipated in our previous analysis, Bank Nifty corrected from the 57,000 level to 56,056, validating the bearish setup.
It is also expected to short here 56,550 add on any rise up to 57,700-57,950 for target mentioned on chart.
Alternative Scenario: Be aware that the rising wedge could potentially break upwards. If the price breaks decisively above the resistance trendline with strong volume, the bearish outlook would be invalidated.
Fibonacci Trailing : Lock Profits & Ride Trends [BANKNIFTY]🔹 Intro / Overview
Managing trades after entry is just as critical as spotting the entry itself.
In this idea, we apply Fibonacci retracements with a trailing stop system to capture profits while staying disciplined.
A well-structured trailing plan helps traders:
✅ Lock in gains early
🛡️ Protect capital against reversals
📊 Stay rule-based instead of emotional
📈 In this case study, BANKNIFTY aligned well with Fibonacci retracement levels , showcasing how these concepts can work in practice as an educational example.
---
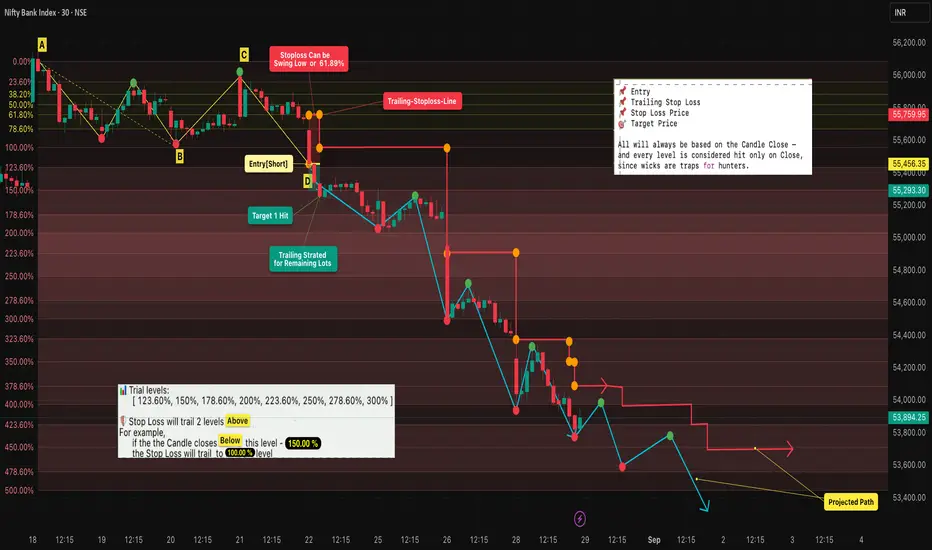
📖 Concept
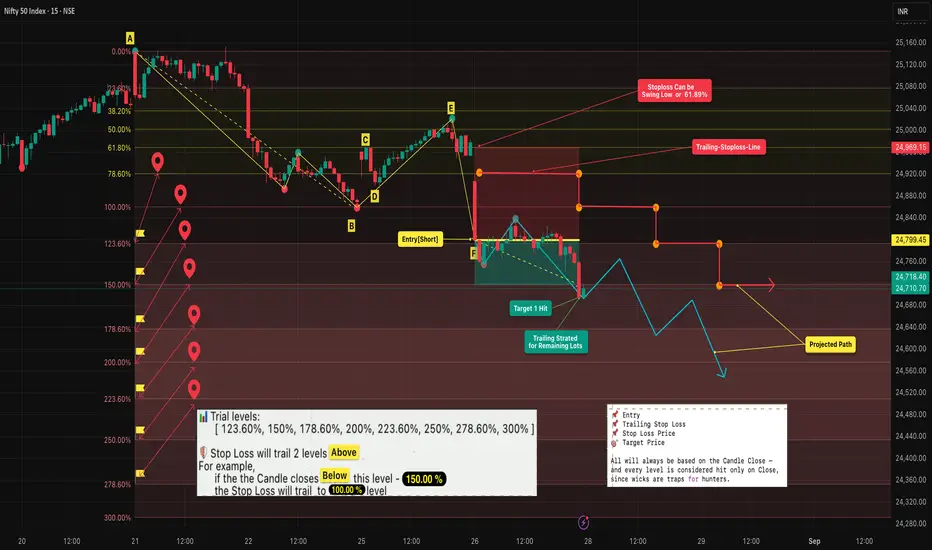
- A swing High (A) to Low (B) defines our Fibonacci retracement zones.
- Retracements (C) test Fibonacci levels but don’t confirm entry until structure is validated.
- Entry (D) occurs only after a successive close confirms the short trade.
- Stop Loss (SL) is placed at the 61.8% retracement (closer and more protective than the far swing).
- Trailing: SL trails forward only , two Fib levels behind price. It manages the remaining position after booking partial profits.
---
📊 Chart Explanation (Step-by-Step)
1️⃣ Swing Definition
📍 A = Swing High
📍 B = Swing Low
2️⃣ Retracement Testing
- C → first retracement (no confirmation) - Here there's a retracement but due to the candle closes below the 38.20% level so devalidation doesn't occured.
3️⃣ Entry Point
✅ At D, successive closes confirm → short entry taken
4️⃣ Stop Loss (SL)
📉 Set at 61.8% retracement for tighter risk management
5️⃣ Targets & Trailing
🎯 Target 1 hit → exit one lot, secure partial profits
🔄 Remaining lots managed with trailing system:
• SL adjusted only forward , never backward
• SL trails as price moves down:
• 150% → SL to 100%
• 178.6% → SL to 123.6%
• 200% → SL to 150%, etc.
6️⃣ Projected Path
🔍 Blue/red paths illustrate how price could move while trailing locks in gains
---
🔍 Observations
📌 Entry validated on structure → reduces false signals
🎯 Booking partial profits builds confidence and ensures realized gains
🔄 Trailing maximizes potential while staying safe
📊 Fib-based progression keeps decisions mechanical, not emotional
---
✨ Why It Matters
✔ Turns static Fibonacci into a dynamic strategy
✔ Prevents giving back profits when trends reverse
✔ Adds confidence and discipline in trade management
✔ Teaches how to scale out smartly
---
✅ Conclusion
Fibonacci retracement alone gives levels — but combining it with a trailing stop system transforms it into a complete trade plan.
By booking partial profits and trailing the rest:
🛡️ You protect capital
🚀 You ride trends longer
🤝 You trade with discipline instead of emotion
---
⚠️ Disclaimer
For educational purposes only · Not SEBI registered · Not a buy/sell recommendation · No investment advice — purely a learning resource
Gold Plan (28/08) – Ahead of 3,400: Breakout or Correction to ??XAU/USD – Gold hits Storm Breaker 3400: Accumulation before breaking ATH?
1. Market Wave 🌍
Throughout last week, Gold continuously formed BOS (Break of Structure) , confirming that buyers remain in control.
Currently, price is consolidating around 3,394 – 3,400, right at the Storm Breaker 🌊 , the crucial barrier before heading towards the old ATH at 3,424.
The key question: Will Gold accumulate here and smash through ATH, or will it need a pullback to safe harbors before a strong rally in September?
2. Technical Analysis ⚙️
Storm Breaker 🌊 (Strong Resistance): 3400 – 3424 (old ATH). The gateway Gold must conquer to open a new bullish leg.
Golden Harbor 🏝️ (Key Support): 3375 – 3355 – 3330. Confluence with FVG + Fibonacci 0.5/0.618 , likely to attract liquidity if price corrects.
Short-term scenario: Price may pull back to Golden Harbor before breaking higher.
3. Captain Vincent’s Map – Trade Scenarios 🪙
🔺 Quick Boarding 🚤 (BUY Scalp – Rebound Priority)
Entry: 3353 – 3355
SL: 3349
TP: 3356 → 3359 → 3361 → 33xx
🔻 Storm Breaker 🌊 (SELL Reaction – Old ATH)
Entry: 3422 – 3424 (if tested)
SL: 3430
TP: 3419 → 3415 → 3410 → 3405 → 33xx
4. Captain’s Note ⚓
"The Gold ship is now pressing against Storm Breaker 🌊 3400 – 3424 . If it breaks through, the vast ocean opens a new trend. But if the waves push back, patiently wait at Golden Harbor 🏝️ to anchor and catch the September tide."

USD/CHF 15M Long SetupMarket washed out weak hands, now sitting at demand with liquidity grabbed.
Entry locked, risk defined — if this runs, bears will be forced to cover at higher levels.
Discipline over prediction.

Bullish Finally we have a break out with huge volume,now it's buying on every dips till 5900
My nearest target is atleast 6500 zone
If stock didn't sustain 5900 clb , then we can say breckout failure
This week closing is very very important

Gold Plan 27/08 – Captain Vincent (IN)XAU/USD – Trump strengthens control over the FED, Gold consolidates near Storm Breaker
1. News Wave 🌍
Trump: “We will soon have majority control at the FED. Miran may be moved to another position with a longer term.”
Trump: “I already have a candidate in mind to replace FED Governor L. Cook.”
US Senate: Preparing hearings next week for Trump’s nominee – S. Miran .
👉 Message: Trump is consolidating power within the FED. Market fears FED losing independence → USD volatility rises, Gold benefits from safe-haven flows .
2. Technical Outlook ⚙️
Gold is approaching Storm Breaker 🌊 (3400 – 3402) , overlapping with resistance 3392 – 3406 → profit-taking likely .
On H1, multiple FVGs remain unfilled around 3355 & 3330 → Price may correct to retest these supports before choosing direction.
Intraday bias: Range-bound → Sell at resistance, short Buy at supports.
3. Captain Vincent’s Map – Key Levels 🪙
Resistance (Kháng cự):
3406 – 3400 – 3392 (Storm Breaker 🌊)
Support (Hỗ trợ):
3372 (Minor Shield 🛡️)
3355 (Quick Boarding 🚤 – Buy Scalp Zone)
3344 (Intermediate Shield 🛡️)
3330 (Golden Harbor 🏝️ – Main Buy Zone)
4. Trade Scenarios 📌
🔻 SELL at Storm Breaker 🌊 (Priority)
Entry: 3400 – 3402
SL: 3408
TP: 3395 → 3393 → 3389 → 3386 → 33xx
🚤 BUY Scalp – Quick Boarding
Entry: 3353 – 3355
SL: 3345
TP: 3358 → 3361 → 3363 → 33xx
🏝️ BUY at Golden Harbor (Strong Support)
Entry: 3330 – 3332
SL: 3325
TP: 3335 → 3338 → 3341 → 33xx
5. Captain’s Note ⚓
"Gold today faces Storm Breaker 🌊 above, but multiple shields of support remain below. Smart traders will scalp quickly at Quick Boarding 🚤, or patiently wait for Golden Harbor 🏝️ to anchor safely."

Fibonacci Retracement Trailing : Lock Profits & Ride Trends🔹 Intro / Overview
Managing trades after entry is just as critical as spotting the entry itself.
In this idea, we apply Fibonacci retracements with a trailing stop system to capture profits while staying disciplined.
A well-structured trailing plan helps traders:
✅ Lock in gains early
🛡️ Protect capital against reversals
📊 Stay rule-based instead of emotional
---
📖 Concept
- A swing High (A) to Low (B) defines our Fibonacci retracement zones.
- Retracements (C, E) test Fibonacci levels but don’t confirm entry until structure is validated.
- Entry (F) occurs only after a successive close confirms the short trade.
- Stop Loss (SL) is placed at the 61.8% retracement (closer and more protective than the far swing).
- Trailing: SL trails forward only , two Fib levels behind price. It manages the remaining position after booking partial profits.
---
📊 Chart Explanation (Step-by-Step)
1️⃣ Swing Definition
📍 A = Swing High
📍 B = Swing Low
2️⃣ Retracement Testing
- C → first retracement (no confirmation)
- D → invalid as no proper close
- E → deeper retracement, still no entry
3️⃣ Entry Point
✅ At F, successive closes confirm → short entry taken
4️⃣ Stop Loss (SL)
📉 Set at 61.8% retracement for tighter risk management
5️⃣ Targets & Trailing
🎯 Target 1 hit → exit one lot, secure partial profits
🔄 Remaining lots managed with trailing system:
• SL adjusted only forward , never backward
• SL trails as price moves down:
• 150% → SL to 100%
• 178.6% → SL to 123.6%
• 200% → SL to 150%, etc.
6️⃣ Projected Path
🔍 Blue/red paths illustrate how price could move while trailing locks in gains
---
🔍 Observations
📌 Entry validated on structure → reduces false signals
🎯 Booking partial profits builds confidence and ensures realized gains
🔄 Trailing maximizes potential while staying safe
📊 Fib-based progression keeps decisions mechanical, not emotional
---
✨ Why It Matters
✔ Turns static Fibonacci into a dynamic strategy
✔ Prevents giving back profits when trends reverse
✔ Adds confidence and discipline in trade management
✔ Teaches how to scale out smartly
---
✅ Conclusion
Fibonacci retracement alone gives levels — but combining it with a trailing stop system transforms it into a complete trade plan.
By booking partial profits and trailing the rest:
🛡️ You protect capital
🚀 You ride trends longer
🤝 You trade with discipline instead of emotion
---
⚠️ Disclaimer
For educational purposes only · Not SEBI registered · Not a buy/sell recommendation · No investment advice — purely a learning resource