Gold preparing for correction under FED & geopolitic - Vincent🟡 Gold Plan 25/08 – Captain Vincent ⚓
1. Market Context 🌍
Russia – Ukraine: Trump puts pressure on Putin to negotiate within 2 weeks. This looks positive for peace, but also carries escalation risks → Gold keeps its safe-haven role .
FED – Powell at Jackson Hole: Hawkish tone reduced expectations of a September rate cut from 3 to 2. USD strengthened → short-term downside pressure on Gold .
👉 Mix of political support vs FED pressure → Sideways market, Gold may need a pullback to absorb liquidity before showing clear direction.
2. Technical Outlook ⚙️
H4 candle closed bearish → Buying momentum weakens , sellers may return.
Recent FVG created after sharp bounce → Likely pullback for liquidity grab .
Bias of the day: Prioritise Sell, but short Buy Scalp setups possible at support.
3. Key Levels – Captain Vincent’s Map 🪙
Resistance:
Storm Breaker 🌊 (Sell Zone 3398 – 3400)
3376 (intermediate resistance – watch reaction)
Support:
Quick Boarding 🚤 (Buy Scalp 3340 – 3342)
SL: 3333
TP: 3345 → 3349 → 3353 → 3357 → 33xx
Golden Harbor 🏝️ (Buy Zone 3328 – 3326)
SL: 3318
TP: 3332 → 3336 → 3339 → 33xx
Higher Low – 3323
Anchor point of the trend → If broken, need to reassess all Buy setups.
4. Trade Scenarios 📌
🔻 Sell at Storm Breaker 🌊
Entry: 3398 – 3400
SL: 3408
TP: 3395 → 3390 → 3387 → 3384 → 33xx
🚤 Buy Scalp at Quick Boarding
Entry: 3340 – 3342
SL: 3333
TP: 3345 → 3349 → 3353 → 3357 → 33xx
🏝️ Buy at Golden Harbor (3328 – 3326)
SL: 3318
TP: 3332 → 3336 → 3339 → 33xx
5. Captain’s Note ⚓
"Today, the golden sea is full of undercurrents: FED winds blow against, politics push along. Those who pick Storm Breaker 🌊 may ride the wave safely; those who patiently wait at Golden Harbor 🏝️ will find peace. Quick Boarding 🚤 is for sailors seeking fast scalps in narrow waters."
Fibonacci

Positional or Long-term Opportunity in Apollo Tyre Go Long @ 469.8 for Targets of 502.8, and 568.8 with SL 436.8
Reasons to go Long :
1. On weekly timeframe stock gave Trendline breakout (marked with red color).
2. If we draw Fibonacci retracement from the recent swing low (A) to the swing high (B) then the stock took support from the 0.618 Fibonacci level.
3. In addition to this, there is a strong demand zone (marked with purple color) from which the stock took support.

Tilaknagar: Retracement Zones in Focus After 5-Wave RallyTilaknagar rallied from ₹199.53 to ₹529.90 , completing a clean 5-wave impulse. The move stretched right into the 1.618 Fib extension (₹508.95) and was accompanied by RSI bearish divergence, hinting at exhaustion.
With the Wave 1 top confirmed at ₹529.90 , a corrective Wave 2 is expected. The ideal retracement zone sits between ₹403.70 (0.382) and ₹364.70 (0.5) . Price action into this zone will be key to assessing the next leg.
⚠️ Bearish invalidation level: A close above ₹529.90 invalidates the correction view and opens the door to an extended Wave 3 instead.
In short:
Holding below 529.90 → corrective Wave 2 towards 403–364.
Breakout above 529.90 → Wave 3 extension continues.
Disclaimer: This analysis is for educational purposes only and does not constitute investment advice. Please do your own research (DYOR) before making any trading decisions.

NIFTY About to crash? H&S Breakdown?After buying rallying from 21743 to 25669 Nifty 50 is showing LL LH formation.
A Head & Shoulders (H&S) pattern on the daily charts is being formed. The right shoulder just got rejected at the same zone where the left shoulder was formed.
Lower High formation: The Previous high of 25250 is not breached, and a new lower high formed at 25150.
H&S Pattern visible: Head at ~25669, shoulders around ~25200. Base of H&S can be considered at 24450.
H&S Target: Possible downmove of 1200 points (distance from base to head) downside till 23250 . Consequently, this is also a 61.8% retracement of the full buying rally
Weekly Gap Pending: 24600–24630 is the first target due to the gap.
Next big support: 24000, which is a psychological round number + pending gap. This is a likely bounce area if 24,450 doesn’t hold.
More support:
23750: 50% Fibonacci level of buying trend
22830: Weekly gap

Glenmark bullishGap filled and there's a previous resistance at 1830 which can act as a support and push the price.
Buy at cmp or in the range of 1830 - 1855 for targets 2140 & 2675. (Sl 1625, if you want)

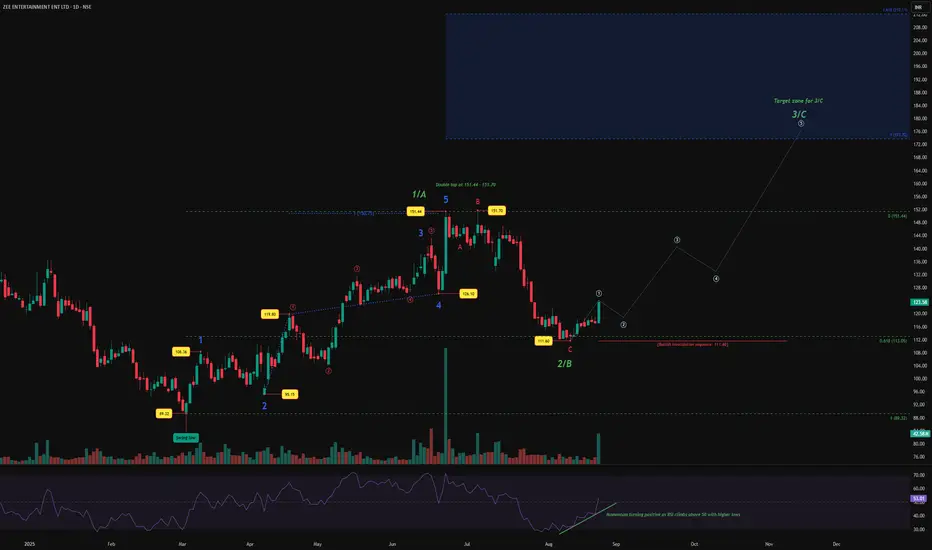
Zee Entertainment – Wave 3/C on the Horizon?After topping near 151.44–151.70 (a neat double top), price corrected into 111.60 , completing what looks like Wave 2/B right around the 0.618 retracement.
Now, signs of life are emerging:
Volume has ticked higher, hinting at accumulation.
RSI is forming higher lows and has regained strength above 50.
The structure is shaping up for a fresh impulsive advance toward the 173–212 zone (1.0–1.618 extension).
The path higher is expected to unfold as a 5-wave sequence, with Wave 3/C potentially targeting this blue zone overhead.
⚠️ Invalidation: A sustained move below 111.60 would negate this bullish sequence, opening the door for deeper correction.
Disclaimer: This analysis is for educational purposes only and does not constitute investment advice. Please do your own research (DYOR) before making any trading decisions.
Ethereum 21-Aug-2025 PredictionAs Shown in the chart, the box at the bottom was the level to be tested and the swing should change from here onwards. Target would be the Box on the Top of the Chart. Positive for a 150 point move.


S&P 500 MARKET SHIFT BEARISHmarket shifted to bearish next liquidity zone is 6300 may be market draw on this price

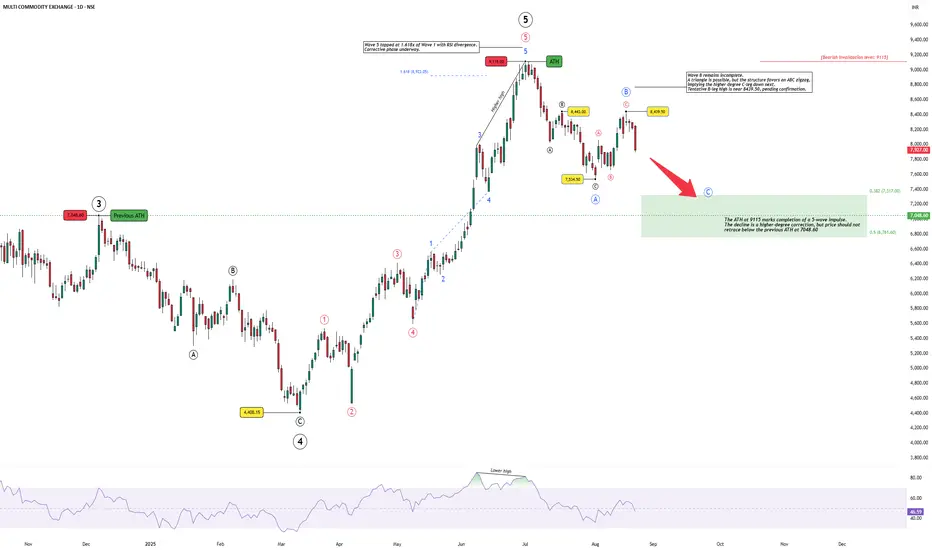
MCX: A Higher-Degree Correction Begins After Wave 5 TopThe rally in MCX reached its climax at 9115, which now marks the completion of a full 5-wave impulse sequence. Wave 5 stretched to 1.618x of Wave 1 and was accompanied by RSI divergence, a classic signal of exhaustion. This makes the top at 9115 significant, not just as an all-time high, but as the end of a higher-degree cycle.
From here, the market is unfolding into a higher-degree corrective phase. The immediate decline from the top appears corrective in nature, with an incomplete Wave B still in progress. While a triangle remains a possibility, the structure currently favors a simple ABC zigzag, implying that a C-leg down may follow.
The important level to watch is 7048.60, the previous ATH. Price should ideally hold above this zone to preserve the broader impulsive character of the rally. A sustained move below it would weaken the bullish outlook and raise the risk of a deeper correction.
At the same time, 9115 now serves as the bearish invalidation level. If price were to break above this peak, it would negate the current corrective view and open the possibility of a new bullish sequence unfolding.
In summary, the long-term uptrend has reached a natural pause. The near-term focus will be on how the correction develops — whether 7048.60 can provide support or whether the corrective leg extends deeper, with 9115 acting as the critical line in the sand for bearish continuation.
Disclaimer: This analysis is for educational purposes only and does not constitute investment advice. Please do your own research (DYOR) before making any trading decisions.
TRENT – Swing Analysis (Daily TF)📊 TRENT – Swing Analysis (Daily TF)
Buy Zone: AT CMP
Stop Loss: Below 5160 (recent swing low / key support).
Target 1 – 6270+
Target 2 – 7500+
Target 3 – 8380+

Positional or Long Term Opportunity in Minda CorpGo Long @ 500.55 for Targets of 539.1, 577.65, and 616.2 with SL 462
Reasons to go Long :
1. On Weekly timeframe If we draw Fibonacci retracement from the recent swing low (A) to the swing high (B) then the stock took support from the 0.5 Fibonacci level.
2. In addition to this, the stock formed a Bullish Engulfing Pattern (marked with a orange color) around 0.382 Fibonacci level.
3. Also there is a strong demand zone from which the stock took support.

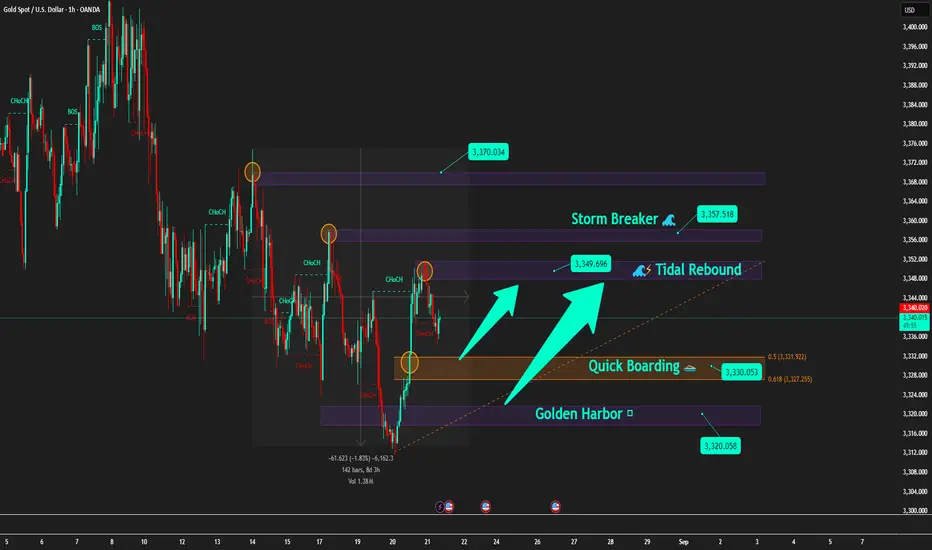
Gold after FOMC: Just a pullback or the start of a new wave?[Background
After the early morning FOMC session , Gold is showing signs of a sell-side pullback to gain momentum.
On higher timeframes (H4–D1), the structure remains bearish with lower highs .
However, consistent buying pressure around 3320 – 3330 keeps this zone as the key battlefield .
🪙 Key Levels Today
🔹 Storm Breaker 🌊 (Sell Zone 3357 – 3355)
SL: 3362
TP: 3350 → 3345 → 3340 → 33xx
🔹 Tidal Rebound 🌊⚡ (Sell Scalp 3349 – 3347)
SL: 3353
TP: 3345 → 3340 → 3335 → 33xx
🔹 Quick Boarding 🚤 (Buy Scalp 3330 – 3328)
SL: 3322
TP: 3335 → 3337 → 3339 → 3341
🔹 Golden Harbor 🏝️ (Buy Zone 3320)
SL: 3313
TP: 3325 → 3330 → extend further
📌 Trading Scenarios
After FOMC, the market may show rebound waves .
During Asia–Europe, price may consolidate between 3345 – 3357 .
If price tests Storm Breaker 🌊 → Prioritise Sell setups in line with the main bearish trend.
If price drops to Quick Boarding 🚤 or Golden Harbor 🏝️ → Short-term Buy scalps on pullback moves.
📰 Market Context
FED remains dovish leaning , with high probability of a rate cut in September (~82%, CME FedWatch) .
Geopolitical variables (Trump–Putin, Ukraine) remain unpredictable and may spark sudden volatility.
⚓ Captain’s Note
"Let Storm Breaker 🌊 test the buyers’ strength. Those who board at Golden Harbor 🏝️ will be lifted by the waves, but those who drift into the storm will soon feel the sea’s fury."
Gold 21-Aug-25 PredictionAs shown in the Chart, Gold should complete the levels on the Bottom and then show a reversal from there. Potential move of 1% in Gold from Bottom to Top is what I am expecting.

VEDANTA Swing Trade with 1:3 RR (Long)Sellers failed to take price below the demand zone and a clear Change of Character (market structure shift) happened that shows buyers have taken control of the price of Vedanta.
So if Nifty and Metal sector are not bearish in coming sessions, then it is high probability that Vedanta will touch Rs 475.
Don't use hard SL. Manage position sizing as it is a high probability setup.
Connect with me if you have any questions. I am happy to help.
ChoCh - Change of Character
Sw or Sweep - Liquidity Sweep
BoS - Break of Structure

Trailing Stops: Protect Profits & Ride the Trend with Discipline🔹 Intro / Overview
Managing a position after entry is just as important as identifying the entry itself.
Here, we are specifically discussing trailing stops using Fibonacci retracements .
A well-structured trailing stop helps traders:
✅ Lock in profits
🛡️ Reduce risk
📊 Stay objective in the face of market noise
This idea shows how trailing stops can be applied in a structured way to complement Fibonacci retracements and trend management.
📖 Concept
📍 A trailing stop is a dynamic stop-loss that adjusts as price moves in your favor.
🔄 Instead of staying fixed, it “trails” price at a chosen distance — capturing more upside while capping downside.
🧩 Traders often trail stops using swing lows/highs, moving averages, or volatility measures like ATR .
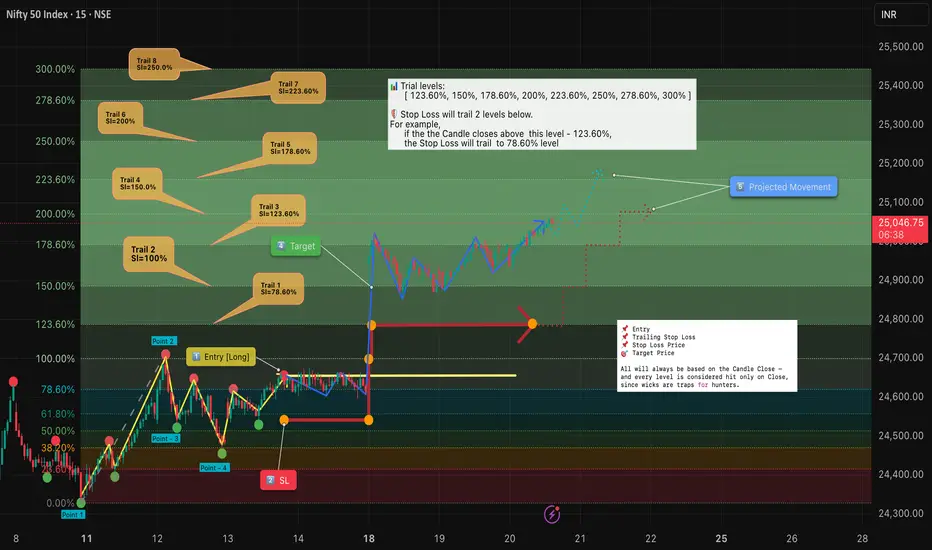
📊 Chart Explanation (Step-by-Step)
1️⃣ Entry Criteria
✅ Successive closes above 78.6% confirm the long entry.
2️⃣ Stop Loss (SL)
📉 Placed at the previous swing low for structure-based protection.
⏩ SL adjustments move forward only with trailing rules — never backward.
3️⃣ Trailing Levels
👉 SL always trails two levels below the current trail level if the candle closes above it.
📈 Trail 1: 123.60% → SL moves to 78.60%
📈 Trail 2: 150.00% → SL moves to 100.00%
📈 Trail 3: 178.60% → SL moves to 123.60%
📈 Trail 4: 200.00% → SL moves to 150.00%
📈 Trail 5: 223.60% → SL moves to 178.60%
📈 Trail 6: 250.00% → SL moves to 200.00%
📈 Trail 7: 278.60% → SL moves to 223.60%
📈 Trail 8: 300.00% → SL moves to 250.00%
4️⃣ Target Points
🎯 At Target 1 , book one lot to secure profits.
📊 Remaining positions can be trailed further with the next levels.
5️⃣ Projected Path
🔍 Dotted blue/red projections illustrate potential movement under this trailing system.
🔍 Observations
📌 Objective Entry : Requires successive closes above 78.6%, reducing false signals.
🎯 Partial Profit Booking : Taking one lot off at Target 1 ensures realized gains.
🔄 Two-Level Trailing : Locks in profits while leaving room for trend continuation.
📊 Rule-Based Framework : Clear Fibonacci-based progression keeps decisions mechanical and consistent.
✨ Why It Matters
✔ Prevents turning winning trades into losers.
✔ Builds confidence by removing emotions from exit decisions.
✔ Lets profits run while maintaining protection.
✅ Conclusion
Trailing stops are not about perfection — they’re about discipline .
By systematically adjusting stops as the market moves, traders:
🛡️ Protect capital
🚀 Let profits run
🤝 Remove emotions from decision-making
When combined with Fibonacci retracements , trailing stops provide a structured framework to manage trades effectively after entry.
⚠️ Disclaimer : For educational purposes only · Not SEBI registered · Not a buy/sell recommendation · No investment advice — purely a learning resource
GOLD PLAN – Captain Vincent🏴☠️ GOLD PLAN – Captain Vincent ⚓
Background
After the Nonfarm payrolls, Gold created a Captain’s Liquidity Void (large imbalance zone). Price has now almost completely filled this gap.
On higher timeframes, Gold still maintains a Lower High – Lower Low structure, confirming that sellers remain in control .
However, during the Asian & European sessions, we usually see technical pullbacks to collect liquidity – those moves will be our chance to enter in line with the main direction.
📍 Key Levels for Today
🔹 Captain’s Trap Zone (3330 – 3332)
Confluence of Fibo 0.5 – 0.618 and trendline breakout.
Main SELL setup at this zone.
SL: 3336 – 3338
TP: 3325 → 3320 → 3315 → 33xx
🔹 Captain’s Quick Shot (3313)
Nonfarm breakout zone , heavy SELL volume.
Suitable for short BUY scalp if price reacts strongly.
SL: 3308
TP: 3318 → 3322 → 3326
🔹 Captain’s Safe Harbor (3300 – 3302)
Start of previous bullish leg, strongest support of the day .
If Quick Shot breaks, this becomes the main BUY accumulation zone .
SL: 3293
TP: 3305 → 3310 → 3315 → 33xx
🔹 Captain’s Shield (3313)
If held multiple times → becomes a short-term key support .
⚡ Trading Scenarios
Sell Priority : Short at Captain’s Trap Zone.
Quick Buy : Scalp around Captain’s Quick Shot if sharp reaction.
Breakdown : If 3313 fails → Buy at Safe Harbor (3300 – 3302).
📌 Captain’s Reminder
SELL bias is still dominant → Do not FOMO buy without clear signals.
The US session may bring high volatility from geopolitical headlines. Manage your capital with discipline.

Coal India trade based on open = high theory
observations:-
recent trend has been upside
yesterday's candle made open = high, making it suitable to take up the short
target marked p 377, 371 based on Fibo levels
stop 386
lets enjoy this short trade

Hero MotoCorp: Wave 1/A Hits Key Target ZoneHero MotoCorp has been advancing strongly from its March 2025 lows. The rise has unfolded as a clear 5-wave move, now labeled as Wave 1/A, which has just entered its 100.0%–161.8% extension zone of Minor Wave 1.
Along the way, Wave 4 held support at the 38.2% retracement of Wave 3 , confirming the impulsive structure. RSI is now in the overbought zone, hinting that this leg may be nearing exhaustion.
Looking ahead, two scenarios emerge:
If this rally is Wave 1 , the next step would be a corrective Wave 2 pullback before a strong Wave 3 rally .
If it is instead Wave A , then a Wave B retracement could follow before a final Wave C push higher .
Either way, the immediate focus should be on how price reacts inside this blue target zone. A correction (Wave 2/B) is the natural expectation, with the larger 3/C rally still on the horizon.
Disclaimer: This analysis is for educational purposes only and does not constitute investment advice. Please do your own research (DYOR) before making any trading decisions.

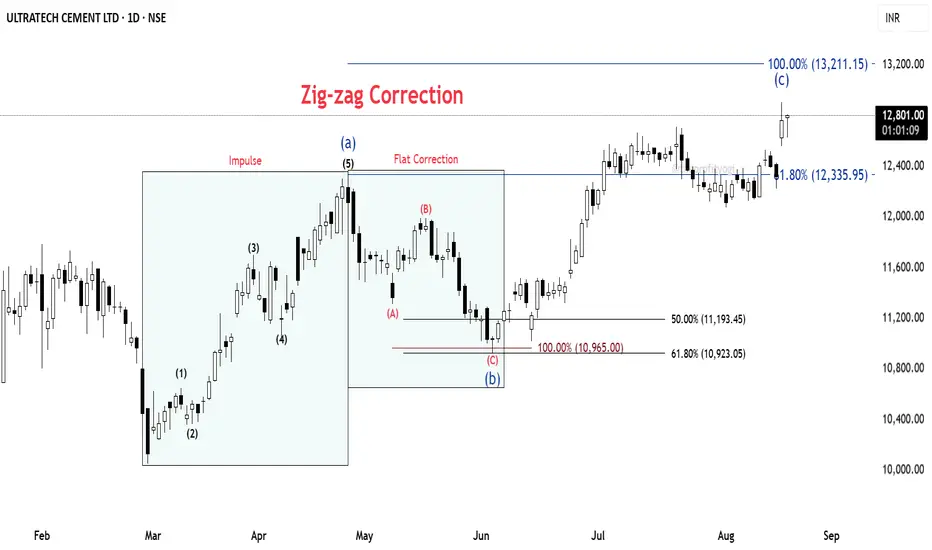
ULTRACEMCO: Wave C started from strong Fib clusterULTRACEMCO – Daily Chart Analysis
🔹 Base Point: The count begins from the low made on 3rd March 2025.
🔹 From this low, the price moved up in the form of a clear impulse wave, completing a 5-wave structure.
🔹 This was followed by a corrective fall, retracing 61.8% Fibonacci of the prior impulse.
⚡ Correction Phase:
The decline is counted as an ABC Flat correction (red).
Within this, the C wave extended fully to the 100% Fibonacci projection.
At this point, we observe a strong cluster zone formed by the 61.8% retracement and 100% extension, indicating confluence and potential support.
📈 Current Development:
From this support, the price has begun to move up again, showing the characteristics of a fresh impulse.
The overall structure fits into a larger Zig-Zag correction, where Wave C is still under development.⏳
📝 Summary:
✅ Impulse up (5 waves)
✅ Flat correction (A-B-C) complete at Fib cluster
🚀 Wave C of Zig-Zag unfolding
#ULTRACEMCO #NSEStocks #ElliottWave #Fibonacci #WaveAnalysis #TradingSetup #PriceAction
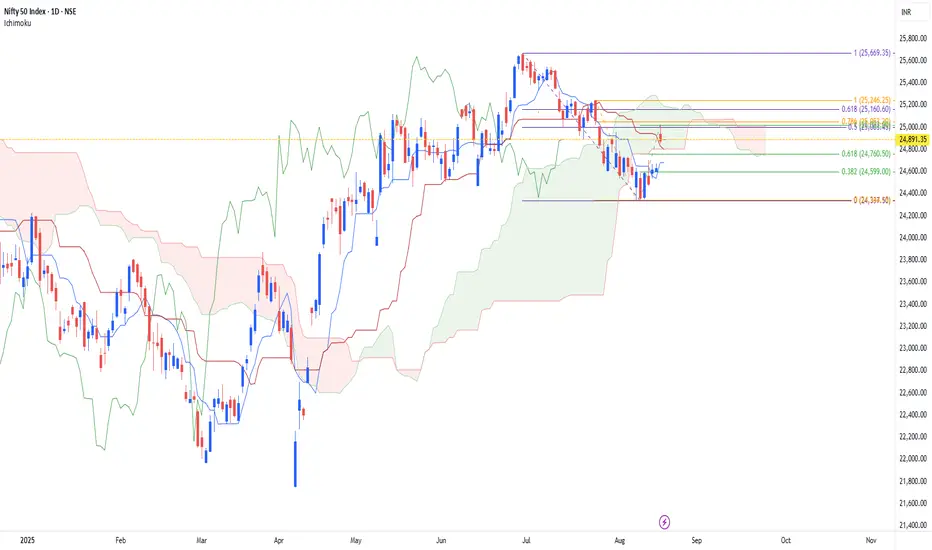
Nifty Short Entry Based on TRIPLE CROWN Theory
combining specific Fibo Retracement level, identified areas that can be used to go short in NIFTY
range to go short is - 25160 to 25000, which got triggered yesterday,
let us go for short till yesterday's high is not breached
target will be 24760 and 24600 and then 24340
stop can be placed 25000
this trade is purely based on entry when the price falls in TCZ (The Triple Crown Zone), which is price zone based on FIBO RETRACEMENT LEVELS IN A SPECIFIC ORDER
note :-
more then entering the trade
it will be more interesting to understand this theory and its impact if price stays in TCS zone today and how it reacts here on
stay tuned
have a good day to all
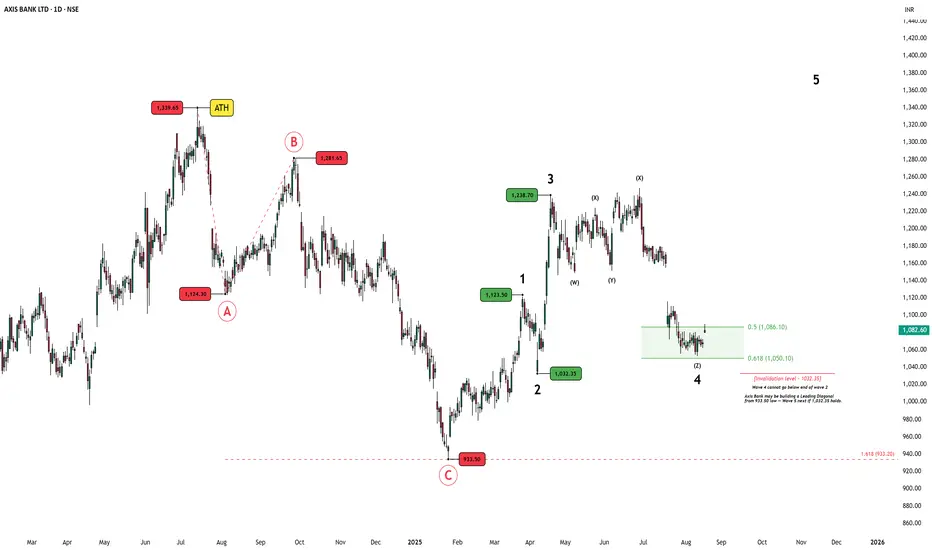
Axis Bank: Zigzag Ended at 1.618, Diagonal Structure in PlayAxis Bank topped out at its all-time high (₹1,339.65) before entering a sharp ABC correction.
Wave A fell to ₹1,124.30
Wave B retraced to ₹1,281.65
Wave C declined to ₹933.50, completing exactly at the 1.618 projection of Wave A from Wave B — a classic Zigzag termination.
This precise completion at 933.50 set the stage for a potential new bullish cycle.
From that low, Axis Bank has advanced in an overlapping fashion, typical of a Leading Diagonal.
Price is now consolidating within Wave 4, unfolding as a complex W-X-Y-X-Z correction, hovering in the 0.5–0.618 retracement zone of Wave 3 (₹1,050–₹1,086).
The invalidation level is ₹1,032.35 (Wave 2 low). As long as this holds, the bullish diagonal count remains valid.
If Wave 4 is indeed complete, the next move would be Wave 5, with potential to break past the swing at ₹1,238.70 and eventually retest the ATH of ₹1,339.65.
Disclaimer:
This analysis is for educational purposes only and does not constitute investment advice. Please do your own research (DYOR) before making any trading decisions.
Adani Ports Maintains Bullish Momentum, Nears Resistance at Key Topic Statement:
Adani Ports is riding strong bullish momentum after rebounding from a key retracement level, now approaching stiff resistance near a distribution zone.
Key Points:
1. The stock retraced up to the 50% Fibonacci level and has since moved up to the 23.6% level, showing renewed strength
2. Price faces stiff resistance at the 1500 mark as it enters a known distribution zone
3. The stock rarely trades below the 200-day EMA, and such dips have historically offered excellent accumulation opportunities
