Bank nifty correction start now?Bank Nifty
Current Price: 56,791.95 (Spot)
Bank Nifty has reversed lower from the resistance trendline, confirming selling pressure near higher levels.
A Dark Cloud Cover candlestick pattern combined with an emerging M-top formation indicates potential short-term bearish sentiment.
It can short here or any bounce use as shorting opportunity for target 56,056
Major resistance is 57,400-57,700
The index is forming a rising wedge pattern, a bearish structure suggesting potential for deeper correction if key support levels are breached.
Key Support Levels:
Immediate support is identified at 56,056 (trendline support).
A decisive close below 56,056 may accelerate selling pressure, opening downside targets toward: 55,342 , 53,908
Fibonacci

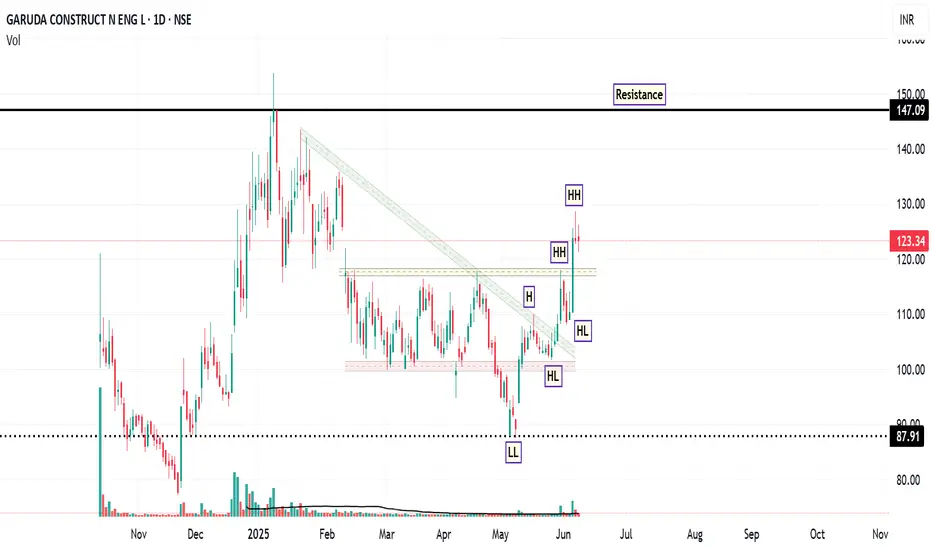
Garuda: Riding the Momentum WaveFrom February to late May 2025, the stock of GARUDA was trading in a sideways consolidation range, roughly between ₹100 (support) and ₹115-₹120 (resistance). The recent powerful green candles have shattered the upper boundary of this range. Also, the most significant event on the daily chart is the decisive breakout from a descending trendline that had capped prices. Also, LL and HH formation observed on daily chart.
The breakout was accompanied by a significant spike in volume ( 862.88K shares ), which is substantially higher than the average volume during the consolidation period. High volume on a breakout lends strong credibility to the move.
The RSI is at a strong 69.20 . It is in bullish territory and rising, indicating strong buying momentum. It is approaching the overbought region (>70), but is not there yet, leaving room for further upside before becoming extended.
If the stock consolidates above the ₹120-₹121 support level. Buyers step in on any minor dip till ₹118 , and the price then continues its upward trajectory towards the resistance targets of ₹129 and subsequently ₹149 .
Disclaimer: This technical analysis is for informational purposes only and should not be considered as financial advice. Trading in the stock market involves risk. Always conduct your own research and consult with a qualified financial advisor before making any investment decisions.
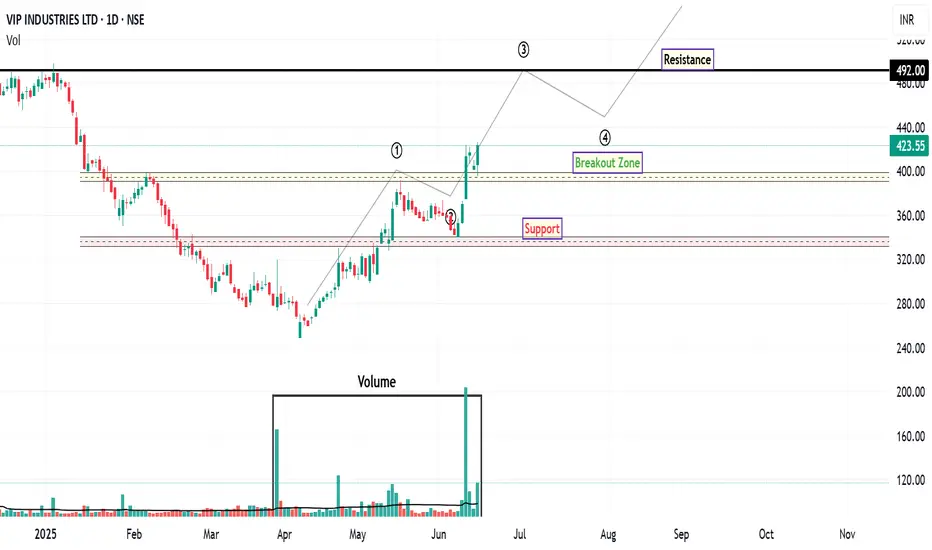
VIPIND: Unlocking Potential After Downtrend
VIP Industries has demonstrated robust bullish momentum over the past few trading sessions, signaling a notable shift in market sentiment. This upward trajectory is particularly significant given the stock's prolonged downtrend since October 2024.
From an Elliott Wave perspective, the recent price action suggests the potential completion of a corrective phase. The retracement from what appears to be Wave 1 to Wave 2 aligns closely with the 61.8% Fibonacci retracement level, which often precedes the initiation of a strong Wave 3 impulse. This potential wave structure, if confirmed, could indicate further upside potential.
A key development supporting this bullish outlook is the stock's recent decisive close above its 200-day EMA, accompanied by a significant surge in trading volume. This confluence of price action and volume confirms strong buying interest and suggests a potential long-term trend reversal. The increased volume further validates the strength of the breakout, indicating broader market participation.
While the immediate outlook appears constructive, traders should be mindful of potential profit-taking around the ₹446 level. This area may present a temporary resistance zone where some short-term corrections or consolidation could occur. However, should the stock successfully navigate this level, the next significant upside resistance target to monitor is ₹492 . This level aligns with prior price highs and could represent a more substantial challenge for further upward movement.
For risk management purposes, a prudent approach would involve considering a stop-loss order positioned below the identified support zone, as depicted on the chart. This strategy aims to mitigate potential downside risk in the event of an unexpected reversal in market sentiment.
Disclaimer: The information provided in this technical analysis is for informational and educational purposes only and should not be construed as financial advice. It is based on observations from the provided chart and commonly used technical indicators. Market conditions can change rapidly, and past performance is not indicative of future results. Always conduct your own comprehensive due diligence and consult with a qualified financial advisor before making any investment decisions.
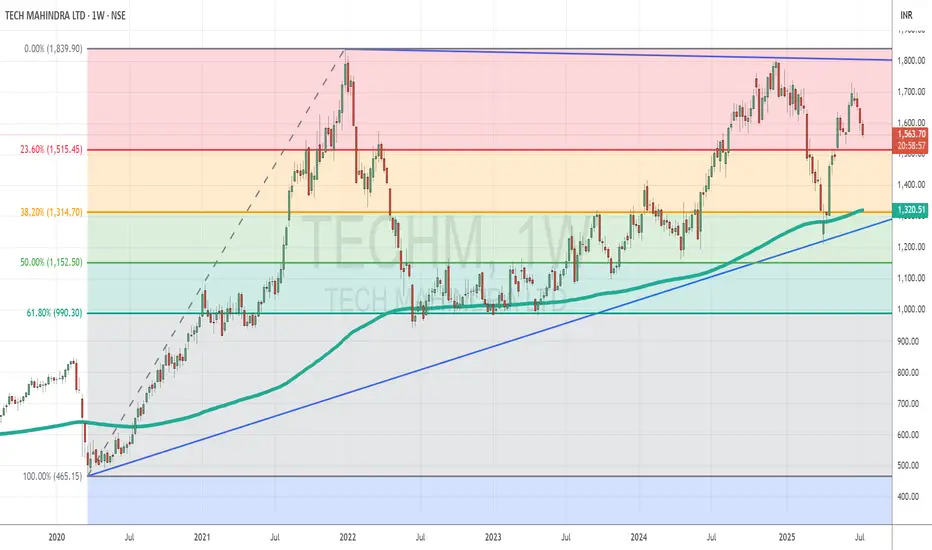
Tech Mahindra Consolidates in a Wedge After Strong Support at KeTopic Statement:
TechM has been stuck in a consolidation zone, rebounding from strong support levels and forming a wedge pattern that may signal an upcoming breakout.
Key Points:
* The stock corrected up to the 30% Fibonacci retracement level, finding strong support around 1314
* It touched the 200-day moving average, which acted as a support and triggered a rebound
* The candlestick formation resembles a wedge, clearly marked on the chart with blue trend lines, indicating potential for a decisive move ahead
Positional or longterm opportunity in CESCGo Long @ 139.6 for Targets of 165, 185.8, and 276.5 with SL 124.2
Reasons to go Long :
1. On a Weekly timeframe if we draw the Fibonacci retracement tool from the recent swing low (point A) to the recent swing high (point B) then we see stock took support from the 0.618 Fibonacci level.
2. Besides, a bullish candlestick pattern Bullish Engulfing (marked with orange) is formed around the 0.618 Fibonacci level.
3. Also there is a strong Trendline (marked with green color) which earlier was acting like resistance but now is providing support to the stock.

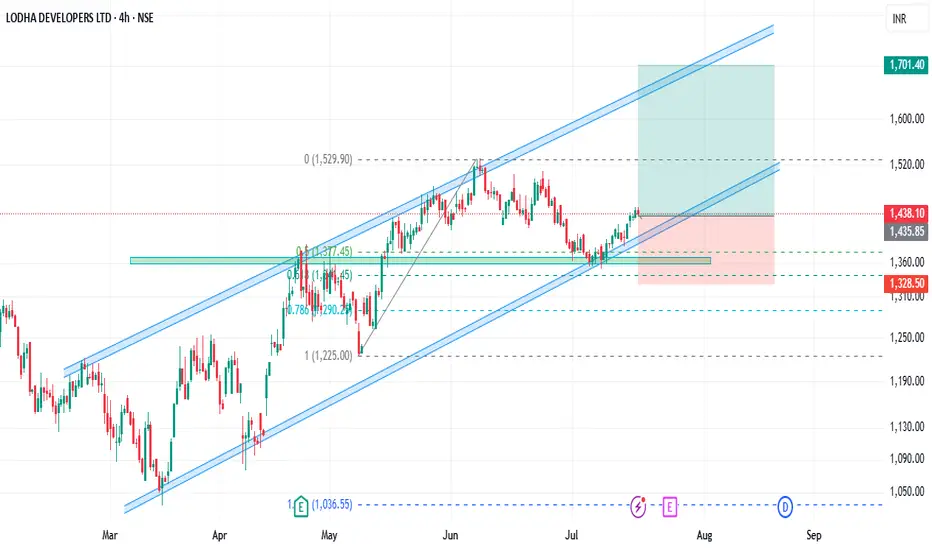
LODHA:Triple Confluence Zone - Fib, Horizontal & Channel SupportHey Traders!
NSE:LODHA is showing a compelling bullish structure on the 4H chart — backed by clean price action, structure, and strong confluence.
Technical Breakdown:
✅ Ascending Channel: The stock has been consistently respecting its upward-sloping channel since March, forming a sequence of higher highs and higher lows.
✅ Fibonacci Retest: The recent retracement found strong support around the 0.5 and 0.618 zone (₹1,352), aligning with both the horizontal support and the lower channel line.
✅ Horizontal Support: The zone around ₹1,352–₹1,375 (a previous resistance) acted as a strong support during the pullback. Price bounced cleanly from it — confirming its importance.
✅ Confluence: The lower channel support, horizontal support, and Fibonacci level all align in the same area — boosting the reliability of this bounce.
Trade Setup:
Entry Zone: ₹1,435 (Around current levels)
Stop-loss: Below ₹1,328 (Closing Basis)
Target: ₹1,700 (upper channel boundary)
Reward-to-Risk: 1:2.5
Disclaimer:
This analysis is for educational purposes only. Please do your own research and use proper risk management.
Thanks for reading!
If you liked the setup, drop a comment or a like!
Looking forward to hearing your thoughts.
Happy Trading!
— Anantesh
NAZARA TECHNOLOGIES LTD | Monthly Chart Breakout📊 NAZARA TECHNOLOGIES LTD (NSE: NAZARA) | Monthly Chart Breakout
📅 Date: June 1, 2025
📈 CMP: ₹1,295.10 (+28.04%)
📌 Ticker: NSE:NAZARA
📉 Chart Pattern Insight
🔥 Cup & Handle + Falling Wedge Breakout
Nazara Tech has broken out of a strong Cup & Handle pattern, reinforced by a Falling Wedge breakout — a powerful confluence suggesting a major trend reversal.
🎯 Breakout is confirmed with high volume and a clean monthly candle close above key resistances.
📐 Fibonacci Retracement Levels (From High ₹1678 to Low ₹477)
🔸 38.2% – ₹935.85 (was resistance, now flipped to support)
🔸 50% – ₹1,077.55
🔸 61.8% – ₹1,219.25 (just surpassed – strong bullish confirmation)
🧭 100% – ₹1,678 (All-Time High)
📊 Indicator: RSI + Moving Average Cross (Icon shown)
🔍 RSI is at 71.63 and rising sharply, indicating strong momentum
🔺 RSI crossover above MA confirms bullish strength and trend continuation
🧱 Volume Spike
📈 Volume this month is multi-month high, validating the breakout
🔑 Key Levels
Support: ₹935 (prior resistance, now retest zone)
Immediate Resistance: ₹1,300 (psychological), ₹1,400
Target Zones:
Short-Term: ₹1,450
Medium-Term: ₹1,600+
Long-Term: Retest of All-Time High ₹1,678+
🛡️ SL: ₹935 (monthly close basis)
📌 Trading Plan
Entry: Pullback near ₹1,220–₹1,250 or breakout retest
SL: ₹935 (below 38.2%)
Target: ₹1,450 / ₹1,600+
Time Frame: Positional – Multi-week to multi-month
⚠️ Disclaimer
This analysis is for educational purposes only. Please do your own research or consult a SEBI-registered advisor before investing.

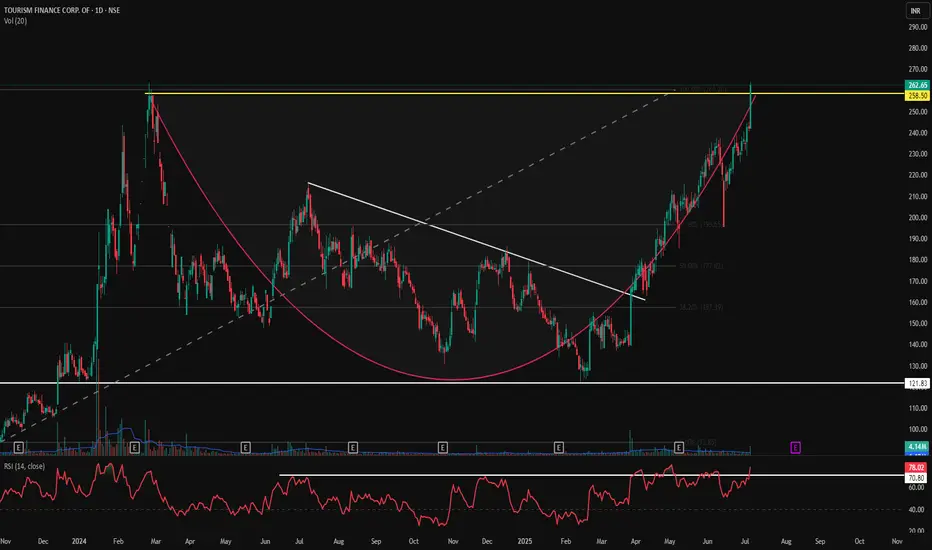
TFCILTD - Massive Cup & Handle Breakout | Daily Chart📊 TFCILTD – Massive Cup & Handle Breakout | Fib 100% Retest | RSI Overbought | Volume Surge | Daily Chart
📅 Chart Date: July 6, 2025
📍 CMP: ₹262.65 (+8.48%)
📈 Symbol: NSE:TFCILTD
🔍 Technical Analysis Summary
☕ Cup & Handle Pattern Breakout
Price broke out above the Cup & Handle neckline near ₹258.50 and hit the Fibonacci 100% extension at ₹262.65.
Clean rounding bottom formation visible, followed by bullish handle and sharp breakout.
📐 Fibonacci Retracement (from swing low ₹93.85 to high ₹262.65)
50.00% – ₹177.02
61.80% – ₹196.65
✅ 100.00% – ₹262.65 (just achieved!)
📈 RSI Indicator (14)
RSI at 78.02, clearly in overbought territory – indicating momentum strength, but a minor pullback is likely.
RSI consistently above 70 for the past few sessions reflects strong trend continuation.
📊 Volume
Volume surged to 4.14M, supporting the breakout. Confirmation of pattern breakout is validated by this volume spike.
🏁 Key Technical Levels
Breakout Zone (Neckline): ₹258.50 ✅
CMP: ₹262.65
Next Resistance: Blue Sky Zone (New Highs)
Support on Retest: ₹258.50 → ₹230.67
Major Support: ₹177.02 (Fib 50%)
💡 Trade Setup Idea
Entry: On breakout confirmation above ₹258.50 or on retest
Stoploss: Below ₹230
Target: Open sky above ₹262 → Trend-following zone
Risk Level: Medium-High (due to overbought RSI)
⚠️ Disclaimer: This is an educational chart setup and not trading advice. Please conduct your own research and risk management.
📣 Follow @PriceAction_Pulse for more such clean breakouts and chart pattern analysis!
🔁 Drop a comment if TFCILTD is on your radar for the next breakout rally 📈
AUDCAD POTENTIAL SHORTLooking at AUDCAD on the 4h timeframe,currently looking to take shorting positions upon the retest of the recently formed daily supply zone which also confluences withe retest of the level in which the market broke out of and the inner 4h and 1h supply zones.

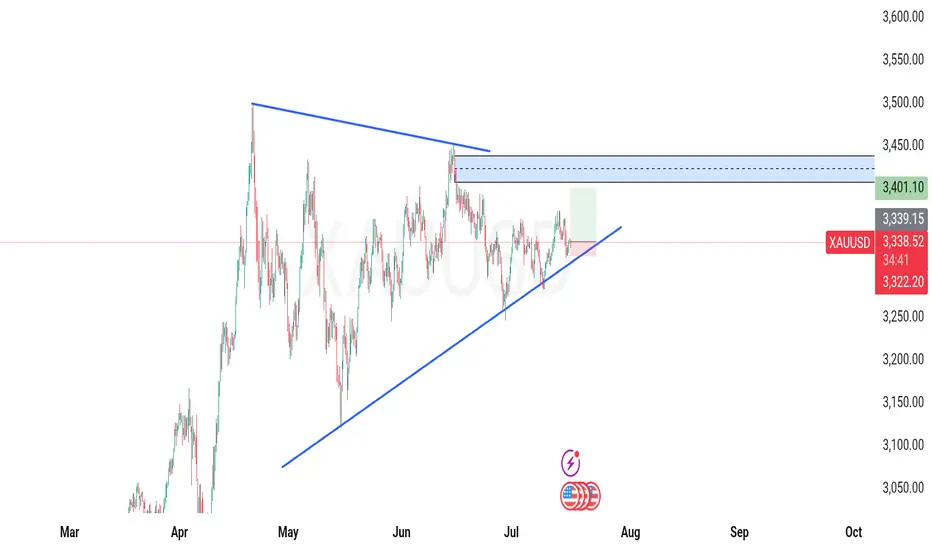
XAU/USD Ascending Triangle Breakout Setup Pattern: Ascending Triangle
Bias: Bullish (Breakout Imminent)
Entry Zone: Around 3338 (Current Market Price)
Target Zone: 3401 and beyond
Invalidation: Below 3322
📌 Technical Breakdown:
Higher Lows building momentum from April till July ✅
Flat Resistance Zone around 3400 acting as a ceiling ⛔
Volume likely to expand on breakout 📈
Break above 3400 = explosive upside potential 💣
---
🧠 Smart Trader Strategy:
✅ Entry: Break and close above 3340–3350
🎯 TP1: 3400 (Major resistance)
🎯 TP2: 3450+ (Post-breakout rally)
🛑 SL: Below 3322 (Ascending trendline invalidation)
📅 Timing Tip:
Watch for US Session or major economic news like CPI/NFP/Fed minutes — high volatility may trigger breakout moves.
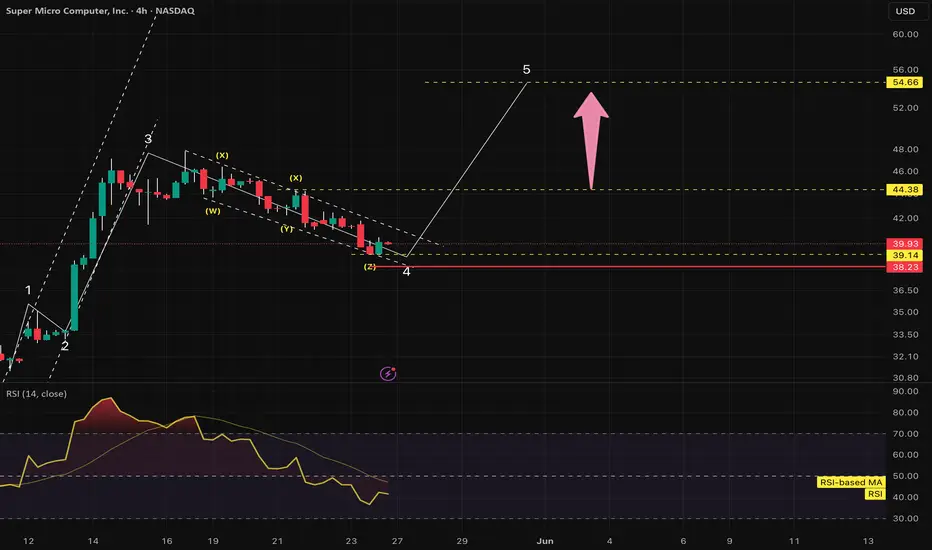
SMCI short term Target of 54SMCI has been correcting in a complex zig-zag correction.
It has completed triple Zig-Zag, correction seems over as per Wave-3 max pull back and seems to be headed towards 54 in short time, provided some conditions are met.
Conditions:
a) Correction should stop at around this level or can go max till ~38.23, what it means is, price damage should stop, we may still correct in horizontal way not breaking price of approx 38.23.
b) We need fast re-tracement of price towards ~44.40
If above is satisfied, entry at 44.40 for a target of 54 is a good probabilistic trade.
When set up gets invalid ?
When price breaks and closes below 38.23 on 4hr closing candle basis.
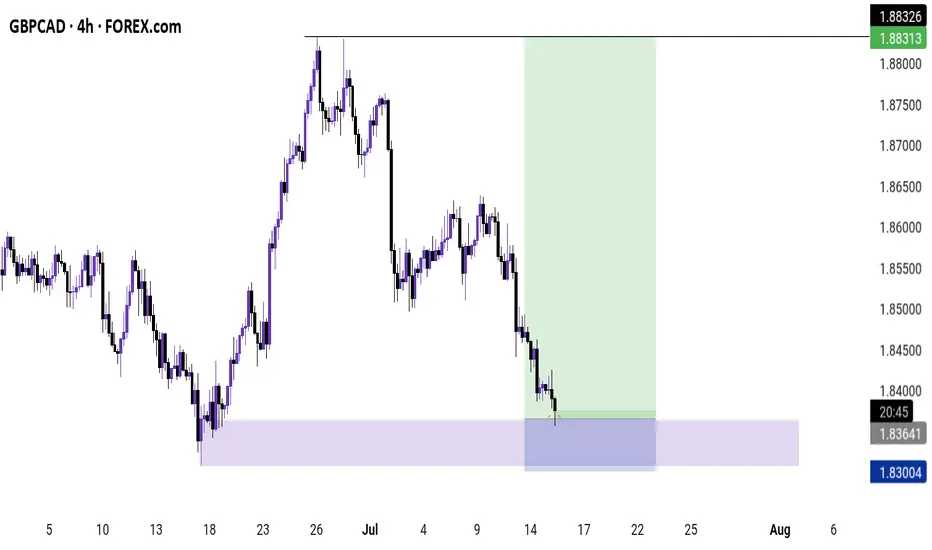
GBPCAD POTENTIAL FOR THE UPSIDELooking at GBPCAD, currently looking to take long positions on the current retest of the daily demand zone which also confluences with the retest of the recently formed 4h and 1h demand zones.Use the lower timeframes to confirm the move and use proper risk management should you decide to join me
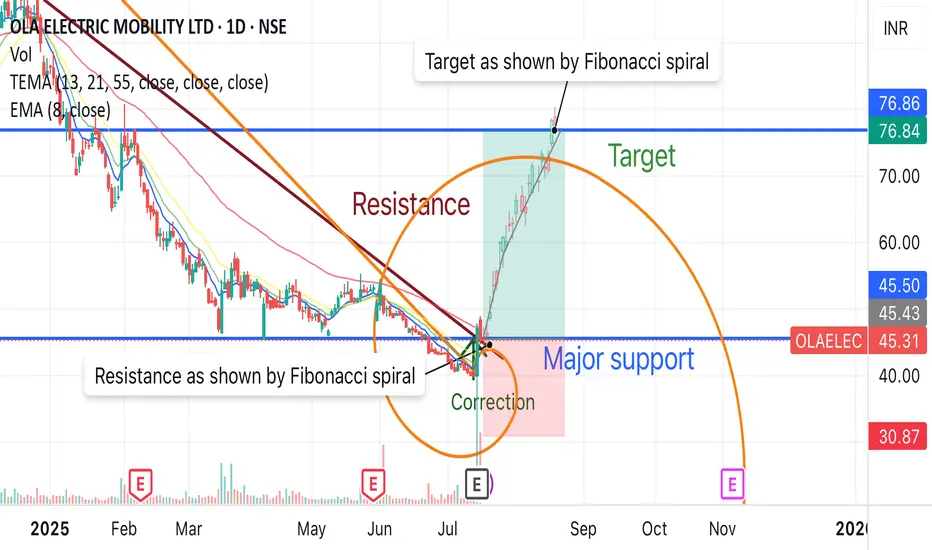
Ola Electric breakout with 65% of upside potential by FibonacciOla electric mobility is going to give 65% of upside with Fibonacci spiral and resistance breakout with high volume.
Buy around - 45 to 47
Target - 76
Duration - 2-3 months
EDUCATIONAL | NIFTY FUTURE POSSIBILITIESNifty has formed a double correction with second part being a Diametric formation
Possibility 1: The current fall which started around 30th June could be another Wave X and we will then continue to move up in a corrective rise.
This Wave X would be confirmed if Nifty doesn't break the level of 25,000 and confirm the upward bias from here, which is more likely
Possibility 2: The next possibility is that Nifty has completed a double correction and we'll continue the downward journey from here which will be more likely if Nifty break 25,000.
Will keep you guys updated as the wave progresses.
Happy Trading!!

Cipla Trades Sideways Within Defined Range, Eyes Possible DoubleTopic Statement:
Cipla is currently stuck in a sideways zone, consolidating between key retracement levels while setting up for a potential move higher.
Key Points:
* The price is moving between 1502 (23.6% retracement) and 1380 (38.2% retracement), forming a clear horizontal range
* It remains fairly above the 200-day EMA, indicating underlying strength despite consolidation
* The stock may move up toward 1700 to form a double top, where it is likely to face strong resistance

$DOGE 1Hr Elliott Wave Outlook
#DOGE is currently forming the 5th impulse wave on the hourly chart, indicating a potential bullish continuation.
Completed Waves (1), (2), (3), and (4).
Now Wave (5) is in progress.
Potential move towards -
1.0 Fib : $0.2246
1.618 Fib : $0.2448
Bullish Confirmation - Sustained breakout above $0.2136
Invalidation Level - Any clear move below $0.1950 invalidates this bullish scenario.
Watch for volume-backed momentum above $0.2136 to confirm bullish continuation.

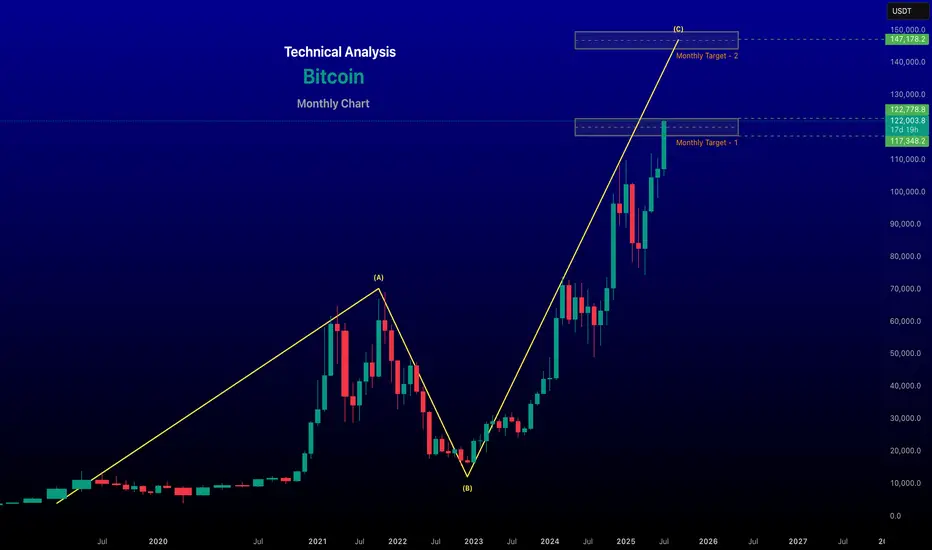
renderwithme | Bitcoin Technical Analysis for August 2025 # Price Trends: Bitcoin is trading above key exponential moving averages (EMAs) on daily charts (20-day: $108,285; 50-day: $105,843; 100-day: $101,952; 200-day: $95,985), signaling sustained bullish momentum.
# Support and Resistance:Support: $110,000–$111,909 is a critical support zone. A drop below could test $105,000 or $101,000.
# Resistance: $125,724–$126,000 is the next hurdle. A breakout above could target $145,000–$150,000
Chart for your reference
~~ Disclaimer --
This analysis is based on recent technical data and market sentiment from web sources. It is for informational \ educational purposes only and not financial advice. Trading involves high risks, and past performance does not guarantee future results. Always conduct your own research or consult a SEBI-registered advisor before trading.
#Boost and comment will be highly appreciated
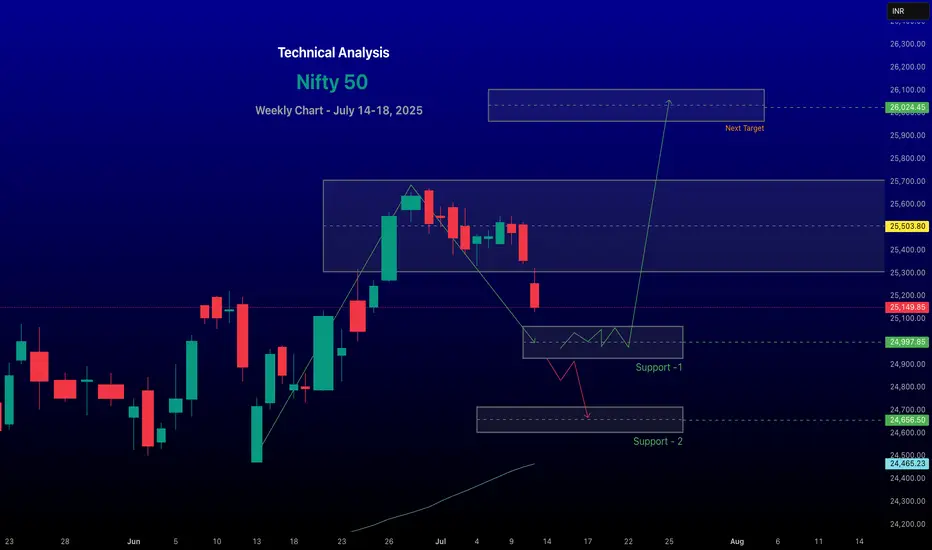
Nifty 50 about to hit SupportPredicting the Nifty 50's movement for the week of July 14–18, 2025,
Involves analyzing recent market trends, technical indicators, and macroeconomic factors based on available data. Here’s a concise analysis:Market ContextRecent Performance: The Nifty 50 closed at 25,149.85 on July 11, 2025, down 0.78% from the previous day, reflecting a bearish session driven by losses in IT, auto, and oil & gas stocks. The index has been volatile, with a weekly decline of 0.59% but a monthly gain of 0.63%.
# Global Cues:
Mixed global market trends are influencing sentiment. U.S. markets are at record highs, but Wall Street futures are down, and Asian markets are mixed (e.g., Nikkei 225 up, Hang Seng down). The looming U.S. tariff deadline and potential U.S.–India trade agreement talks are key events to watch.
#FII/DII Activity:
Foreign Institutional Investors (FIIs) have been selling, which may weigh on short-term sentiment, while Domestic Institutional Investors (DIIs) could provide support.
~~ Technical Analysis ~~
Trend: The Nifty 50 is in a broader uptrend but showing signs of a short-term correction. It closed below the key level of 25,400, indicating potential weakness. Technical indicators suggest a sideways to bearish bias for the near term.
#Support and Resistance:
Support: Key support lies at 24,900–25,133. A break below 24,900 could lead to further declines toward 24,700 or 24,500.
Resistance: Immediate resistance is at 25,500–25,650. A sustained move above 25,650 could signal bullish momentum toward 25,770–26,000.
# Indicators:
Moving Averages: The index is above its 20-day, 50-day, and 200-day EMAs, supporting a bullish long-term trend, but recent selling pressure at higher levels indicates consolidation.
# Sectoral Outlook
Bullish Sectors: Banking, pharma, realty, oil & gas, and media showed resilience last week, with stocks like HDFC Bank, Bajaj Finance, and Coal India gaining.
Bearish Sectors: IT, metals, telecom, and auto underperformed. IT stocks like TCS, HCL Tech, and Infosys dragged the index due to weak Q1 results (e.g., TCS reported a 6% profit increase but faced margin pressure).
Key Events to WatchU.S.–India Trade Talks: Clarity on a potential interim trade agreement could boost sentiment, especially for export-oriented sectors.
FOMC Minutes: The release of FOMC minutes may influence global rate expectations, impacting FII flows.
Forecast for July 14–18, 2025Expected Range: The Nifty 50 is likely to trade between 25,000–25,750. A break below 24,900 could test 24,500, while a move above 25,650 may target 26,000.
~~ Disclaimer --
This analysis is based on recent technical data and market sentiment from web sources. It is for informational purposes only and not financial advice. Trading involves high risks, and past performance does not guarantee future results. Always conduct your own research or consult a SEBI-registered advisor before trading.
#Boost and comment will be highly appreciated

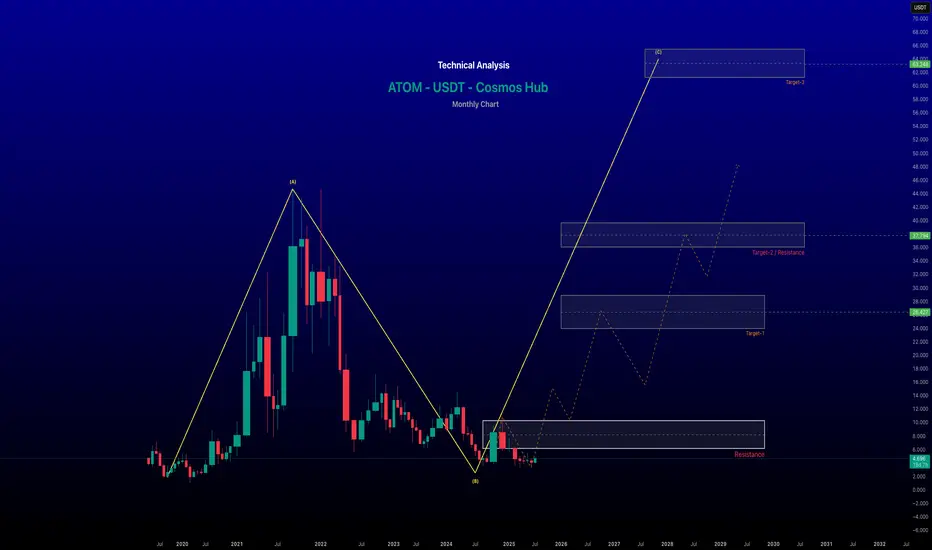
Cosmos (ATOM) Analysis for Next Six Months Current Price and Market ContextCurrent Price (as of July 13, 2025): Approximately $4.81 USD, with a 24-hour trading volume of $122.06 million and a market cap of $2.17 billion, ranking ATOM as the 61st largest cryptocurrency by market cap.
Recent Performance: ATOM has shown a modest upward trend, gaining 1.82% in the last 24 hours and 2.46% over the past 7 days.
Market Sentiment: Mixed, with short-term bearish signals from technical indicators but growing optimism due to ecosystem developments and bullish sentiment
Chart for your reference
This analysis is for informational purposes only and does not constitute financial advice. Cryptocurrency investments are highly volatile and risky. Always conduct your own research and consult with a financial advisor before making investment decisions.
Nifty 50 at a Turning Point? Key Levels & Market Outlook AheadThe Nifty 50 ended the week at 25,149.85, posting a loss of -1.22%. The index is now approaching a critical price action zone which could define the direction in the upcoming sessions.
🔹 Key Levels for the Upcoming Week
📌 Price Action Pivot Zone:
25,070 to 25,230—This is a crucial range to monitor for potential trend reversals or continuation. A breakout or breakdown from this zone can set the tone for the week.
🔻 Support Levels:
S1: 24,835
S2: 24,520
S3: 24,164
🔺 Resistance Levels:
R1: 25,469
R2: 25,788
R3: 26,256
📈 Market Outlook
✅ Bullish Scenario:
A sustained move above 25,230 (top of the pivot zone) may invite buying interest. If momentum continues, the index could test R1 (25,469) and possibly extend towards R2 (25,788) and R3 (26,256).
❌ Bearish Scenario:
Failure to hold the pivot zone and a breakdown below 25,070 could trigger further downside. The index may slide towards S1 (24,835) and deeper supports at S2 (24,520) and S3 (24,164).
Disclaimer: lnkd.in

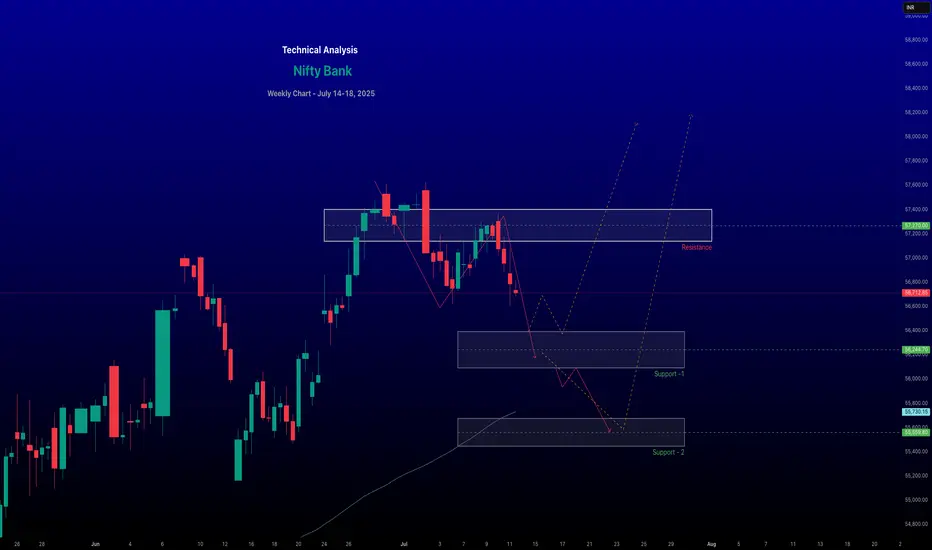
renderwithme | Bank Nifty Prediction for July 14–18, 2025
~~ Bank Nifty Current StatusClosing Price (July 11, 2025): ~~
The Bank Nifty index closed at 56,754.7, down 0.35% (201.3 points), reflecting selling pressure in key constituents like HDFC Bank (-1.16%), Canara Bank (-0.64%), and Bank of Baroda (-0.79%).
#Recent Trend:
The index has shown a bearish tilt, breaching the 20-day Exponential Moving Average (EMA) support, with a cautious market sentiment.
# Historical Context:
Despite the recent dip, Bank Nifty has a positive seasonality trend, with 11 out of 17 years showing positive returns in July.
~~ Technical Analysis ~~
# Support Levels:
Immediate support: 56,400–56,000 (key psychological and technical level).
Additional supports: 55,736 and 55,438.
Critical support: 55,000, a level noted as a potential rebound point if held.
# Resistance Levels:
Immediate resistance: 57,000–57,500 (significant open interest in call options at these strikes).
Higher resistance: 57,300–57,500, with a breakout above 57,200 potentially signaling a move toward 57,600–58,000.
Bank Nifty Prediction for July 14–18, 2025Bullish Scenario:A breakout above 57,200–57,300 could push the index toward 57,600–58,000, especially if banking heavyweights like ICICI Bank or SBI show strength.
Sustained trading above 57,000, supported by positive earnings or global cues, could reinforce the bullish trend.
Bearish Scenario:A break below 56,500 could trigger selling toward 56,000 or lower (55,540–55,000).
Negative earnings or renewed global uncertainties (e.g., trade tensions) could exacerbate declines.
Likely Range: The index is expected to trade between 56,500–57,500, with consolidation likely unless a clear breakout or breakdown occurs.
~~ Disclaimer --
This analysis is based on recent technical data and market sentiment from web sources. It is for informational purposes only and not financial advice. Trading involves high risks, and past performance does not guarantee future results. Always conduct your own research or consult a SEBI-registered advisor before trading.
#Boost and comment will be highly appreciated
renderwithme | Nifty 50's movement for the week of July 14–18, Predicting the Nifty 50's movement for the week of July 14–18, 2025,
Involves analyzing recent market trends, technical indicators, and macroeconomic factors based on available data. Here’s a concise analysis:Market ContextRecent Performance: The Nifty 50 closed at 25,149.85 on July 11, 2025, down 0.78% from the previous day, reflecting a bearish session driven by losses in IT, auto, and oil & gas stocks. The index has been volatile, with a weekly decline of 0.59% but a monthly gain of 0.63%.
# Global Cues:
Mixed global market trends are influencing sentiment. U.S. markets are at record highs, but Wall Street futures are down, and Asian markets are mixed (e.g., Nikkei 225 up, Hang Seng down). The looming U.S. tariff deadline and potential U.S.–India trade agreement talks are key events to watch.
#FII/DII Activity:
Foreign Institutional Investors (FIIs) have been selling, which may weigh on short-term sentiment, while Domestic Institutional Investors (DIIs) could provide support.
~~ Technical Analysis ~~
Trend: The Nifty 50 is in a broader uptrend but showing signs of a short-term correction. It closed below the key level of 25,400, indicating potential weakness. Technical indicators suggest a sideways to bearish bias for the near term.
#Support and Resistance:
Support: Key support lies at 24,900–25,133. A break below 24,900 could lead to further declines toward 24,700 or 24,500.
Resistance: Immediate resistance is at 25,500–25,650. A sustained move above 25,650 could signal bullish momentum toward 25,770–26,000.
# Indicators:
Moving Averages: The index is above its 20-day, 50-day, and 200-day EMAs, supporting a bullish long-term trend, but recent selling pressure at higher levels indicates consolidation.
# Sectoral Outlook
Bullish Sectors: Banking, pharma, realty, oil & gas, and media showed resilience last week, with stocks like HDFC Bank, Bajaj Finance, and Coal India gaining.
Bearish Sectors: IT, metals, telecom, and auto underperformed. IT stocks like TCS, HCL Tech, and Infosys dragged the index due to weak Q1 results (e.g., TCS reported a 6% profit increase but faced margin pressure).
Key Events to WatchU.S.–India Trade Talks: Clarity on a potential interim trade agreement could boost sentiment, especially for export-oriented sectors.
FOMC Minutes: The release of FOMC minutes may influence global rate expectations, impacting FII flows.
Forecast for July 14–18, 2025Expected Range: The Nifty 50 is likely to trade between 25,000–25,750. A break below 24,900 could test 24,500, while a move above 25,650 may target 26,000.
~~ Disclaimer --
This analysis is based on recent technical data and market sentiment from web sources. It is for informational purposes only and not financial advice. Trading involves high risks, and past performance does not guarantee future results. Always conduct your own research or consult a SEBI-registered advisor before trading.
#Boost and comment will be highly appreciated
Eternal Resumes Bullish Trend After First Major Correction, EyesTopic Statement:
Eternal has bounced back strongly from its first major correction, finding solid support at key levels and now rising toward a potential breakout.
Key Points:
* The stock respects a clear trend line, consistently receiving support along it
* Price retraced to the 38.2% Fibonacci level around 200, where it found strong buying interest and reversed
* As it rises toward 300, the stock is set to form a triple top, and a breakout above this level could lead to a new higher high
