renderwithme | Bank Nifty Prediction for July 14–18, 2025
~~ Bank Nifty Current StatusClosing Price (July 11, 2025): ~~
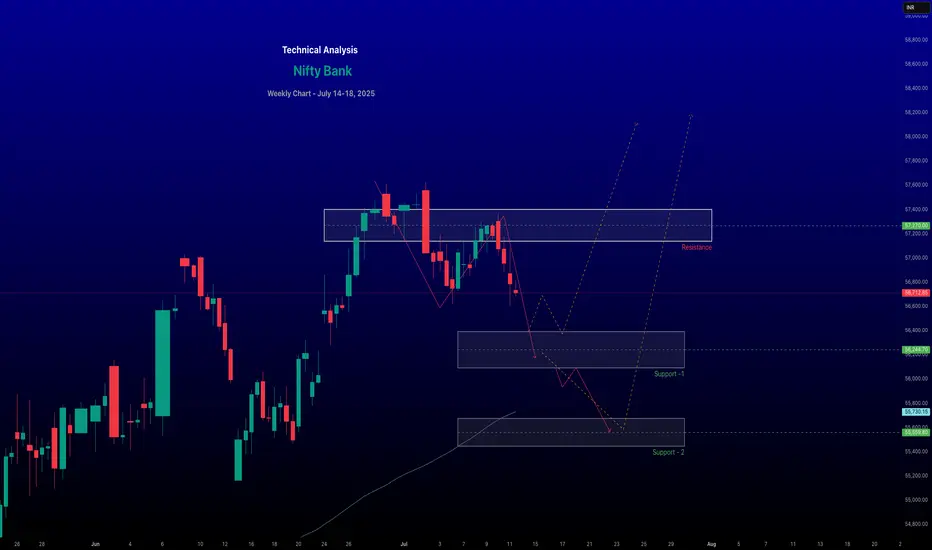
The Bank Nifty index closed at 56,754.7, down 0.35% (201.3 points), reflecting selling pressure in key constituents like HDFC Bank (-1.16%), Canara Bank (-0.64%), and Bank of Baroda (-0.79%).
#Recent Trend:
The index has shown a bearish tilt, breaching the 20-day Exponential Moving Average (EMA) support, with a cautious market sentiment.
# Historical Context:
Despite the recent dip, Bank Nifty has a positive seasonality trend, with 11 out of 17 years showing positive returns in July.
~~ Technical Analysis ~~
# Support Levels:
Immediate support: 56,400–56,000 (key psychological and technical level).
Additional supports: 55,736 and 55,438.
Critical support: 55,000, a level noted as a potential rebound point if held.
# Resistance Levels:
Immediate resistance: 57,000–57,500 (significant open interest in call options at these strikes).
Higher resistance: 57,300–57,500, with a breakout above 57,200 potentially signaling a move toward 57,600–58,000.
Bank Nifty Prediction for July 14–18, 2025Bullish Scenario:A breakout above 57,200–57,300 could push the index toward 57,600–58,000, especially if banking heavyweights like ICICI Bank or SBI show strength.
Sustained trading above 57,000, supported by positive earnings or global cues, could reinforce the bullish trend.
Bearish Scenario:A break below 56,500 could trigger selling toward 56,000 or lower (55,540–55,000).
Negative earnings or renewed global uncertainties (e.g., trade tensions) could exacerbate declines.
Likely Range: The index is expected to trade between 56,500–57,500, with consolidation likely unless a clear breakout or breakdown occurs.
~~ Disclaimer --
This analysis is based on recent technical data and market sentiment from web sources. It is for informational purposes only and not financial advice. Trading involves high risks, and past performance does not guarantee future results. Always conduct your own research or consult a SEBI-registered advisor before trading.
#Boost and comment will be highly appreciated
Fibonacci
renderwithme | Nifty 50's movement for the week of July 14–18, Predicting the Nifty 50's movement for the week of July 14–18, 2025,
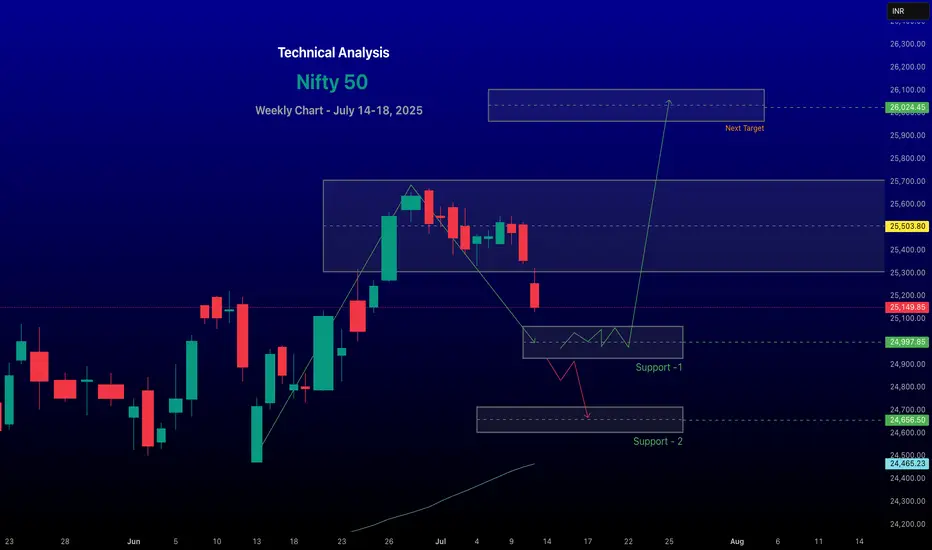
Involves analyzing recent market trends, technical indicators, and macroeconomic factors based on available data. Here’s a concise analysis:Market ContextRecent Performance: The Nifty 50 closed at 25,149.85 on July 11, 2025, down 0.78% from the previous day, reflecting a bearish session driven by losses in IT, auto, and oil & gas stocks. The index has been volatile, with a weekly decline of 0.59% but a monthly gain of 0.63%.
# Global Cues:
Mixed global market trends are influencing sentiment. U.S. markets are at record highs, but Wall Street futures are down, and Asian markets are mixed (e.g., Nikkei 225 up, Hang Seng down). The looming U.S. tariff deadline and potential U.S.–India trade agreement talks are key events to watch.
#FII/DII Activity:
Foreign Institutional Investors (FIIs) have been selling, which may weigh on short-term sentiment, while Domestic Institutional Investors (DIIs) could provide support.
~~ Technical Analysis ~~
Trend: The Nifty 50 is in a broader uptrend but showing signs of a short-term correction. It closed below the key level of 25,400, indicating potential weakness. Technical indicators suggest a sideways to bearish bias for the near term.
#Support and Resistance:
Support: Key support lies at 24,900–25,133. A break below 24,900 could lead to further declines toward 24,700 or 24,500.
Resistance: Immediate resistance is at 25,500–25,650. A sustained move above 25,650 could signal bullish momentum toward 25,770–26,000.
# Indicators:
Moving Averages: The index is above its 20-day, 50-day, and 200-day EMAs, supporting a bullish long-term trend, but recent selling pressure at higher levels indicates consolidation.
# Sectoral Outlook
Bullish Sectors: Banking, pharma, realty, oil & gas, and media showed resilience last week, with stocks like HDFC Bank, Bajaj Finance, and Coal India gaining.
Bearish Sectors: IT, metals, telecom, and auto underperformed. IT stocks like TCS, HCL Tech, and Infosys dragged the index due to weak Q1 results (e.g., TCS reported a 6% profit increase but faced margin pressure).
Key Events to WatchU.S.–India Trade Talks: Clarity on a potential interim trade agreement could boost sentiment, especially for export-oriented sectors.
FOMC Minutes: The release of FOMC minutes may influence global rate expectations, impacting FII flows.
Forecast for July 14–18, 2025Expected Range: The Nifty 50 is likely to trade between 25,000–25,750. A break below 24,900 could test 24,500, while a move above 25,650 may target 26,000.
~~ Disclaimer --
This analysis is based on recent technical data and market sentiment from web sources. It is for informational purposes only and not financial advice. Trading involves high risks, and past performance does not guarantee future results. Always conduct your own research or consult a SEBI-registered advisor before trading.
#Boost and comment will be highly appreciated
Eternal Resumes Bullish Trend After First Major Correction, EyesTopic Statement:
Eternal has bounced back strongly from its first major correction, finding solid support at key levels and now rising toward a potential breakout.
Key Points:
* The stock respects a clear trend line, consistently receiving support along it
* Price retraced to the 38.2% Fibonacci level around 200, where it found strong buying interest and reversed
* As it rises toward 300, the stock is set to form a triple top, and a breakout above this level could lead to a new higher high

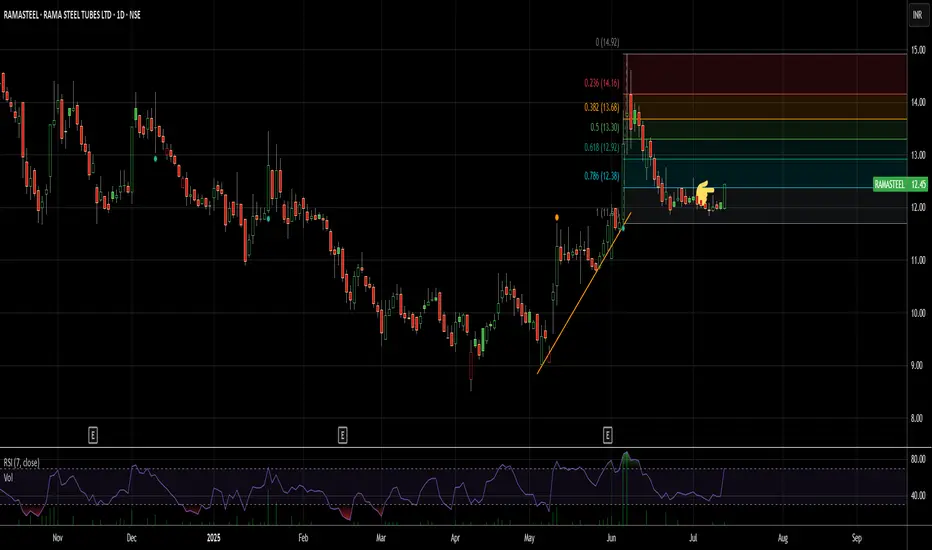
Making a better breakout candle in a consolidationThe overall steel space looks okay
Entry: 12+
Target in short term: 15%
Long term: Covering the whole retracement move back to highs
EDUCATIONAL | Uptrend OverEth has hit a major upward target.
Wave C is equal to Wave A
Will be on the lookout for shorting opportunities after getting a confirmation of downtrend, which will most likely be a corrective downtrend

Glenmark Pharma Recovers Strongly, Approaches Resistance After MTopic Statement:
Glenmark Pharma has staged a strong bullish recovery after a severe correction earlier this year, now testing key resistance levels.
Key Points:
* The price took heavy support at the 50% Fibonacci retracement level, forming a strong base for the rebound
* The stock is breaking out above its previous high, where a head and shoulders pattern had earlier signaled weakness
* Price has overextended above the 200-day EMA, suggesting it may face resistance and potential selling pressure ahead

Havells India Shows Early Bullish Signs After Strong Support at Topic Statement:
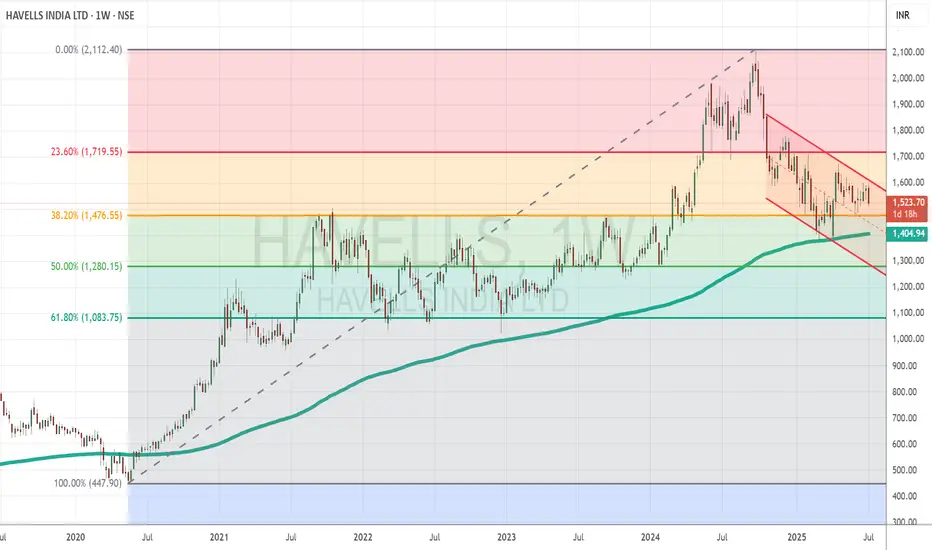
Havells India has corrected but is showing early bullish signals, supported by key technical levels and poised for a breakout from its short-term downtrend.
Key Points:
* The price corrected to the 38.2% Fibonacci retracement level, where it received strong support
* It touched the 200-day EMA, which acted as a deflection point, preventing further downside
* Currently moving in a short-term downtrending channel, the stock is likely to resume strong bullish momentum once it breaks above this channel
Nestle India Climbs Strongly Within Bullish Channel, Eyes PotentTopic Statement:
Nestle India is moving steadily upward in a strong bullish channel, setting up for a potential breakout as it approaches previous highs.
Key Points:
* The stock is trading in an up-trending channel, making it ideal for channel-based trading strategies
* It recently retraced to the 23.6% level and is now recovering, maintaining overall strength
* A previous double top suggests that a rise to those highs could trigger a breakout if resistance is cleared
* The price consistently rebounds when touching the 200-day EMA, reinforcing it as a strong dynamic support level

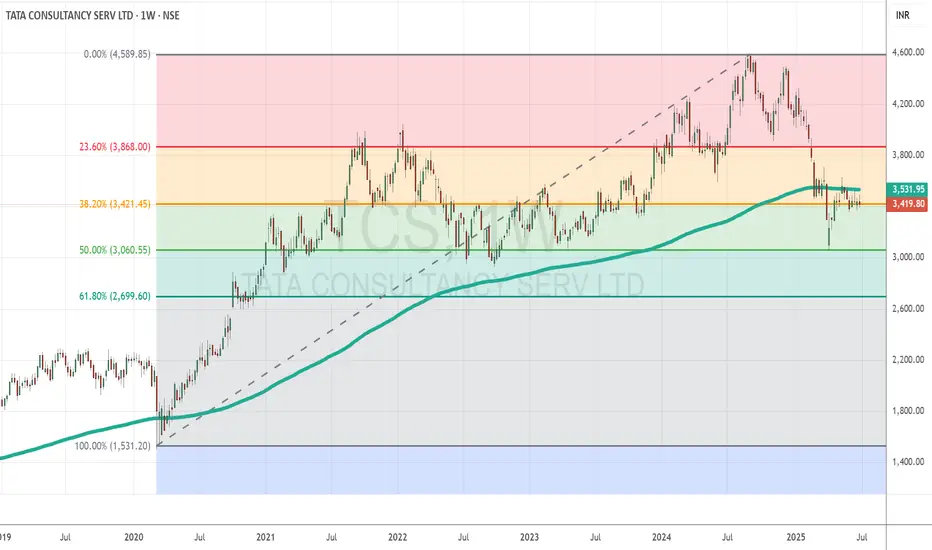
TCS Eyes Rebound as Strong Support and Results AlignTopic Statement:
TCS is currently oversold, with upcoming quarterly results potentially driving a rebound from strong technical support levels.
Key Points:
* The stock retraced to the 50% Fibonacci level at 3060, aligning with the psychological barrier around 3000 that acted as strong support
* Price is now stuck at the 38.2% retracement level at 3421, indicating a key resistance zone to watch
* Trading below the 200-day EMA suggests the stock is oversold, offering a rare and attractive investment opportunity in TCS
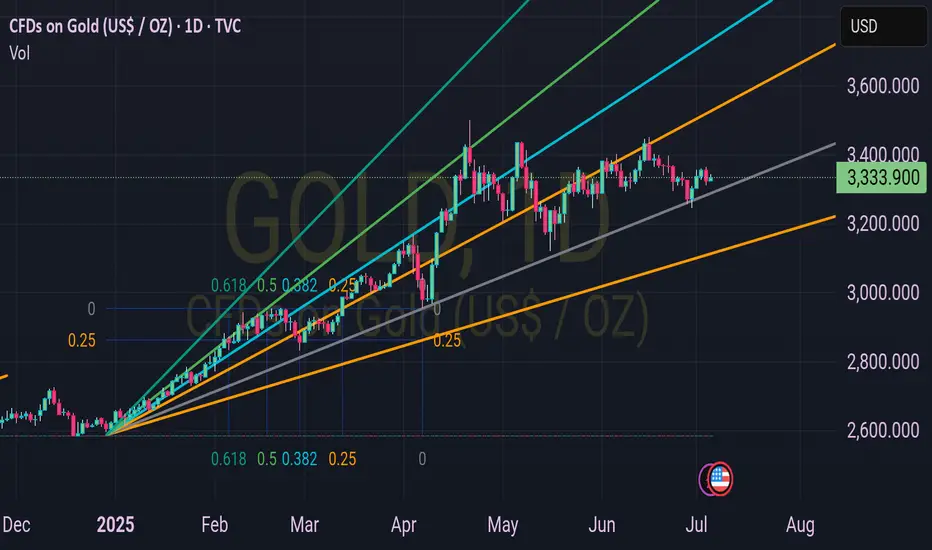
Beauty of Fibonacci Resistance Speed Fan on Gold as a Golden
1. Look at the Beauty of Fibonacci Resistance Speed Fan on Gold as a Golden View
The weekly chart of CFDs on Gold (USD/oz) showcases a stunning Fibonacci resistance fan, guiding price action with precision.
2. Fibonacci Levels as Key Resistance Zones
The fan, drawn from the 2025 low, highlights critical resistance levels: 0.25 at $3,250,000, 0.382 at $3,333,900 (current price), 0.5, 0.618, and beyond, acting as potential ceilings.
3. Current Price Action at $3,333.90
As of July 06, 2025, 01:16 PM +04, gold trades at $3,333.90 (+$8.48 or +0.26%), aligning perfectly with the 0.382 Fibonacci level, indicating a strong resistance test.
4. Upward Momentum Meets Resistance
The price has risen steadily from $2,500 in December 2024, but the Fibonacci fan suggests a potential pause or reversal as it approaches the 0.382 and 0.5 levels.
5. 0.5 Level at $3,500 as a Major Hurdle
The 0.5 Fibonacci resistance at $3,500 looms large, where gold may face significant selling pressure if it breaks through the current $3,333.90 mark.
6. 0.618 Level Signals Next Target
Should gold surpass $3,500, the 0.618 level around $3,750 could be the next psychological and technical barrier, testing bullish strength.
7. Trendline Support Aligns with Fibonacci
The ascending trendline, intersecting near $3,250, complements the Fibonacci fan, offering dynamic support if a pullback occurs from these resistance zones.
8. Recent Price Action Reflects Fibonacci Precision
The recent $8.48 uptick to $3,333.90 demonstrates gold’s adherence to the 0.382 level, reinforcing the fan’s predictive power over the past months.
9. Potential Breakout or Reversal Ahead
Traders should watch for a breakout above $3,333.90 towards $3,500 or a reversal back to $3,250, with the Fibonacci fan providing clear levels to monitor.
10. Strategic Trading with Fibonacci Insights
Use the Fibonacci resistance fan to plan entries and exits, leveraging its alignment with gold’s current $3,333.90 price to anticipate the next move in this golden market.
WCIL - H&S Pattern | Breakout Above Resistance | Daily Chart📊 WCIL – Breakout Above Resistance | RSI Bullish | Strong Volume | Fibonacci Levels | Daily Chart
📅 Chart Date: June 27, 2025
📈 CMP: ₹114.43 (+3.42%)
📍 Ticker: NSE:WCIL
🔍 Technical Analysis Summary
🔺 Breakout From Trendline & Resistance
WCIL has broken out above horizontal resistance at ₹113.50 and long-term descending trendline, indicating strong bullish momentum
Golden neckline breakout of a potential inverse head & shoulder / V-recovery formation
📊 Volume Spike
Massive increase in volume (7.09M) confirms buying interest and validates the breakout
📈 RSI Indicator (14, Close)
RSI at 70.85, trending upward and entering bullish territory
Multiple Bullish RSI crossover signals provide confluence for the uptrend
🌀 Fibonacci Retracement Levels
38.2% – ₹107.94
50.0% – ₹121.13 (next key level)
61.8% – ₹134.31
100% – ₹177.00 (full retracement potential)
📍 Key Price Levels
✅ Breakout Zone: ₹113.50
🔼 Immediate Resistance: ₹121.13
🎯 Target Levels: ₹121 → ₹134 → ₹153+
🛡️ Support Levels: ₹107.9 → ₹100 → ₹91
💡 Trade Idea
Entry: Above ₹114 on confirmation with volume
SL: Below ₹107.50 (close below previous resistance)
Targets: ₹121 → ₹134 → ₹153
Risk-Reward: High conviction due to structure and volume
⚠️ Disclaimer
This chart analysis is for educational purposes only. Always DYOR (Do Your Own Research) and consult a financial advisor before making investment decisions.

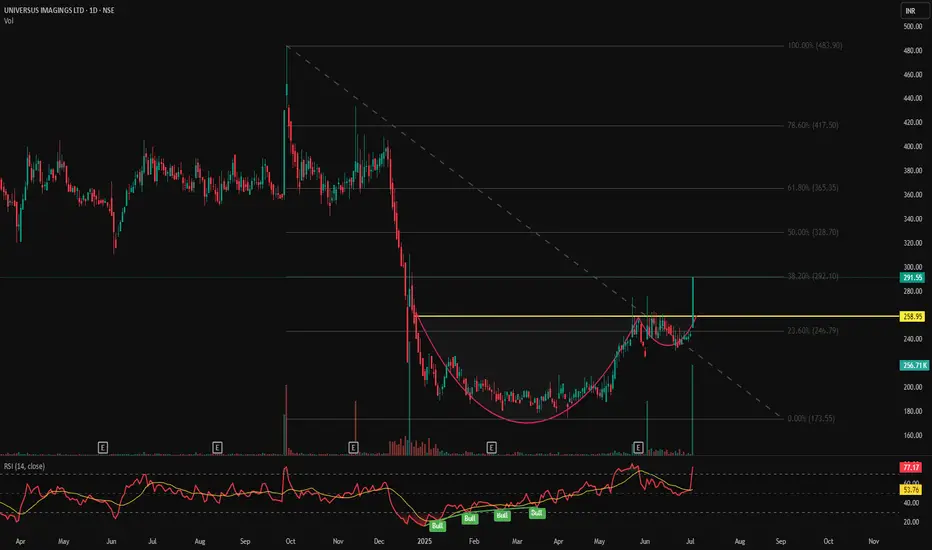
UNIVPHOTO - Cup & Handle Breakout | Daily Chart📊 UNIVPHOTO – Cup & Handle Breakout | Strong Volume | RSI Overbought | Fibonacci Confluence | Daily Chart
📅 Chart Date: July 3, 2025
📍 CMP: ₹291.55 (+20.00%)
📈 Symbol: NSE:UNIVPHOTO
🔍 Technical Analysis Summary
✅ Cup & Handle Breakout
Price has broken out above the neckline of the Cup & Handle pattern at ₹258.95 with strong bullish momentum.
Post-consolidation breakout visible with a solid bullish candle.
📊 Fibonacci Retracement Levels (Swing: ₹173.55 to ₹483.90)
23.60% – ₹246.79
38.20% – ₹292.10 ✅ (Price nearing this level – short-term resistance)
50.00% – ₹328.70
61.80% – ₹365.35
78.60% – ₹417.50
100% – ₹483.90 🎯
📈 RSI Indicator (14)
RSI has surged to 77.17, indicating strong momentum but entering overbought territory.
RSI breakout with multiple prior bullish divergences validated the upside move.
📉 Volume
Current breakout supported by above-average volume (256.71K) adds credibility to the move.
🏁 Key Technical Levels
Neckline Breakout: ₹258.95 ✅
Immediate Resistance: ₹292.10 (Fib 38.2%)
Next Targets: ₹328.70 → ₹365.35
Support Levels: ₹258.95 → ₹246.79
Major Swing Low: ₹173.55
💡 Trade Setup
Entry: On breakout confirmation above ₹259
SL: Below ₹246
Short-term Target: ₹292
Mid-term Target: ₹328 → ₹365
Risk Level: Medium (due to RSI overbought – may see retracement)
⚠️ Disclaimer
This chart is for educational and analytical purposes only. Please consult your financial advisor before making investment decisions.
This looks like a flyThe Global crude rates are down
The refining margins are going to go higher
Overall energy dependence only rises by the day
My feeling is that the Crude dependent stocks shall rise

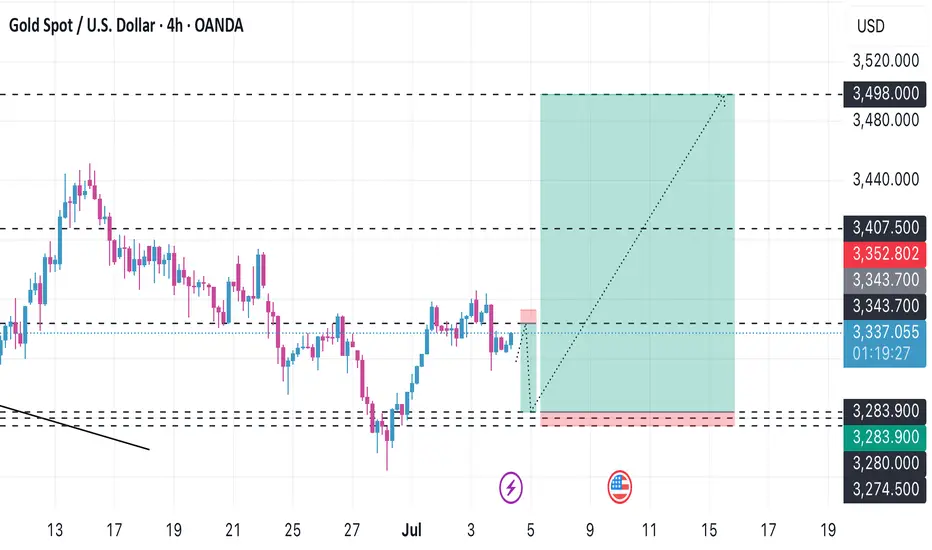
Update gold after the end of the second quarterToday is a normal Friday as usual the non-farm news will come out But the non-farm news came out a day before yesterday and today the bank will be closed for the 2nd quarter summary and I predict there will be a big gap, I will wait to buy in the lower zone and expect it to go back up to the 3,500 zone.
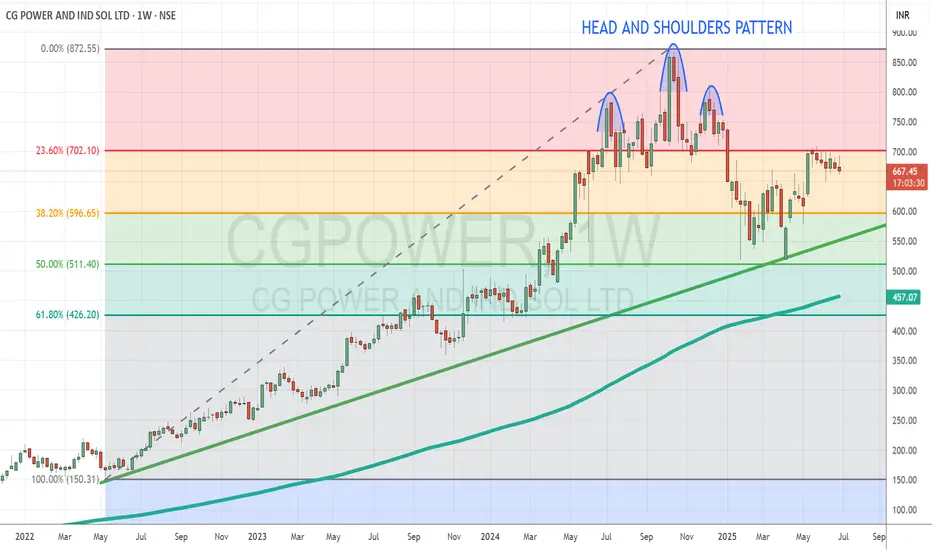
CG Power Rebounds After First Major Correction Supported by StroTopic Statement:
CG Power has made its first significant correction and is now set on a recovery path in line with the broader market rally.
Key Points:
* The stock respected a major trendline, receiving strong support during its recent correction
* It found repeated and substantial support at the 50% Fibonacci retracement level, reinforcing its base
* The correction was signaled by a head and shoulders pattern clearly marked on the chart, leading to the recent pullback before the recovery began
* The stock price is very expensive as it is mostly overextended above the 200 day exponential moving average
LIC Housing: A Correction That Refuses to End?After completing the first upward leg from the March low near 483.70, LIC Housing Finance rallied sharply to 623.90. This rise is being marked as wave 1 or A, depending on whether the structure develops into an impulse or a zigzag.
After that peak, a correction was expected. Initially, price dropped to 565.40 in a clear abc formation, which could have marked the end of wave 2 or B. However, the market didn’t follow through with a strong rally. Instead, price began moving sideways in a choppy, overlapping manner — a strong clue that the correction wasn’t over.
This overlapping price action evolved into a WXYXZ structure, a complex form of correction.
Here’s how the structure now looks:
The initial drop to 565.40 is being treated as wave a of a larger correction.
The sideways consolidation that followed is marked as wave b.
The current expectation is for a final wave c down — which would complete the full abc correction of a higher degree, labeled as wave 2 or B. The ideal target zone for wave c lies between 1x to 1.618x the length of wave a, projected from the end of wave b.
Support lies in the 568.80–532.65 zone. If price dips into this area and shows signs of reversal — particularly with bullish divergence on RSI — it could set the stage for the next leg higher in wave 3 or C.
The invalidation level for this count stands at 627.30. A sustained move above this level would negate the possibility of a wave c decline and instead suggest that a new impulsive leg has already begun.
Disclaimer: This analysis is for educational purposes only and does not constitute investment advice. Please do your own research (DYOR) before making any trading decisions.

#SAIL#SAIL has corrected about 40% from recent swing high and currently trading near 61.8% retracement zone + weekly 200 ema and parallel channel support confluence zone. On weekly tf, it is probably trying to make a double bottom.
Historidally, when it gave a breakdown below weekly 200 ema and unable to sustain above it, it continued to underperform for almost 8-10 years but now it is probably trying to take support around it.
Also, RSI is making HLs off late, which is probably a good sign.
In terms of R:R, this is currently a good bet on long side.
As usual, DYOR and this isn't a Buy or Sell reco - but just an educational purpose post

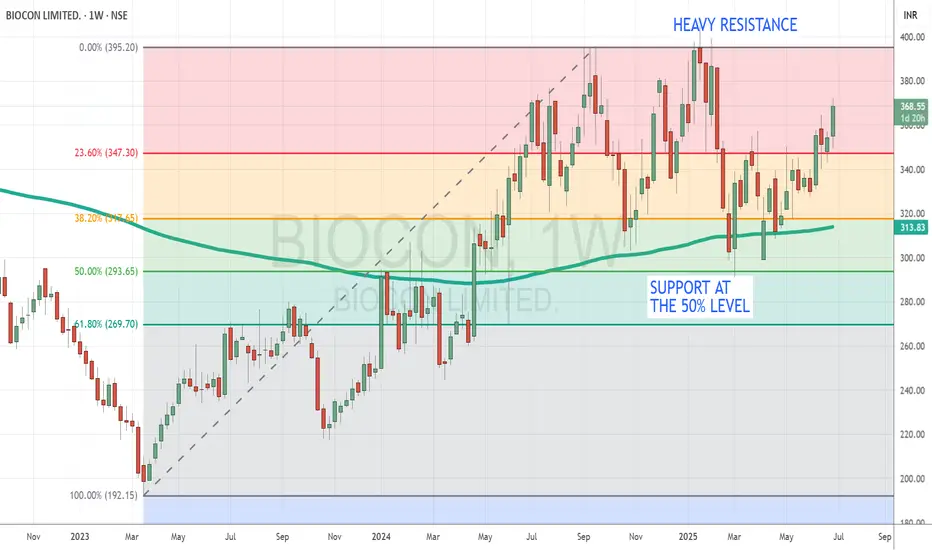
Biocon Trades in Volatile Range Between Strong Support and StiffTopic Statement:
Biocon's stock has been stuck in a broad sideways zone, oscillating between key support and resistance levels.
Key Points:
* The price has corrected and repeatedly found strong support at the 50% retracement level around 300
* It faces stiff resistance at 400, which has consistently acted as a tough barrier to further upside
* Overall, the price remains trapped in a volatile sideways zone between 200 and 400, limiting decisive directional moves
ENVIRO INFRA ENGINEERS (NSE: ENVIRO)View: Strongly Bullish.
Bias: Trend reversal confirmed.
Strategy:
BUY: Initiate around ₹240-₹245 or on retest of ₹230-₹235.
Targets (T):
T1: ₹262
T2: ₹287
T3: ₹312
Stop-Loss (SL): ₹220 (on daily closing basis).
Reasoning:
Decisive breakout from a significant long-term descending trendline.
Strong volume confirming the breakout.
RSI indicating robust bullish momentum.
Potential for significant upside as stock recovers from prior fall.
Note: This is an educational analysis and not financial advice. Do your own due diligence before investing.

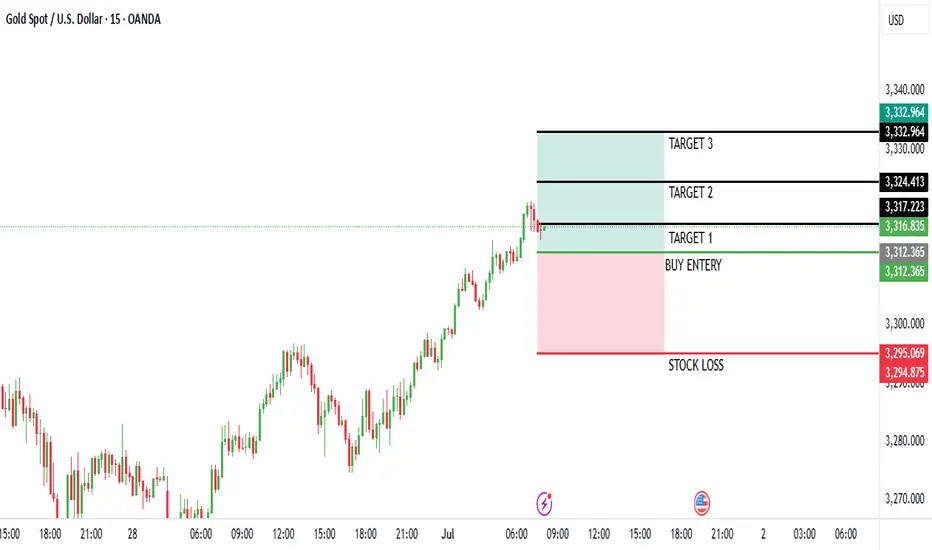
Trading Analysis for Gold Spot / U.S. Dollar (15-Minute Chart)
Based on the provided 15-minute chart for Gold Spot / U.S. Dollar (XAU/USD), published by NaviPips on TradingView.com on June 30, 2025, at 17:53 UTC, here’s a suggested trading setup for a buy position:
Current Price and Trend: The current price is 3,241.875, with a slight increase of +0.250 (+0.01%). The chart shows a recent downtrend that appears to be stabilizing near the current level, suggesting a potential reversal point.
Buy Entry: Enter a buy position at 3,312.875 (current price), as it aligns with a support zone where the price has found a base, indicated by the horizontal dashed line and recent consolidation.
Stop Loss: Place a stop loss at 3,295.250, below the recent low, to protect against further downside. This level is approximately 10.625 points below the entry, defining the risk.
Take Profit Levels:
Take Profit 1: 3,317.875, a conservative target about 20.000 points above the entry, aligning with a minor resistance zone.
Take Profit 2: 3,324.750, a mid-range target approximately 31.875 points above the entry.
Take Profit 3: 3,332.500, a deeper target about 45.625 points above the entry, indicating a potential trend reversal.
Price Action: The chart indicates a downtrend with a possible bottoming pattern near the current level. The support zone and upward candlestick suggest a buy opportunity if the price holds.
Risk-Reward Ratio: The distance to the stop loss (10.625 points) compared to the take profit levels (20.000 to 45.625 points) offers a favorable risk-reward ratio, ranging from approximately 1:1.9 to 1:4.3.
Conclusion
Enter a buy at 3,241.875, with a stop loss at 3,295.250 and take profit levels at 3,317.875, 3,324.750, and 3,332.500. Monitor the price action for confirmation of an upward move, and be cautious of a potential continued downtrend if the price breaks below the stop loss level. (Note: I assume "take profot" was a typo for "take profit" and have corrected it accordingly.)
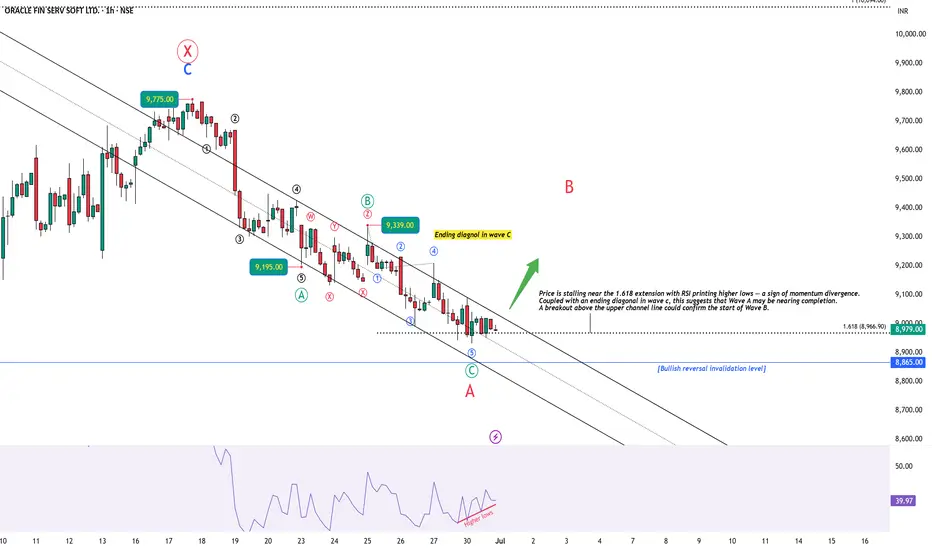
OFSS: Setting Up for a Relief Rally?🔍 Introduction
This analysis starts from the 1-hour timeframe, where price action shows signs of exhaustion at the tail end of a 5-wave decline. A classic ending diagonal in wave c, along with bullish RSI divergence, points toward a potential short-term reversal — possibly the start of Wave B in a larger A-B-C corrective structure. We then zoom out to place this setup within a broader W-X-Y correction that began from the 13,220 high.
🕐 1H Chart: Ending Diagonal + RSI Divergence into Key Zone
Following the peak at 9775, price has been declining in what appears to be a ABC zigzag correction. Subwave 5 (within wave c) exhibits ending diagonal behavior, with overlapping internals and weakening thrust. Importantly, RSI has been printing higher lows, diverging strongly against lower price lows — a signal of potential bottoming.
Price is also testing the 1.618 Fibonacci extension level. A decisive breakout above the upper trendline would confirm a likely transition into Wave B.
🟢 Watching closely for a decisive breakout / close above the channel.
📆 Daily Chart: W-X-Y Structure from 13,220 High
Zooming out, ORACLE FIN SERV is unfolding a W-X-Y correction from its 13,220 high:
Wave W completed as a zigzag down to 7038.
Wave X unfolded as a zigzag rally, peaking at 9775. Notably, Wave C of X did not reach 100% of Wave A — signaling internal weakness.
Wave Y is now developing as a red A-B-C structure, with Wave A possibly ending near the 8930 level.
🧠 Conclusion & Key Levels to Watch
Wave A of Y appears to be nearing completion, supported by:
Ending diagonal structure in wave C (1H)
RSI bullish divergence
Price stalling at 1.618 extension
A breakout above the channel could mark the start of Wave B — potentially retracing 38–61.8% of the drop from 9775
📌 This setup offers both short-term and structural clues. I’ll post follow-ups as this unfolds.
⚠️ Disclaimer
This post is for educational purposes only and does not constitute financial advice. Please do your own research and manage risk appropriately.
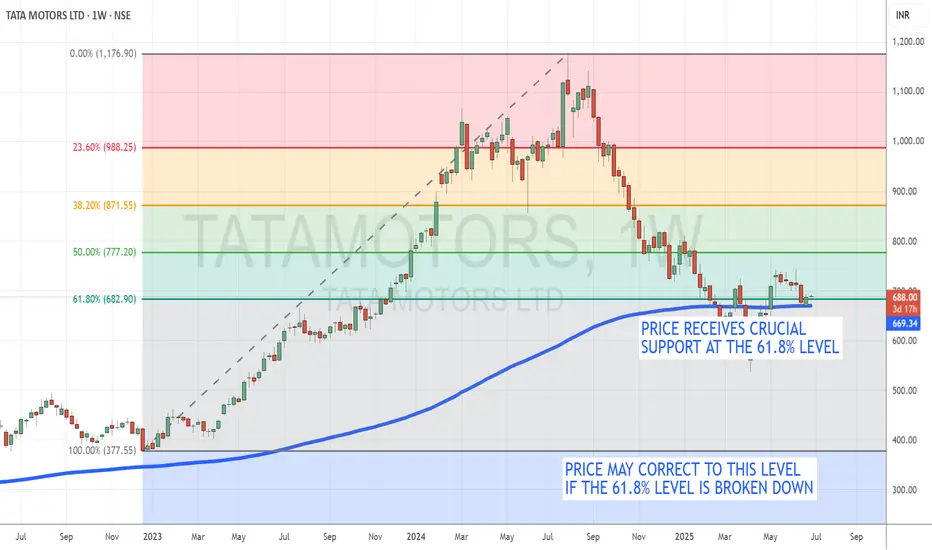
Tata Motors Holds at Key Support, Oversold Levels Hint at PotentTopic Statement:
Tata Motors, heavily beaten down and still oversold, is clinging to crucial support that could define its next move.
Key Points:
* The stock has repeatedly taken support at the 61.8% Fibonacci retracement level, where it currently trades even today
* Price is hovering just above the 180-day EMA, suggesting a delicate balance between support and further downside risk
* A move up is possible from this oversold level, but if support breaks, the price could slide further toward the 400 zone
Nifty ready to Test All Time High at 26100-200After weeks of consolidation Nifty has given a Strong Breakout with Comfortable Weekly Close above
0.78 Fib Retracement
In days to come Nifty could test 26000 Level again.
It will be interesting to see price action at 26000
Time being buy dips to 26000
Rest for the Next
Rationale
Taken Support at 0.23 Fib retracement and 20 MEMA
