UNIION BANK: Evergreen Fibonacci Retracement Setup1. 50-61.8% pullback setup in Fibonacci is timeless and rarely fails to impress.
2. RRR is favourable.
2. Trade can be planned accordingly managing the risk.
⚠️ Disclaimer: This is NOT a buy/sell recommendation. This post is meant for learning purposes only. Views are personal. Please, do your due diligence before investing.⚠️
💬 What are your thoughts on this share it in the comments below. ✌️
🔥 Happy Trading!✅🚀
Fibonacci

HERCULES HOISTS technical analysisHercules Hoisting Ltd. (NSE: HERCULES HOI. LTD.) is currently trading at INR 309.20. The company operates in the material handling and industrial equipment sector, providing hoisting solutions for infrastructure, manufacturing, and logistics industries. This company is part of Bajaj Group.
Key Levels
Support Levels: INR 77.36, INR 127.30, INR 169.29, INR 196.37
Swing Level: INR 309.20
Possible Upside Levels: INR 359.15, INR 422.75, INR 487.60
Technical Indicators
RSI: The Relative Strength Index (RSI) is currently at 59.97, indicating strong momentum but remaining below the overbought threshold, suggesting further upside potential if buying interest persists.
Volume: Trading volume has been consistent, reflecting steady investor participation. A spike in volume near resistance levels could confirm bullish movements.
Sector and Market Context
Hercules Hoisting Ltd. operates within the industrial equipment and logistics automation sector, which has seen rising demand due to increased manufacturing activity, automation in warehousing, and infrastructure growth. The industry benefits from government-led industrial expansion and private sector investments, though it faces challenges such as raw material price fluctuations, regulatory compliance, and competitive pressures from global players. Broader market conditions suggest positive sentiment in capital goods stocks, making industrial and equipment-related companies appealing to long-term investors.
Latest News and Developments
Market Trends: Increased adoption of automated material handling solutions, boosting prospects for hoisting and lifting equipment manufacturers.
Analyst Ratings: Analysts have projected stable revenue growth, citing expansions in industrial automation demand.
Quarterly Results: The company reported moderate earnings growth, supported by steady infrastructure investment inflows.
Dividend Update: Hercules Hoisting Ltd. has declared a dividend payout of ₹3 per share, reflecting stable cash flow management and shareholder commitment.
Analysis Summary
Hercules Hoisting Ltd. presents a bullish technical setup, with RSI and volume trends indicating strong investor engagement. Sector fundamentals remain positive, supported by automation-driven industrial growth and infrastructure expansion. Investors should monitor price movements near key resistance levels, macroeconomic indicators, and industrial investment trends before making strategic decisions. A balanced approach is advised, factoring in market cyclicality and sector-specific risks.

Crazy illiquid stock for small investorsBack in those days where picking value stocks and value picks was the style, here is the illiquid name that takes me back to what real markets are for.
The Polymatech which is making waves in Unlisted space is the promoter of this company and Mr. Eswaran is also taking this up at ₹18

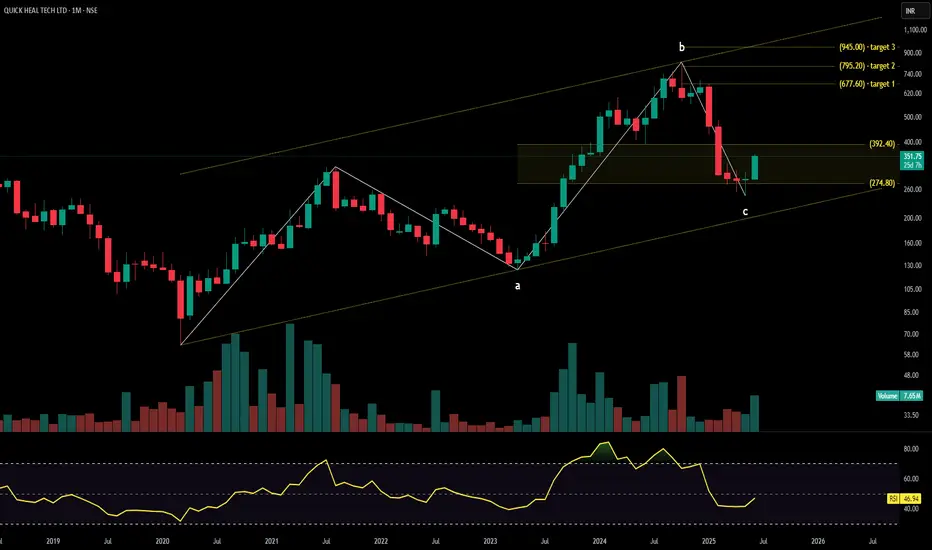
QUICK HEAL technical analysisQuick Heal Technologies Ltd. (NSE: QUICKHEAL) is currently trading at INR 351.75, reflecting a 23.14% increase. The company specializes in cybersecurity solutions, endpoint protection, and threat intelligence, catering to both enterprise and individual users.
Key Levels
Support Levels: INR 201.40, INR 276.85, INR 326.55
Swing Level: INR 351.75
Possible Upside Levels: INR 677.60, INR 795.20, INR 945.00
Technical Indicators
RSI: The Relative Strength Index (RSI) is at 46.94, indicating neutral momentum. The stock is neither overbought nor oversold, suggesting a consolidation phase.
Volume: Trading volume is 7.65M, reflecting strong investor interest. High volume near critical price levels could confirm breakout potential.
Sector and Market Context
Quick Heal Technologies operates in the cybersecurity and software sector, benefiting from the increasing global demand for digital security solutions due to rising cyber threats and regulatory compliance requirements. The cybersecurity industry remains resilient, with organizations prioritizing investment in advanced security frameworks. However, factors such as competition from global cybersecurity firms, pricing pressures, and evolving technology trends could impact the company’s growth trajectory.
Latest News and Developments
Market Trends: Increased cybersecurity spending in enterprise and government sectors, supporting growth prospects.
Analyst Ratings: Analysts project steady revenue growth, citing rising demand for endpoint security solutions.
Quarterly Results: The company has reported stable earnings, though R&D investments have slightly impacted margins.
Dividend Update: Quick Heal Technologies Ltd. has announced a dividend payout of ₹5 per share, reinforcing investor confidence in its financial position.
Analysis Summary
Quick Heal Technologies Ltd. exhibits neutral-to-bullish technical indicators, with RSI signaling steady positioning and volume trends confirming strong investor interest. Sector tailwinds—such as rising cybersecurity concerns and corporate security investments—support long-term potential, though macroeconomic factors and competitive pressures should be monitored. Investors should watch price movement near swing levels, industry trends, and earnings updates before making strategic decisions.
Bitcoin (BTC) Technical Analysis for the Week of Jue 02 -June 09Technical Analysis
Price Action: Bitcoin is consolidating around $105,000–$108,000 after a sharp rally from April lows (~$74,000) and a peak near $112,000. A recent 3% correction was driven by profit-taking, with BTC stabilising near $106,000.
Trend: Medium-term trend remains bullish, but momentum is slowing. BTC has broken the previous resistance , indicating a potential slower rise or horizontal movement.
Note : Indicator MACD making bearish diversions in my view its not strong .
Key Levels:
Support: ~$102,600–$103,500 (recently tested)
Resistance: ~$106,000 (current resistance) and $110,500–$123,000 (next major target).
-- Disclaimer --
This analysis is based on recent technical data and market sentiment from web sources. It is for informational purposes only and not financial advice. Trading involves high risks, and past performance does not guarantee future results. Always conduct your own research or consult a SEBI-registered advisor before trading.
#Boost and comment will be highly appreciated

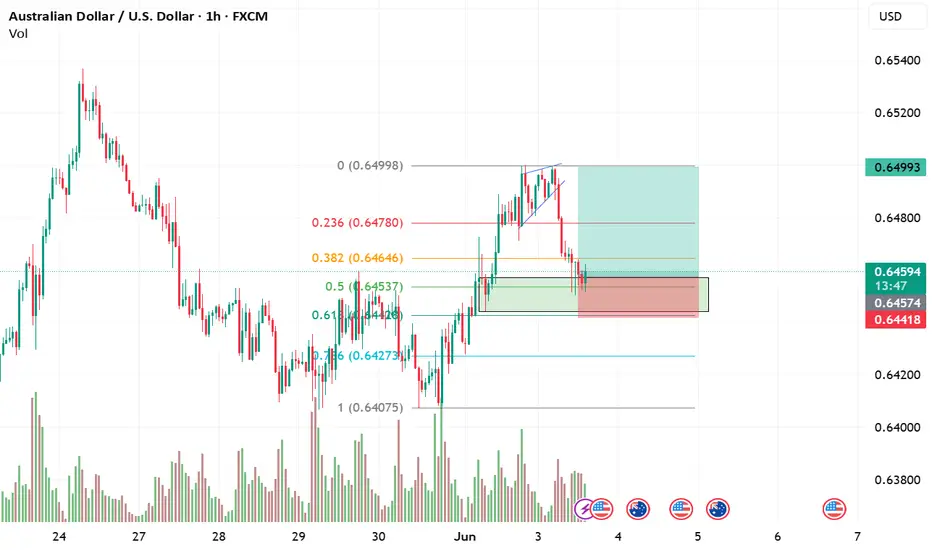
AUDUSD Long Idea : Fib and Demand zoneBullish Idea on AUDUSD at the demand zone which is occurring at Fib retracement of 0.5 and 0.618. On a good confirmation candle at this zone could be a possible good long trade.
Bullish Idea for EURUSD with Confluence strategyIf EURUSD corrects till the demand zone marked which is Fib retracement of 0.618 after trend line breakout and if given a proper confirmation candle at the zone there is chance for possible bullish trade.

The short term looks fantasticAfter the extreme squeeze the Silver price is stuck in a range
That range can break on the upside once the Fib range breakout above the shown zone happens
I have drawn a reverse Fib from the recent high to low that happened over just 3 days.
Overall, TVC:SILVER looks great in the Short term, medium term and long term.

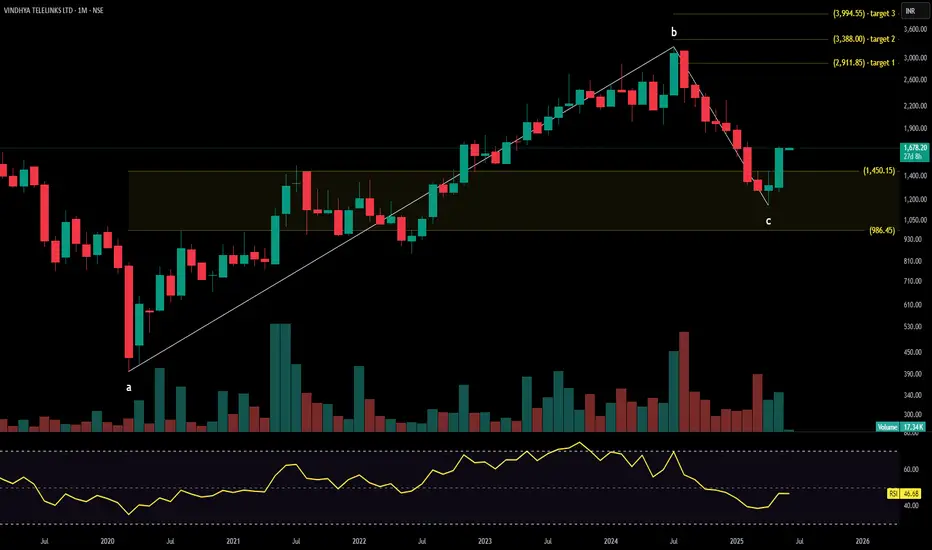
VINDHYA TELELINKS technical analysisVindhya Telelinks Ltd. (NSE: VINDHYATEL) is currently trading at INR 1,678.20. The company specializes in telecommunication cables, EPC (Engineering, Procurement, and Construction) services, and optical fiber solutions, serving industries such as telecom, infrastructure, and defense.
Key Levels
Support Level: INR 1,278.90
Swing Level: INR 1,911.40
Possible Upside Levels: INR 2,911.85, INR 3,388.00, INR 3,994.55
Technical Indicators
RSI: The Relative Strength Index (RSI) is at 46.68, indicating neutral momentum. The stock is neither overbought nor oversold, suggesting consolidation before a decisive move.
Volume: Trading volume is moderate, showing steady investor participation. Volume confirmation around resistance or support levels will be critical for future price direction.
Sector and Market Context
Vindhya Telelinks operates within the telecommunications infrastructure and EPC sector, which has seen consistent demand growth due to India’s push for digital connectivity, fiber network expansion, and smart city developments. The company benefits from government-backed projects and private sector investments in high-speed broadband infrastructure. However, macroeconomic factors, competition from domestic and international players, and execution challenges can influence stock performance.
Latest News and Developments
Market Trends: Increased private investment in 5G infrastructure and fiber optic network expansion, benefiting telecom cable providers.
Analyst Ratings: Recent reports highlight stable revenue generation, though margins remain sensitive to raw material costs and contract execution timelines.
Quarterly Results: Vindhya Telelinks reported steady earnings, supported by robust order flows and improved operational efficiencies.
Dividend Update: The company has declared a final dividend of ₹16 per share (160%) for 2025. In the previous year (2024), it announced a ₹15 per share (150%) final dividend. This consistent payout reflects financial stability and commitment to shareholder returns.
Analysis Summary
Vindhya Telelinks Ltd. presents a neutral-to-bullish technical outlook, with RSI reflecting steady positioning and volume trends confirming continued investor engagement. The stock’s sector alignment with India’s fiber expansion plans supports long-term growth potential, though macro risks—such as contract execution and supply chain volatility—should be monitored. Investors should track price movement near swing levels, sector-wide developments, and company-specific financial updates before making strategic decisions.
IDEA : At End of Bearish trend ; Expect correction or Bullish Idea showing 5 waves falling from Rs19 - 6Rs ; if price undergo for a correction expect minimum Rally 11Rs( i.e 38.2%) ,and maximum 15Rs.

BREAKOUT IN GRSE -- BULLISH VIEW-- Educational purposeBREAKOUT ABOVE 52 WEEK HIGH-- BULLISH VIEW
Fresh breakout seen above 52 week high
Increased volumes seen since last 2-3 months
Entry level : 2815 (retest) Need to wait for retest level.
Fibo Targets :
Target 1 : 4445 (35%)--12 months
Target 2 : 6085 (116%)--36 months
Stoploss : weekly closing below 2345 (-18%)
ONLY INVESTMENT VIEW-- NOT FOR SHORT TERM

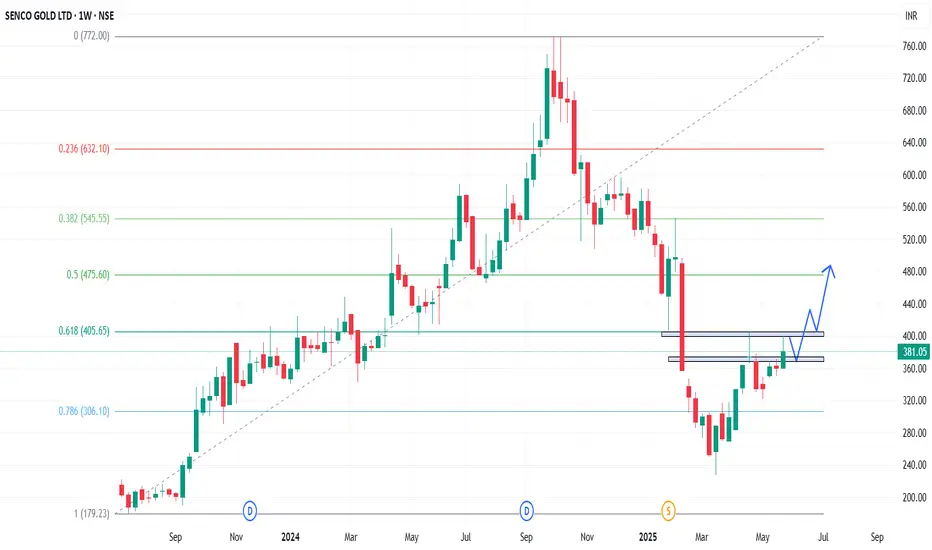
SENCO - Weekly AnalysisIn the Weekly Chart of SENCO ,
we can see that; it has a perfect rejection at 2nd FIBO level of 405.
400-405 level acts as strong resistance.
Also we can see that we can see a Cup & Handle breakout in coming weeks.
Expected momentum is shown in chart.
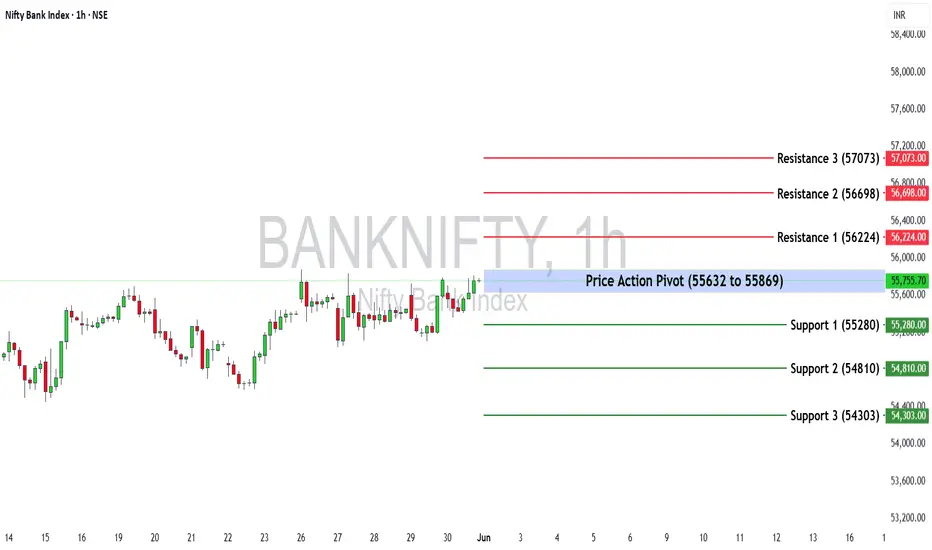
Bank Nifty Weekly Insights: Key Levels & TrendsBank Nifty ended the week at 55,749.70 with a gain of 0.63%
Key Levels for the Upcoming Week
🔹 Price Action Pivot Zone:
The critical range to monitor for potential trend reversals or continuation is 55,632 to 55,869
🔹 Support & Resistance Levels:
Support Levels:
S1: 55,280
S2: 54,810
S3: 54,303
Resistance Levels:
R1: 56,224
R2: 56,698
R3: 57,073
Market Outlook
✅ Bullish Scenario: A sustained move above 55,869 could trigger buying momentum, potentially driving Bank Nifty towards R1 (56,224) and beyond.
❌ Bearish Scenario: If the index falls below 55,632, selling pressure may increase, pulling it towards S1 (55,280) and lower levels.
Disclaimer: lnkd.in
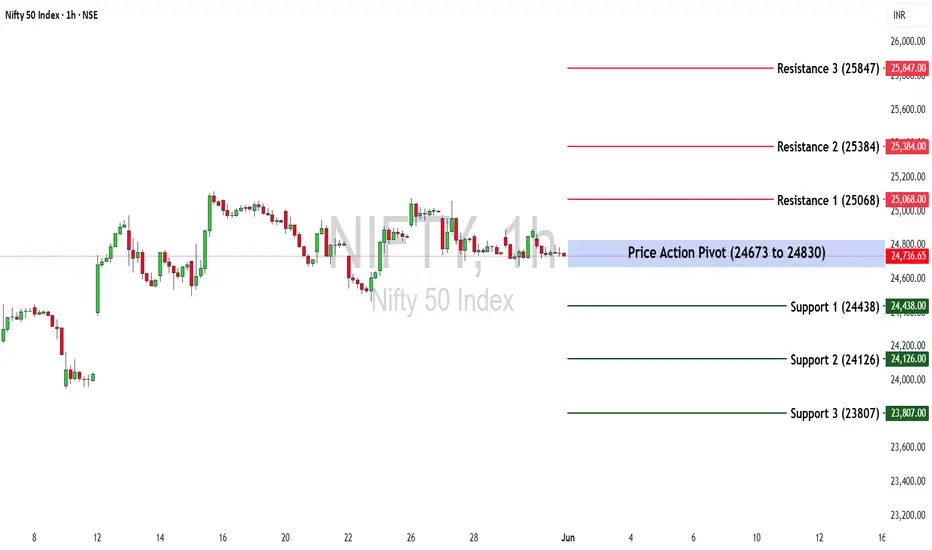
Nifty 50 at a Turning Point? Key Levels & Market Outlook AheadThe Nifty 50 ended the week at 24,750.70 with a loss of (-0.41%)
If Nifty sustains below 24,673, selling pressure may increase. However, a move above 24,830 could restore bullish momentum.
Key Levels for the Upcoming Week
🔹 Price Action Pivot Zone:
The crucial range to watch for potential trend reversals or continuation is 24,673 -24,830.
🔹 Support & Resistance Levels:
Support:
S1: 24,438
S2: 24,126
S3: 23,807
Resistance:
R1: 25,068
R2: 25,384
R3: 25,847
Market Outlook
✅ Bullish Scenario: A sustained breakout above 24,830 could attract buying momentum, driving Nifty towards R1 (25,068) and beyond.
❌ Bearish Scenario: A drop below 24,673 may trigger selling pressure, pushing Nifty towards S1 (24,438) or lower.
Disclaimer: lnkd.in
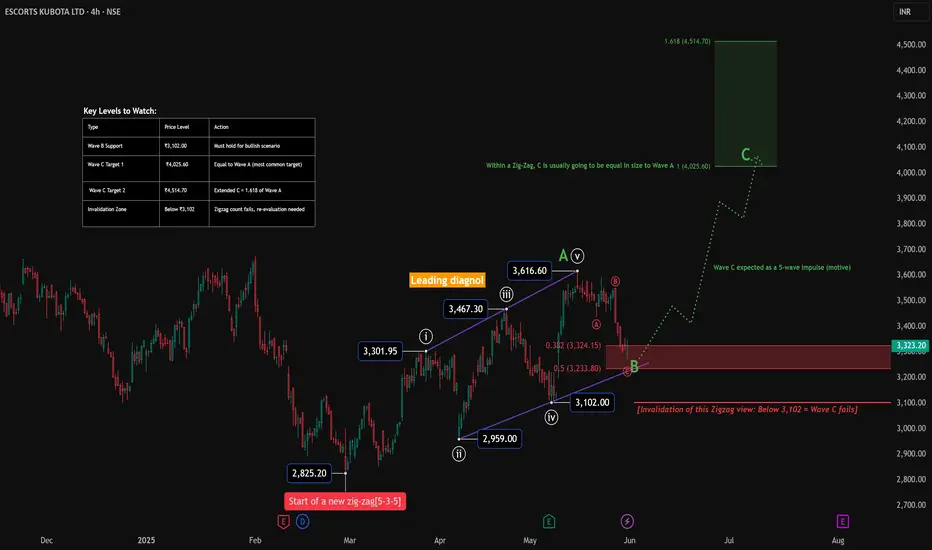
Zigzag in Play- Can Wave C deliver the goods for ESCORTS KUBOTA?ESCORTS KUBOTA – A Zigzag Taking Shape
Structure Summary:
ESCORTS may be unfolding a classic Zigzag correction (5–3–5) from the low at ₹2,825.20. Wave A formed a clean leading diagonal. Wave B is currently developing and is expected to end near the 0.382–0.5 retracement of Wave A.
If this structure holds, we could soon see a powerful Wave C impulse aiming for the 4,000+ zone.
Elliott Wave View:
Wave A : Leading diagonal from ₹2,825.20 to ₹3,616.60
Wave B : Still developing – may complete near ₹3,233.80 (0.5 retracement)
Wave C : Expected to be a 5-wave impulse targeting:
₹4,025.60 (1.0 × Wave A)
₹4,514.70 (1.618 × Wave A)
Key Levels to Watch:
Wave B Support Zone: ₹3,233–₹3,102
Target 1: ₹4,025.60 (equal to Wave A)
Target 2: ₹4,514.70 (1.618 × Wave A)
Invalidation : Below ₹3,102 → Zigzag scenario fails, alternate count required
Note:
Wave C, if it triggers, should develop as a 5-wave impulse. Price action around the retracement zone will decide whether bulls still have control.
Disclaimer:
This is part of the educational WaveTracker series. It is not a trading recommendation.
Always DYOR and manage risk wisely.
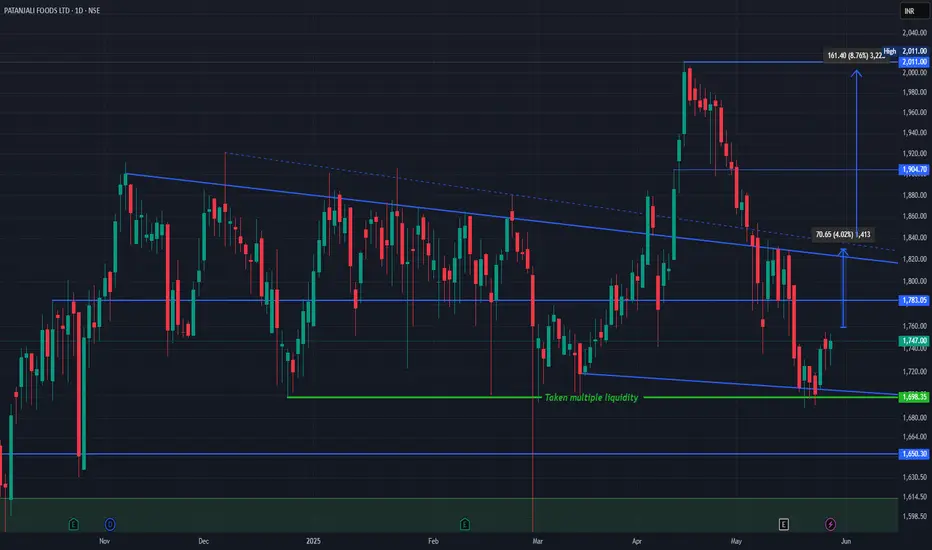
Patanjali Foods Ltd (NSE: PATANJALI) technical chart breakdown.Patanjali Chart Structure & Price Action
The stock has been trading within a descending channel, bounded by the blue trendlines.
It recently bounced from a major demand zone (~₹1,698) marked by the green support line that has absorbed liquidity multiple times ("Taken multiple liquidity").
Price is now slowly recovering from this base.
Current Scenario
CMP: ₹1,747
Immediate Resistance:
₹1,783 (horizontal level)
₹1,818–₹1,835 zone (upper boundary of the falling channel)
Break and sustain above ₹1,783–₹1,835 could trigger a trend reversal.
Upside Targets
Target 1: ₹1,830/Target 2: ₹1,904
Previous structural high Target 3: ₹2,011 Recent swing high Total upside from breakout: ~8.76%
Support Levels
₹1,698 – Critical demand zone (green)
₹1,650 – Next strong support
₹1,570 – Long-term support base (green zone)
Simple Explanation
Patanjali Foods rebounded from a high-liquidity support area and is now showing signs of bullish recovery. A breakout above ₹1,783 could take it back to the ₹1,900–₹2,000 range. Risk is well-defined below ₹1,698. Watch for volume and price action confirmation near the upper channel.
Like, comment your thoughts, and share this post
Explore more stock ideas on the right hand side your feedback means a lot to me!
Disclaimer: This post is for educational purposes only and should not be considered a buy/sell recommendation.
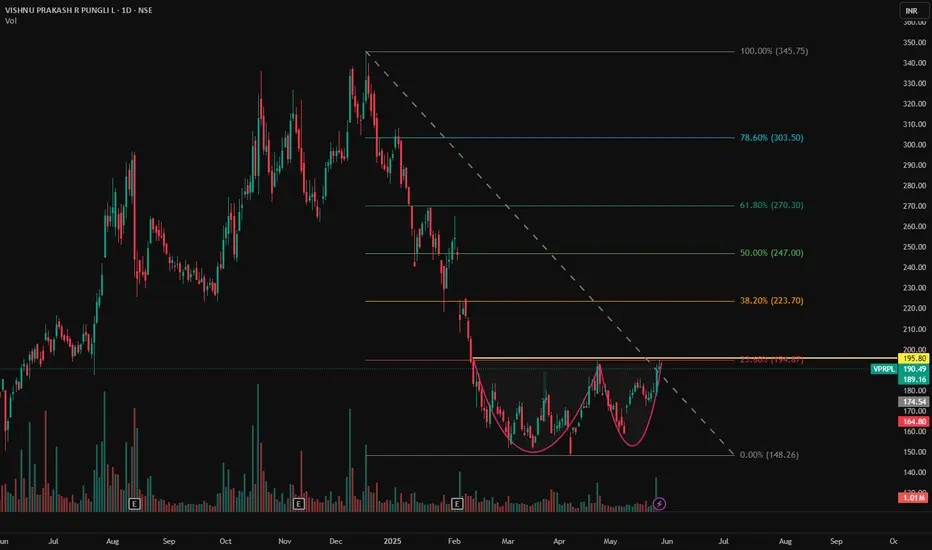
VPRPL - NSE | Daily Timeframe📊 VISHNU PRAKASH R PUNGLIA LTD (VPRPL) – NSE | Daily Timeframe
📅 Date: May 29, 2025
📈 CMP: ₹190.49 (−0.41%)
📌 Ticker: NSE:VPRPL
🧠 Technical Overview
✅ Cup & Handle Pattern in Formation 🍵
Price action is carving out a clean Cup & Handle base near the ₹195.80 resistance zone. A breakout above this neckline could ignite a fresh upside rally. The symmetry, volume spike, and recent bullish structure are all supporting potential continuation.
🧪 Volume Analysis
Noticeable volume increase as the price nears breakout zone, indicating accumulation and rising interest.
📍 Key Levels to Watch
🟡 Breakout Resistance:
₹195.80 (horizontal neckline)
🟢 Support Zone:
₹174.50 (base support of the cup)
₹165 (lower handle risk zone)
🎯 Potential Targets (Post Breakout):
₹220
₹240
₹265 (pattern-measured target zone)
💡 Trade Plan
Entry (on breakout): ₹196+ (with strong volume confirmation)
Stop Loss: Below ₹174
Target Range: ₹220–₹265
Risk-Reward: ~1:2.5+
⚠️ Disclaimer
This chart analysis is for educational purposes only. Always DYOR (Do Your Own Research) and consult a financial advisor before making investment decisions.
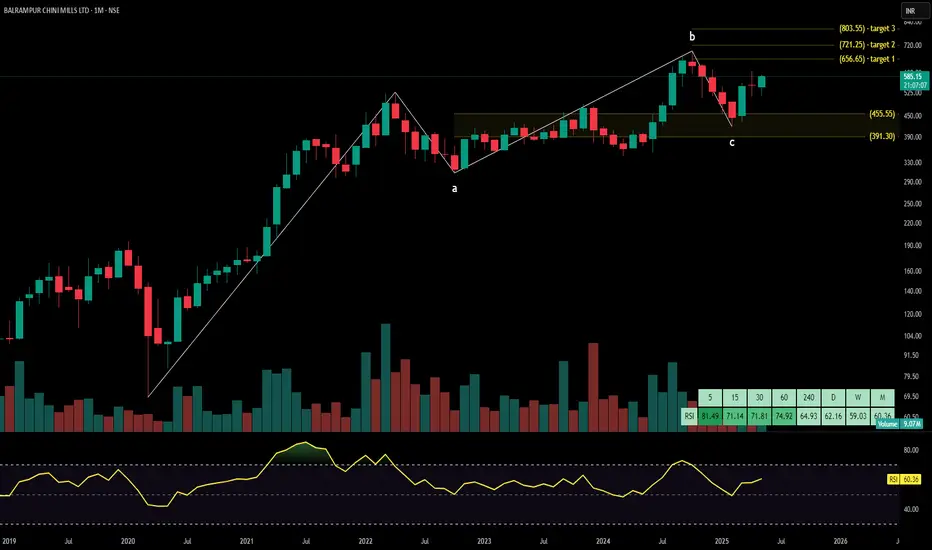
BALRAMPUR CHINI MILLS technical analysisBalrampur Chini Mills Ltd. (NSE: BALRAMCHIN) is currently trading at INR 585.15. The company is one of India's leading integrated sugar manufacturers, engaged in sugar production, ethanol manufacturing, and cogeneration of power from sugarcane byproducts.
Key Levels
Support Level: INR 391.30, INR 455.55, INR 483.40, INR 523.25
Swing Level: INR 585.15
Possible Upside Levels: INR 656.65, INR 721.25, INR 803.55
Technical Indicators
RSI: The Relative Strength Index (RSI) is currently at 60.36, suggesting strong momentum as the stock approaches the overbought zone. This indicates bullish sentiment with potential for further price gains.
Volume: Trading volume is 9.07M, reflecting high investor participation. Increased volume around key price levels may confirm breakouts or trend reversals.
Sector and Market Context
Balrampur Chini Mills Ltd. operates in the sugar industry, which remains highly cyclical and dependent on government policies, weather conditions, and global sugar prices. The ethanol blending initiative in India has boosted industry-wide demand, with sugar mills increasingly focusing on ethanol production to diversify revenue streams. Additionally, government-imposed minimum support prices for sugarcane and export restrictions continue to shape pricing dynamics. The broader market outlook suggests positive momentum for sugar stocks, driven by higher ethanol demand, stable domestic sugar consumption, and global supply constraints.
Latest News and Developments
Market Trends: Institutional investors remain bullish on sugar stocks due to strong ethanol demand and favorable regulatory policies.
Analyst Ratings: Some analysts forecast steady revenue growth, highlighting ethanol's increasing contribution to earnings.
Quarterly Results: The company reported improved earnings, supported by higher sugar prices and stable ethanol production margins.
Dividend Update: The firm has maintained a consistent dividend payout, reinforcing confidence in long-term profitability.
Analysis Summary
Balrampur Chini Mills Ltd. exhibits strong technical momentum, with RSI and volume indicating continued investor interest. Sector dynamics remain favorable, driven by government support for ethanol and steady sugar consumption. Investors should monitor commodity price trends, policy developments, and macroeconomic indicators before making strategic decisions. A balanced approach is advisable, considering cyclical industry risks alongside growth opportunities.
Update gold scal sellThis sell-off point is a confluence of three factors: fibo, trend line and supply.
Coincidentally, this pattern happened once in late May 2024, last year.

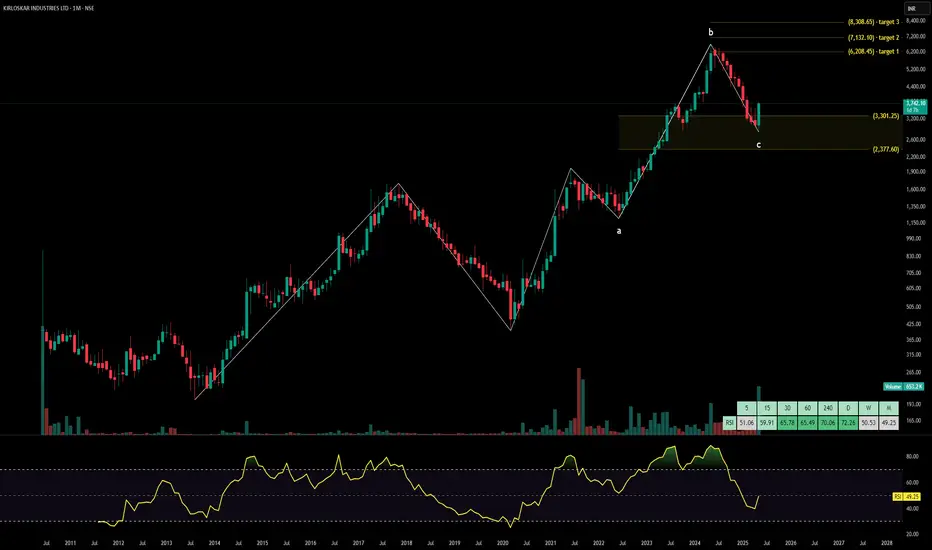
KIRLOSKAR INDUSTRIES technical analysisKirloskar Industries Ltd. (NSE: KIRLOSIND) is currently trading at INR 3,742.10, reflecting a 24.25% increase. The company operates in the industrial and engineering sector, specializing in infrastructure, manufacturing, and capital goods, with a strong footprint in real estate and investments.
Key Levels
Support Level: INR 2,377.60, INR 3,301.25, INR 3,728.40
Swing Level: INR 4,296.05
Possible Upside Levels: INR 6,208.45, INR 7,132.10, INR 8,308.65
Technical Indicators
RSI: The Relative Strength Index (RSI) is at 49.25, indicating neutral momentum. The stock is hovering in a balanced state, neither overbought nor oversold, signaling potential stability.
Volume: Trading volume has increased, suggesting heightened investor interest and potential price momentum confirmation toward resistance levels.
Sector and Market Context
Kirloskar Industries Ltd. operates in the capital goods and diversified engineering sector, which benefits from government-backed infrastructure development, industrial modernization, and investment-led growth strategies. The industry has witnessed steady expansion, bolstered by manufacturing incentives, technological upgrades, and increasing demand for engineering solutions. However, raw material cost fluctuations, supply chain efficiency, and cyclical economic impacts could influence long-term trends.
Latest News and Developments
Market Trends: Strong institutional inflows into industrial stocks amid optimism surrounding India’s manufacturing growth.
Analyst Ratings: Recent outlooks suggest potential scalability, driven by diversified business verticals and positive earnings revisions.
Quarterly Results: The company posted robust revenue growth, supported by improved operational efficiencies and higher real estate holdings.
Dividend Update: No recent dividend announcements, signaling a reinvestment strategy for capacity expansion.
Analysis Summary
Kirloskar Industries Ltd. exhibits stable technical momentum, with RSI suggesting neutral positioning. Volume trends reinforce continued investor participation, while sector tailwinds align with long-term growth potential. Investors should monitor price action near key levels, macroeconomic indicators, and sector-wide performance before making investment decisions. A balanced approach is recommended, considering market trends and operational execution.
Forecast for Long Term for INJUSDT -- Current Market Overview --
Price (as of May 28, 2025): INJ/USDT is trading at approximately $15.01, with a 24-hour increase of 4.93–10.79% and a weekly gain of 23.1–24.94%.
# Market Sentiment: Recent Wave indicate bullish sentiment, with analysts noting a breakout from a monthly demand zone and support at a weekly fair value gap (iFVG). The price has broken a higher-time-frame (HTF) downtrend, suggesting potential for further upside.
Market Cap and Volume: INJ has a market cap of $1.5B and a 24-hour trading volume of $218.9M, reflecting strong liquidity and interest.
-- Technical Analysis --
Price Action and Key Levels
# Support: The price recently found support at the $9.32–$10.00 demand zone, with a low of $6.5 in the past six months. The weekly iFVG and monthly demand zone around $10–$11 have held, acting as strong support.
Resistance: Key resistance levels are at $16.13 (short-term), $20–$25 (weekly target), and $33 (top of a multi-year descending wedge). A break above $16.13 could signal a mid-term swing toward $48.
Price Structure: INJ is in a bullish phase, having broken out from a descending wedge on the weekly chart and reclaiming the 21-day EMA. The price is trading above the 50-day SMA ($10.02) and 200-day SMA ($14.03 projected for June), indicating bullish momentum.
-- Disclaimer --
This analysis is based on recent technical data and market sentiment from web sources. It is for informational purposes only and not financial advice. Trading involves high risks, and past performance does not guarantee future results. Always conduct your own research or consult a SEBI-registered advisor before trading.
Boost and comment will be highly appreciated

Update gold scalLimit sell 3311.5 sl 16.5 tp 3263
If this order does not hit, wait for the nearest bottom to break 3291.7 then place order 2:
Limit sell 3296.4 sl 3299.5 tp 3263

IFCI: Explosive Move Hits a Key WallTechnical Setup – IFCI Ltd. on the weekly timeframe chart
Current Price: ₹70.31
Breakout Confirmation: Price broke above major trendline resistance (dotted line) with strong volume
Volume Profile: Highest traded zone was around ₹42–₹50 (base built here)
Fibonacci Levels: 61.8% broken = bullish signal
Targets: 🎯 ₹91.56 (100% Fib level) 🎯 ₹161.79 (161.8% extended Fib target – long term)
📊 Fundamental Story – Government owned NBFC
Focused on infrastructure and industrial finance
Recent market rally shows renewed investor interest
Benefits from:
• PSU sector momentum
• Government capex push
• Improved asset quality & restructuring progress
Turnaround story in the making, driven by fundamentals + reform
Like, comment your thoughts, and share this post!
Explore more stock ideas on the right hand side your feedback means a lot to me!
Disclaimer: This post is for educational purposes only and should not be considered a buy/sell recommendation.
