BANKNIFTY – 1 Hour Chart Analysis🧭 Current Price: ₹52,415.15
(As per the chart at the time of screenshot)
🧊 Chart Structure & Observations
📉 Previous Drop: Strong bearish move to sub-₹49,200 levels, then a swift V-shape recovery.
✅ Support Held: Strong support observed at ₹49,156.95 (labelled in blue) and a visual uptrend origin point at ₹49,526.40.
🔼 Reversal: Clean bounce from the uptrend base through key Fibonacci pivot levels – S38, WP (Weekly Pivot), and now holding above R61.
📍 Key Fibonacci Pivot Levels
Pivot Level Price (₹) Note
R78 ~52,415 💥 Current resistance (testing zone)
R61 ~52,108 🎯 Recent breakout zone (now support)
R38 ~51,758 Former resistance
WP ~50,468 ⚖️ Mid-zone pivot (Neutral Zone)
S38 ~49,670 🧲 Lower pullback level
S78 ~48,827 🔻 Final bearish support
🟩 Bullish Confirmation Points
✅ Higher Highs and Higher Lows pattern post ₹49,200 support
✅ Strong recovery candles breaking pivot resistance cleanly
✅ Currently trading above R61, indicating bullish bias
📈 Trendline Projection: Long-term green dotted trendline aiming toward ₹55,000+ in continuation mode
🧠 Bias & Strategy
Market Mood Bias What to Do Notes
🔥 Bullish Uptrend Buy on dips to ₹52,100–₹51,750 R61 retest = potential entry zone
🧪 Cautious Neutral Wait for breakout above ₹52,500 That would clear out short sellers' zone
❌ Bearish Weak Break below ₹51,265 = alert Losing WP base = bears get aggressive again
--------------------
🧱 Major Resistance Block Ahead
The dark red zone above ₹53,000–₹54,000 is a strong historical supply zone.
If ₹52,800–53,000 breaks, expect a short squeeze into that block.
🔮 Short-Term Targets (Bullish Case)
Target 1: ₹52,800
Target 2: ₹53,500
Target 3: ₹54,500 (only on momentum continuation)
🧩 Suggested Setup (Swing Long)
Entry Zone: ₹52,150–₹51,800 (pullback to R61 or R38)
SL: ₹51,265 (below WP)
Target: ₹52,800 / ₹53,500
Risk-Reward: ~1:2+
Fibonacci

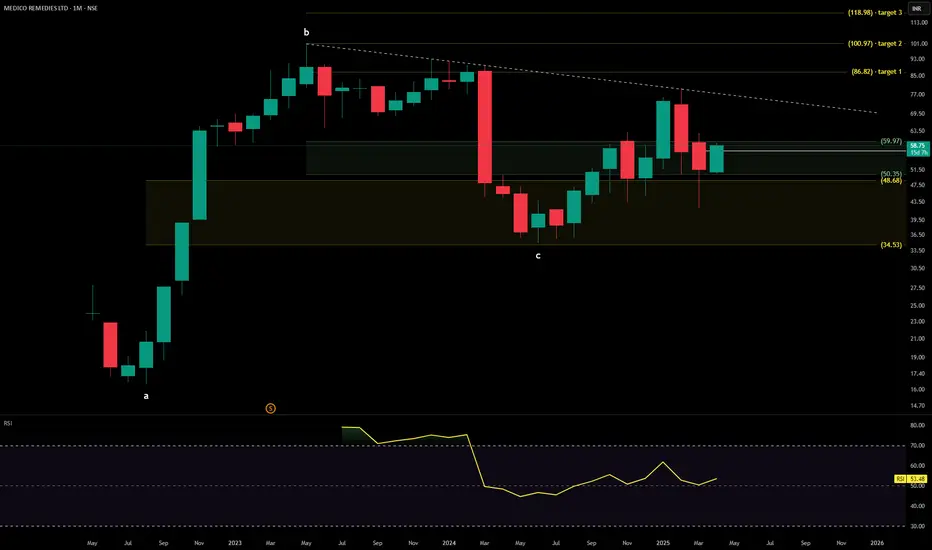
MEDICO REMEDIES technical analysisMedico Remedies Ltd. (NSE: MEDICO) is currently priced at 58.75 INR. The company specializes in manufacturing and marketing pharmaceutical formulations across various therapeutic segments.
Key Levels: Support levels are identified at 50.23 INR and 34.53 INR, suggesting potential price stabilization at these thresholds. The upside swing zone lies between 59.97 INR and 62.00 INR, indicating an area of possible upward momentum. Key upside levels are noted at 86.82 INR, 100.97 INR, and 118.98 INR, which could act as benchmarks for further price movements.
Technical Indicators: The Relative Strength Index (RSI) currently stands at 53.48, reflecting neutral momentum. RSI gauges the speed and magnitude of price changes, with levels above 70 indicating overbought conditions and below 30 signifying oversold conditions. Recent trading volume is recorded at 7.86 million, showcasing moderate activity that suggests the presence of investor interest and the potential for confirming price trends.
Sector and Market Context: Medico Remedies operates in the pharmaceutical sector, known for its resilience and strong demand. Recent trends in the pharmaceutical industry highlight growth potential due to heightened focus on health and wellness globally. While broader market volatility has influenced stocks across sectors, the pharmaceutical industry has demonstrated relative stability, outperforming several other sectors.
Risk Considerations: The stock faces risks such as regulatory changes, market competition, and dependency on global economic health. Factors like adverse clinical outcomes or shifts in healthcare policies could disrupt growth. Additionally, broader market risks, including interest rate fluctuations, inflation, and geopolitical developments, remain influential.
Analysis Summary: Medico Remedies Ltd. portrays a balanced technical outlook with neutral momentum and moderate upside potential if it surpasses the swing zone. The stock's alignment with a stable and resilient pharmaceutical sector supports growth prospects, although caution is warranted due to regulatory and market risks. Overall, the analysis suggests monitoring its progression for further insights without leaning towards a specific buy/sell directive.
Complete Beginner’s Guide to Fibonacci, AutoFibGaugeTitle:
Complete Beginner’s Guide to Fibonacci, AutoFibGauge, and How to Plan Perfect Trades! 🎯
⸻
Many traders hear about Fibonacci but don’t really know what it is or how to use it properly.
Here’s a full beginner-friendly guide covering everything — from the math basics to real trading strategies!
What is Fibonacci?
The Fibonacci Sequence is a set of numbers where each number is the sum of the two numbers before it.
It looks like this:
0, 1, 1, 2, 3, 5, 8, 13, 21, 34, 55, 89, 144…
This simple rule creates a pattern that we see everywhere in nature:
• In the way flowers bloom
• In the spiral of seashells
• In the structure of hurricanes
• Even in galaxies
Nature follows Fibonacci.
Markets, which are built by human emotions (fear, greed, hope), also often follow Fibonacci behavior.
That’s why Fibonacci is important in trading.
⸻
The Special Golden Ratio — 61.8%
From the Fibonacci sequence, if you divide a number by the next one (e.g., 21 ÷ 34), you get approximately 0.618 — or 61.8%.
This is called the Golden Ratio.
The Golden Ratio shows up in art, architecture, music, human faces, and… yes, financial markets.
In trading, the 61.8% retracement is considered the strongest potential turning point.
If a price pulls back by around 61.8%, there’s a high chance it will bounce and continue the trend.
⸻
What is Fibonacci Retracement in Trading?
In trading, after a big move (up or down), the market rarely moves in a straight line.
It pulls back (corrects) before continuing.
Fibonacci Retracement levels help us predict where the pullback might end and the trend might continue.
Commonly Used Fibonacci Levels:
• 23.6% — Very shallow retracement
• 38.2% — Healthy pullback
• 50.0% — Halfway mark (not a Fibonacci number, but widely watched)
• 61.8% — Golden zone (high probability area)
• 78.6% — Deep retracement before a reversal
Traders look at these levels as support and resistance zones.
⸻
What is AutoFibGauge?
Normally, drawing Fibonacci manually takes time — you have to find correct swings and plot retracement.
AutoFibGauge does it automatically:
• Detects swing highs and swing lows
• Plots Fibonacci retracement levels instantly
• Keeps updating live as price moves
✅ Saves time
✅ Reduces human error
✅ Keeps your chart clean and professional
It’s built for traders who want speed, simplicity, and reliability.
⸻
My Default Settings for AutoFibGauge:
• Swing Length: 25
• Fib Levels Displayed: 23.6%, 38.2%, 50.0%, 61.8%, 78.6%, 100%
• Mode: Automatic (finds swings without needing to adjust)
• Visual: Bands instead of just thin lines (for easier viewing)
Adjustment Tip:
• 15 min chart: Swing Length 20–25
• 1 Hour chart: Swing Length 25–30
• 4 Hour chart: Swing Length 30–40
Higher timeframes = Slightly bigger swing lengths.
⸻
How to Plan Entry:
1. Wait for price to approach a major Fibonacci level (especially 38.2%, 50%, or 61.8%).
2. Watch how the candles behave:
• If you see a bullish engulfing candle, hammer, or strong bounce from the level → Good sign to buy.
• If price hesitates or gives bearish reversal → Could signal continuation of downtrend.
3. Combine with trend confirmation tools (QMA, Parabolic SAR, moving averages).
✅ Remember: Confirmation is key.
Don’t just blindly buy or sell because price touched a level.
⸻
How to Plan Exit:
• Set first target at the next major Fibonacci level.
Example:
• If you enter near 61.8%, target 38.2% or 23.6%.
• Another method: Trail your stop-loss behind swing highs/lows as price moves in your favor.
✅ This way you lock profits even if the market reverses later.
⸻
When Fibonacci Works Well:
✅ In trending markets (clear uptrend or downtrend)
✅ When combined with price action or indicators
✅ After strong impulsive moves followed by natural pullbacks
⸻
When Fibonacci Might Not Work Well:
❌ In sideways (rangebound) markets
❌ During extreme news events or unexpected volatility
❌ When used alone without confirmation
Always remember — Fibonacci levels are not magical.
They are guidelines, not exact rules.
You need to combine them with market structure and momentum for best results.
⸻
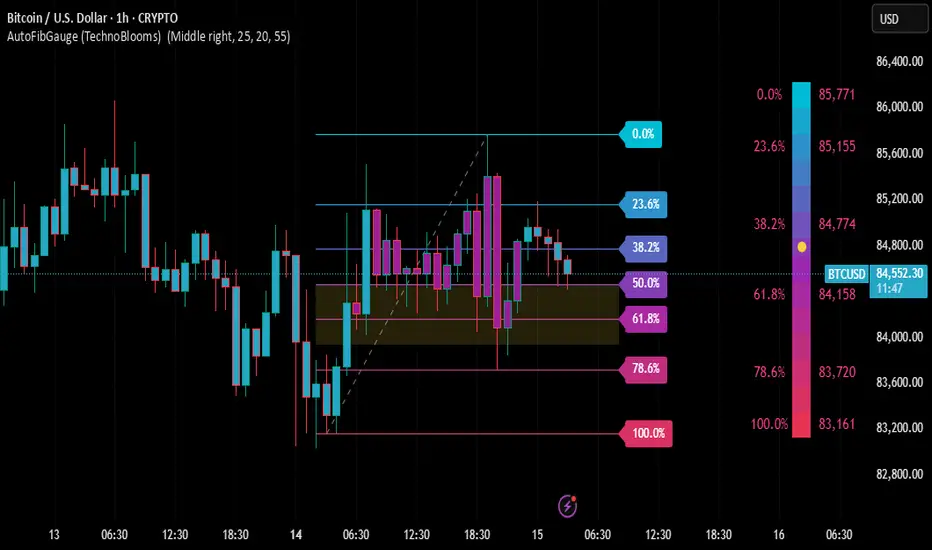
Real Example (BTC/USD 1H Chart):
• After a rally, price retraced into the 50%-61.8% zone.
• Bullish candles appeared showing price respecting the zone.
• This was an excellent opportunity to plan a long entry with Fibonacci guidance.
⸻
Final Words:
• Fibonacci is not only for “professional” traders — anyone can learn it.
• AutoFibGauge makes using Fibonacci simple and automatic, even if you’re just starting out.
• If you respect the levels, wait for confirmation, and follow a disciplined plan, Fibonacci becomes one of your best trading tools.
⸻
Found this helpful? Tap LIKE ❤ & FOLLOW ➕ for more beginner-to-advanced trading guides every week!
⸻
#Fibonacci #AutoFibGauge #FibonacciRetracement #TechnicalAnalysis #PriceAction #TradingTools #LearnTrading #CryptoTrading #ForexStrategy #SwingTrading #BeginnersGuide
Britannia Sustains Strength in Upward ChannelTopic Statement:
Britannia is maintaining its upward momentum as the stock continues to trade within a bullish up-trending channel.
Key Points:
- Price is moving in an up-trending channel, making it suitable for channel-based trading strategies.
- The stock recently retraced to the 38.2% Fibonacci level at 4800 and received strong buying support at that level.
- The 180-day EMA acts as a strong support zone for the stock.

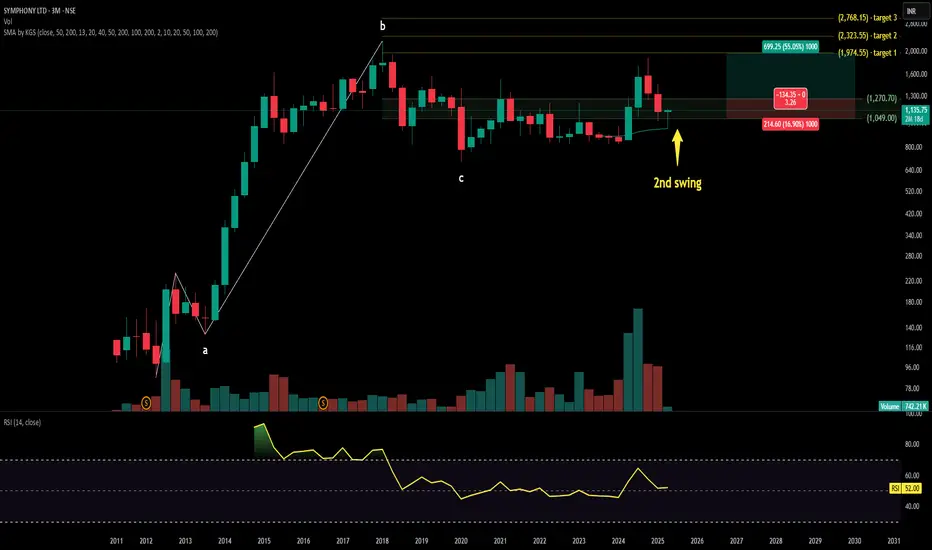
SYMPHONY technical analysis Stock Overview: Symphony Ltd., listed on the NSE, is currently trading at INR 1,135.75. The company specializes in manufacturing air coolers and industrial cooling solutions, recognized for its energy-efficient and innovative products.
Key Levels: The stock has a key support level at INR 576.15. The upside swing zone lies between INR 925.15 and INR 1,270.70. Possible upside levels are INR 1,974.55, INR 2,323.55, and INR 2,768.15.
Technical Indicators: The Relative Strength Index (RSI) is at 50.24, indicating neutral momentum as it is neither in the overbought nor oversold range. The trading volume is moderate at 742.21K, reflecting steady market participation.
Sector and Market Context: Symphony Ltd. operates within the consumer goods sector, particularly in the cooling solutions market. The sector has experienced consistent demand due to rising temperatures and a growing preference for energy-efficient products. Despite macroeconomic challenges like inflation and fluctuating interest rates, the consumer goods sector has shown resilience, supported by innovation and sustainability initiatives. Symphony’s performance aligns with these sectoral trends, maintaining stability amidst broader market volatility.
Risk Considerations: Key risks include potential fluctuations in raw material costs, which could impact production expenses. Additionally, heightened competition within the cooling solutions market and shifts in consumer preferences may influence market share. Broader macroeconomic factors, such as inflation, interest rate changes, and geopolitical events, could also affect stock performance. Regulatory changes and environmental policies may pose operational and financial challenges.
Analysis Summary: Symphony Ltd. demonstrates a stable performance with clearly defined support and upside levels. The RSI indicates neutral momentum, while trading volume reflects moderate activity. The flat MA lines suggest a consolidation phase. The stock’s alignment with sector trends highlights its resilience, though investors should remain cautious of risks such as raw material price volatility and competitive pressures. Overall, Symphony Ltd. presents a balanced outlook, with no direct buy or sell recommendations provided.
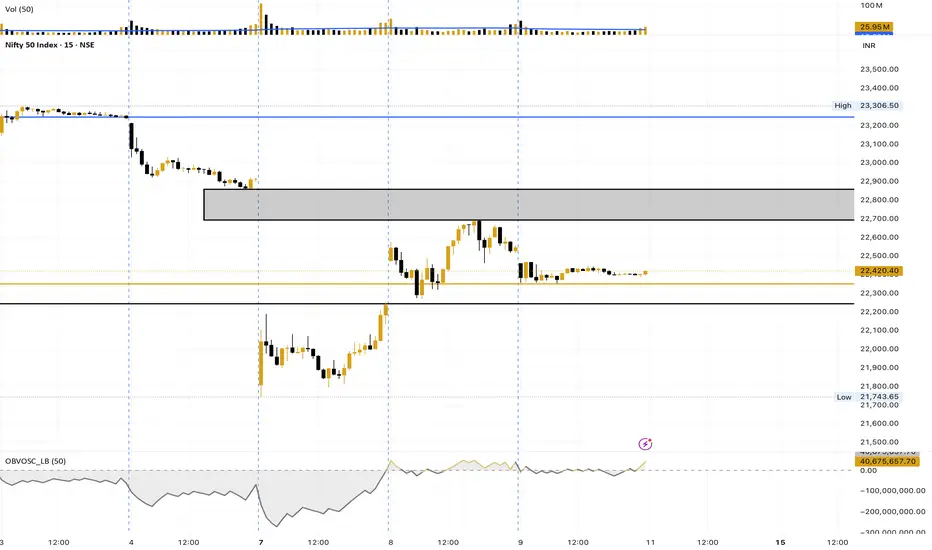
Nifty 50 Outlook (Intraday View): 10-Apr-2025.If the market opens with a gap up of around 600 points, Nifty is expected to cover the Fair Value Gap (FVG) from 22860 to 22700, which may trigger a profit booking phase initially.
After filling the gap, we could see a reversal or bounce-back from 22700 levels, aiming towards 23240, suggesting a highly volatile market today.
Key Levels to Watch:
FVG Zone: 22860 – 22700
Support Zone: 22700
Resistance Target: 23240
Trade Setup:
Be cautious during the FVG fill phase.
Look for reversal confirmation at 22700 for long trades.
Expect sharp swings—ideal for intraday traders with tight SL and quick targets.
Maruti Remains Strong Within Up-Trending ChannelTopic Statement:
Maruti has maintained its bullish momentum despite the broader market correction, supported by its strong up-trending channel.
Key Points:
- Price is moving within a well-defined up-trending channel, making channel trading favourable.
- The stock is taking support at the 23.6% Fibonacci retracement level at ₹11,300.
- Price is currently close to the 180-day EMA, providing additional support.

LAL PATH LAB technical analysisStock Overview: Dr. Lal Path Labs Ltd., NSE, current price: INR 2,667.75. Dr. Lal Path Labs Ltd. is a leading diagnostic and healthcare service provider in India, offering a wide range of tests and services.
Key Levels:
Support levels: INR 2,068.65, INR 1,476.85.
Upside swing zone: INR 2,710.75, INR 2,348.15.
Possible upside levels: INR 3,938.90, INR 4,530.70, INR 5,284.50, INR 7,461.35.
Technical Indicators:
RSI (Relative Strength Index) is at 50.20, indicating a neutral momentum.
Volume is at 2.6M, showing moderate trading activity.
MA (Moving Average) lines indicate the stock is currently above the long-term moving average, suggesting a potential upward trend.
Sector and Market Context: Dr. Lal Path Labs Ltd. operates in the healthcare sector, which has shown resilience and growth potential, especially in the post-pandemic era. The overall market trends indicate a cautious optimism with healthcare stocks generally performing well due to increased demand for diagnostic services.
Risk Considerations: Potential risks include regulatory changes, market volatility, and competition within the healthcare sector. Economic downturns or adverse events could also impact stock performance.
Analysis Summary: Dr. Lal Path Labs Ltd. shows a balanced technical outlook with key support levels providing a safety net and potential upside levels indicating room for growth. The stock's performance is aligned with sector trends, but investors should remain cautious of market conditions and sector-specific risks.

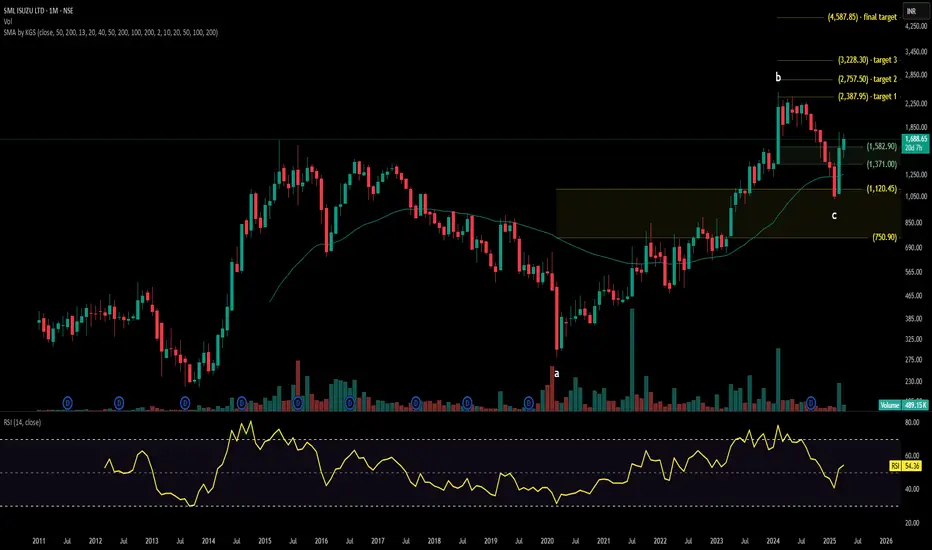
SMLISUZU technical analysisTechnical Analysis Report
Stock Overview: SML ISUZU LTD, NSE, current price: ₹1,688.65. SML ISUZU LTD is engaged in the manufacturing and sale of commercial vehicles and related components.
Key Levels:
Support: ₹750.90, ₹1,120.45
Upside swing zone: ₹1,371.00, ₹1,582.90
Possible upside levels: ₹2,387.95, ₹2,757.50, ₹3,228.30, ₹4,587.85
Technical Indicators:
RSI (Relative Strength Index) is currently at 54.36, indicating a neutral momentum.
Volume is at 489.15K, showing moderate trading activity.
MA (Moving Average) is trending upwards, suggesting a potential bullish trend.
Sector and Market Context: SML ISUZU LTD's performance should be analyzed in the context of the commercial vehicle sector, which has shown resilience and growth potential. The overall market trends indicate a recovery phase, with increased demand for commercial vehicles.
Risk Considerations: Potential risks include market volatility, changes in regulatory policies, and economic conditions that could impact the commercial vehicle industry. Additionally, supply chain disruptions and fluctuating raw material prices might influence stock movement.
Analysis Summary: SML ISUZU LTD shows promising technical indicators with potential upside levels. However, investors should consider sector performance and market conditions, along with possible risks, before making investment decisions.
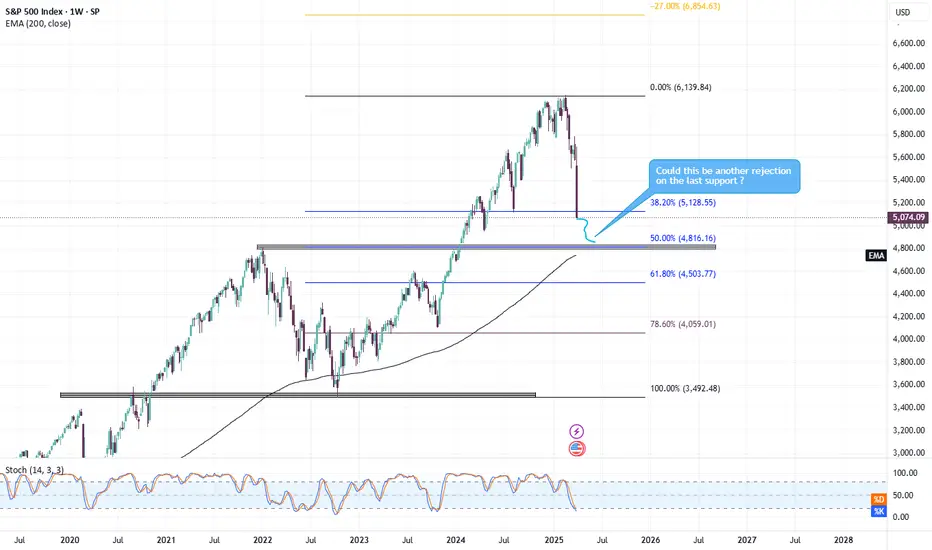
SPX LONGLooking at the chart right here, as we can see the S&P 500 is bottoming, and we will see the same thing happened on 9 May 2022, so what I see or expect from the 2025 correction is rejection to the 50% fibonacci retracement which is around 20% or we can expect a deeper correction which is to the 61.80% and also with the rejection to the MA200 and hope it bounces back up, let me know what do you guys think about SP500 right now
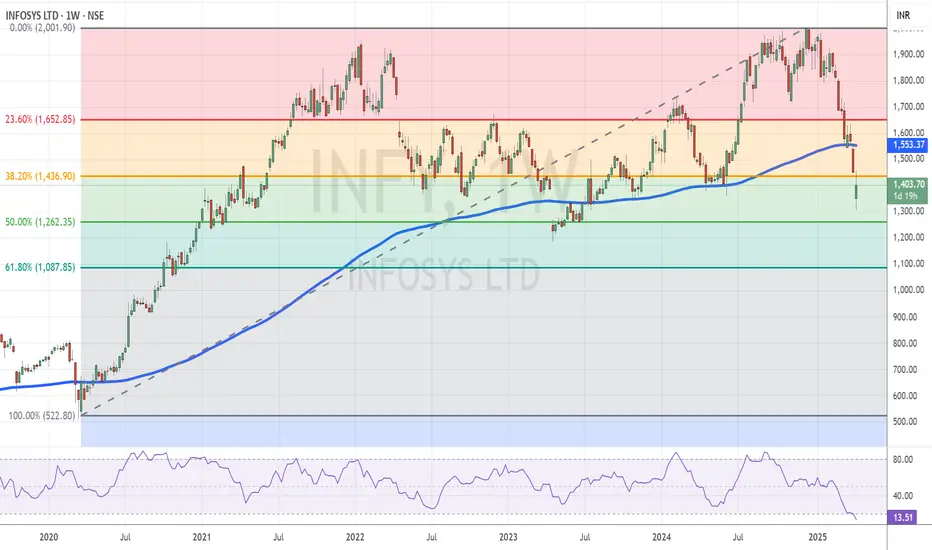
Infosys Turns Extremely Oversold After Deep CorrectionTopic Statement:
Infosys has witnessed a deep correction and is currently trading in an extremely oversold zone, indicating a possible pause or reversal in the downtrend.
Key Points:
- Price is attempting to hold above the 38.2% Fibonacci retracement level at ₹1436.
- Trading below the 180-day EMA signals an oversold condition.
- Weekly Money Flow Index (MFI) is at 13.5, highlighting that the stock is extremely oversold.
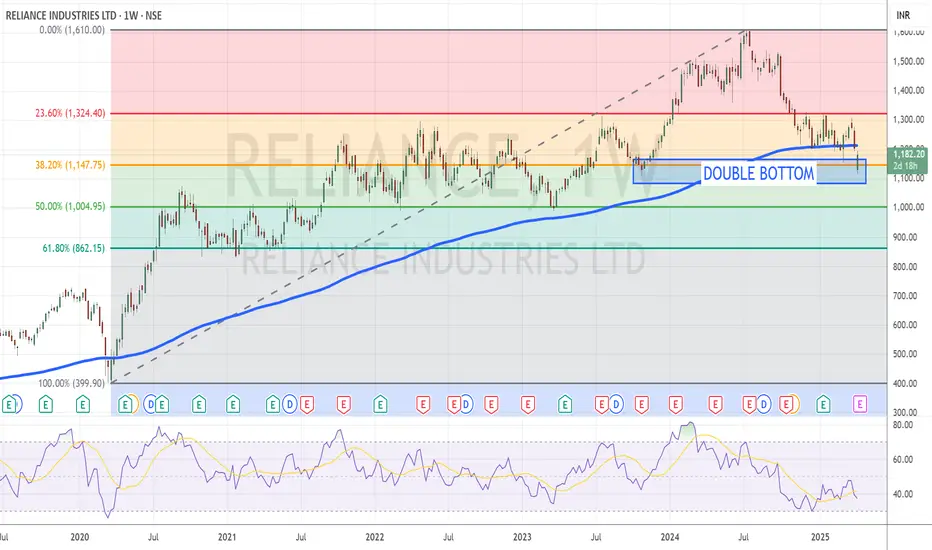
Reliance Eyes Reversal from Key SupportTopic Statement:
Reliance has undergone a healthy correction in line with the broader market and is showing signs of a potential reversal from key support levels.
Key Points:
- The stock is taking strong support at the 38.2% Fibonacci retracement level near ₹1147.
- Candlestick pattern indicates the formation of a potential double bottom.
- Price is trading below the 180-day EMA, suggesting an oversold condition.
- Weekly RSI stands at 37.5, further confirming the stock is in an oversold zone.
SBIN ready to accept your cheque soonStock Overview: State Bank of India (NSE: SBIN), current price: ₹768.60. SBI is India's largest public sector bank, providing a wide range of banking and financial services across individual and corporate sectors.
Key Levels:
Support: ₹719, ₹667
Upside Swing Zone: ₹734, ₹768
Possible Upside Levels: ₹872, ₹924, ₹991 and ₹1183
Technical Indicators:
RSI (Relative Strength Index): Current RSI is 49.97, reflecting neutral momentum with no signs of the stock being overbought or oversold.
Volume: Daily trading volume is robust at 27.83M, indicating consistent market participation.
Moving Averages (MA): The stock is trading above its short-term moving averages (e.g., 13-day MA), which suggests some bullish traction. However, it remains below longer-term MAs (e.g., 200-day MA), implying an overall mixed trend.
Sector and Market Context: SBI is a leader in the banking sector, which continues to show growth amidst increased credit demand and improved asset quality. The overall financial sector has benefited from resilient market conditions and positive economic recovery trends. Market sentiment aligns with stability in the banking domain, although global interest rate movements and inflation pressures remain influential factors.
Risk Considerations: Key risks include exposure to non-performing assets (NPAs), changes in monetary policy, or macroeconomic factors such as inflationary conditions and interest rate volatility. External events like geopolitical tensions or a global economic slowdown could also impact stock performance negatively.
Analysis Summary: State Bank of India exhibits stable technical patterns and benefits from its strong position within the banking sector. While upside levels indicate growth opportunities, potential risks should be carefully monitored to ensure balanced investment decisions.

XAU/USD 07-04 Key Hello traders, this is the XAUUSD 30m fib support zone. Based on the market trend and previous month action, candles taking support at the one month of fib retracement level 38.20(2958.16) indicate a short-term buy bias.
Trading ideas
Entry: 2958
Target: 2988
Stop loss: 2938
Risk Reward Ratio 1:2
Note; Intraday view only
Your likes and boosts motivate us to keep learning and sharing ideas!

Positional or Longterm Opportunity in ABBGo Long @ 5432.1 for Targets of 6510, 7015, 7520, and 8024.7 with SL 439.15
Reasons to go Long :
1. On a Weekly timeframe if we draw the Fibonacci retracement tool from the recent swing low (point A) to the recent swing high (point B) then we see stock took support from the 0.5 Fibonacci level.
2. Besides, a bullish candlestick pattern Bullish Engulfing (marked with orange) is formed around the 0.5 Fibonacci level.
3. In addition to this there is a strong demand zone (marked with purple) which earlier was acting like resistance but now is providing support to the stock.

HDFC LIFE swing tradetock Overview: HDFC Life Insurance Co Ltd, NSE, current price: ₹665.95. HDFC Life Insurance is a leading life insurance company in India, offering a range of individual and group insurance solutions including protection, pension, savings, investment, and health plans.
Key Levels:
Support levels: ₹651.90, ₹626.05, ₹606.80, ₹564.85.
Upside swing zone: ₹665.95.
Possible upside levels: ₹738.70, ₹780.65, ₹834.10, ₹988.50.
Technical Indicators:
RSI (Relative Strength Index) is currently at 53.36, indicating neutral momentum without being overbought or oversold.
Volume is at 3.86M, showing moderate trading activity.
Moving Averages (MA) are mixed, with the current price above the 50-period MA (₹649.27) and below the 200-period MA (₹609.41), suggesting a mixed trend.
Sector and Market Context: HDFC Life Insurance operates in the financial services sector, specifically in life insurance. The sector has shown resilience and growth potential, driven by increasing awareness and demand for insurance products. The overall market trend has been volatile, influenced by macroeconomic factors and regulatory changes.
Risk Considerations: Potential risks include regulatory changes, market volatility, economic downturns, and competitive pressures. Additionally, any adverse events affecting the financial services sector could impact the stock's performance.
Analysis Summary: HDFC Life Insurance Co Ltd shows a mixed technical outlook with neutral RSI and moderate volume. The stock is positioned above key support levels but faces resistance at higher levels. The sector's resilience and growth potential are positive factors, but market volatility and regulatory risks should be considered. Investors should evaluate the stock within the broader market context and their risk tolerance.

Trent Faces Deeper Correction RiskTopic Statement:
Trent has witnessed a major correction along with the broad market decline but still remains overbought indicating further downside risk.
Key points:
- Stock retraced to the 50% Fibonacci level and found support near ₹5000.
- Price is moving within a well-defined down-trending channel.
- Despite the correction, price is still significantly above the 180-day EMA, suggesting selling pressure may continue until valuation cools off.

IRCTCStock Overview: Indian Rail Tour Corp Ltd (IRCTC), traded on the NSE, current price: ₹738.00. IRCTC is a public sector company providing ticketing, catering, and tourism services for the Indian Railways.
Key Levels:
Support: ₹372.00, ₹565.95
Upside Swing Zone: ₹727.55, ₹832.95
Possible Upside Levels: ₹1,270.45, ₹1,464.35, ₹1,711.35, ₹2,424.70
Technical Indicators:
RSI (Relative Strength Index): Currently at 46.08, indicating neutral momentum as it is neither in overbought nor oversold territory.
Volume: A significant spike was observed during the initial uptrend, followed by stabilization at lower levels, suggesting reduced trading activity.
MA (Moving Average): The stock is trading near its 200-period SMA, which could act as a potential support level.
Sector and Market Context: IRCTC operates in the travel and tourism sector, which has been recovering post-pandemic. The stock's performance is closely tied to the sector's recovery pace and broader market trends, which currently show mixed performance across sectors.
Risk Considerations: Potential risks include changes in government policies, economic downturns, and disruptions in travel due to unforeseen events like pandemics. Market volatility and sector-specific challenges could also impact the stock's movement.
Analysis Summary: IRCTC presents a mixed technical picture with identified key levels and neutral momentum. While the RSI and moving averages provide insights into trend direction, sector performance and potential risks should be carefully considered before making investment decisions.

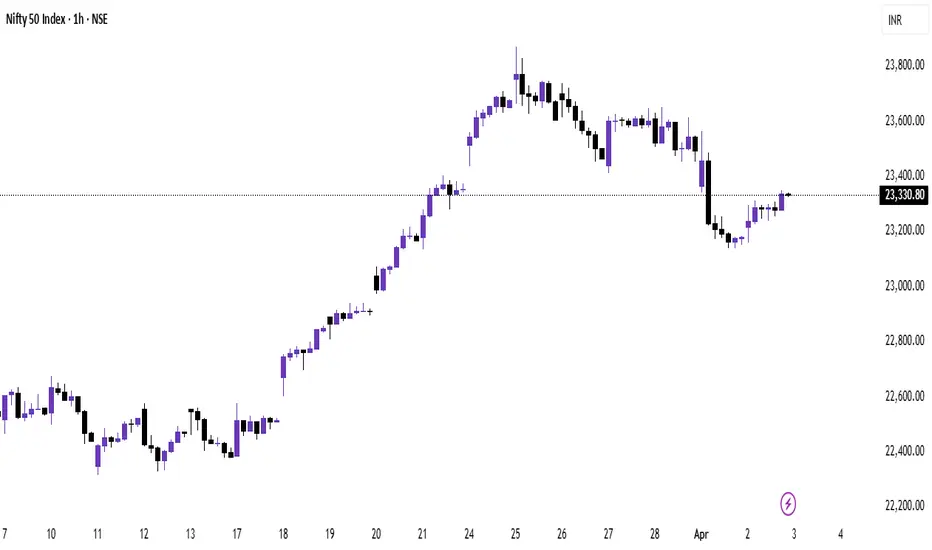
NIFTY 50 - ICT & SMC Analysis (April 3, 2025)1. Market Structure & Trend Overview
1D Chart (Higher Timeframe Bias)
Bearish Market Structure: The market has been in a downtrend, breaking market structure (MSS) at key levels. The recent rally from March was a retracement into a premium zone.
Key Resistance Areas:
Order Block (OB) at ~23,600: Market is rejecting this supply zone.
Previous Daily High (PDH) & Premium Liquidity Zone: Price recently swept liquidity above PDH and is rejecting.
Key Support Areas:
Fair Value Gap (FVG) at 22,800-22,900: This is the next area where price may drop to seek liquidity.
PDL (Previous Daily Low): A liquidity pool where price may react.
📌 Prediction:
If price stays below 23,600, the market may seek liquidity at 23,000 or even 22,800.
If price reclaims 23,600, a move towards 24,000 is possible.
4H Chart (Mid-Timeframe Confirmation)
Bearish Market Structure: Price is forming lower highs and recently had a Change of Character (ChoCH) to the downside.
Key Levels to Watch:
23,600 OB & FVG: Market is rejecting this area.
23,200-23,250 (Liquidity Area): Price is building liquidity below.
22,900 (FVG & Key Support): If price breaks down, this will be a magnet.
Strong Resistance at 23,600: If price gets here, it could be a sell opportunity.
📌 Prediction:
A potential short trade if price retraces back to 23,500-23,600 (OB) with targets at 23,200 & 22,900.
If 23,200 holds, a bounce to 23,500 is possible.
1H Chart (Execution Level)
Price Action Observations:
Liquidity Sweep at PDH: Market took out buy-side liquidity and is now retracing.
FVG Below 23,200: This is a draw on liquidity.
PWL (Previous Week’s Low) at 23,150-23,200: This could act as support before further downside.
📌 Trade Idea (Bearish Setup)
Entry: Sell near 23,500-23,600 (OB & FVG Zone).
Stop Loss: Above 23,650 (Above liquidity zone).
Take Profit Targets:
TP1: 23,200 (First liquidity pool).
TP2: 22,900 (FVG fill & support area).
🔹 Alternative Bullish Scenario: If price does not break 23,200 and forms bullish structure, a long towards 23,600 can be considered.
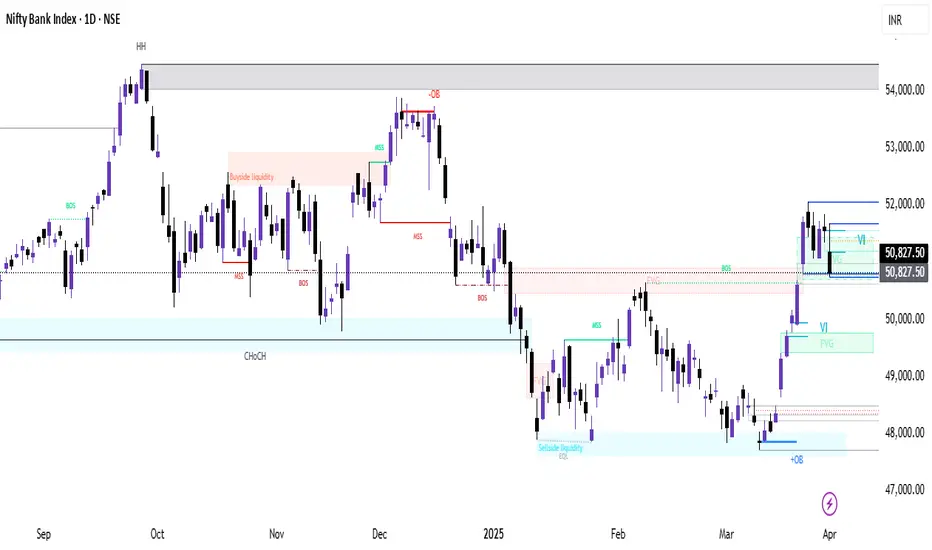
Nifty Bank Index (BANKNIFTY) Analysis & Trade Setup Timeframes & Context
We have three different timeframes: Daily (1D), 4-Hour (4H), and 1-Hour (1H).
1D gives us the macro view, showing key liquidity zones, order blocks (OBs), and break of structure (BOS).
4H refines our zones, helping to confirm areas of interest.
1H is the execution timeframe, where we define entry, stop-loss, and profit targets.
1️⃣ Higher Timeframe Bias - Daily Chart
📌 Key Observations:
A strong rejection from a higher timeframe supply zone near 52,000 - 52,400.
A liquidity grab (buy-side liquidity sweep) followed by a market structure shift (MSS) confirms bearish intent.
Break of Structure (BOS) indicates a downward trend continuation.
Fair Value Gaps (FVGs) suggest imbalance that the price may revisit before continuation.
📌 Bias: Bearish, expecting price to move lower.
📌 Key Levels:
Supply Zone (Resistance): 51,800 - 52,400
Demand Zone (Support): 48,000 - 49,000
Potential Target: 49,000 (near previous liquidity and OB)
2️⃣ Mid-Timeframe Confirmation - 4H Chart
📌 Key Observations:
A strong volume imbalance (VI) after the downward move.
Price has consolidated inside a 1H Fair Value Gap (FVG), signaling a possible retracement.
The previous low at 50,750 is being tested multiple times, suggesting liquidity is building.
📌 Bias: Bearish
Looking for a retracement to 51,200 - 51,400 (FVG area) before continuing downward.
Break below 50,750 confirms further selling.
📌 Key Levels:
Resistance: 51,200 - 51,400 (FVG + OB)
Support: 50,400 (short-term), 49,500 (major)
3️⃣ Entry Plan - 1H Execution Chart
📌 Trade Idea:
Wait for price to retest 51,200 - 51,400 (FVG zone).
If we see rejection (e.g., bearish engulfing candle or liquidity sweep), enter a short trade.
📌 Trade Parameters:
Entry: 51,200 - 51,400
Stop Loss: 51,600 (above OB)
Target 1 (T1): 50,400
Target 2 (T2): 49,500
Risk-Reward Ratio (RRR): ~1:3 or better
📌 Alternative Scenario:
If price breaks above 51,600, we invalidate the short setup.
In that case, we will reassess for a bullish continuation.
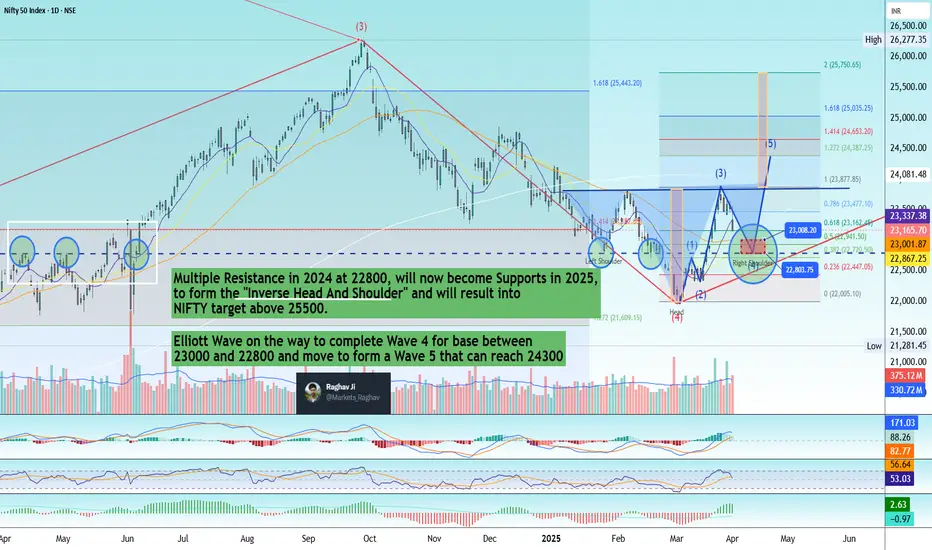
Shocked by Nifty50's sharp correction? Don't worry!Today NIFTY has crashed by 350+ points and reached 23165, a correction from 23800 levels .
Let me explain, This Nifty Daily chart is a classic example of how many fundamentals of Technical Analysis are satisfied.
1) Old resistances in 2024 at 22800 will now become Support levels
2) If it goes to 23000 and stops at 22800 levels it also fulfils the Wave 4 criteria, which says that Wave 4 never gets in Wave 1 territory
3) If this happens, the chart also completes an Inverse Head and Shoulder's Right Shoulder bottom to make an up-move towards the Neck.
4) if it crosses the Neck, the targets of Nifty will be above 25500, which will be 2500+points.
Technicals are beautiful only when you practice them.
NIFTY 50 SET UP - 1 Apr 251. Took support after
Gap down in 30m timeframe
& bullish move
2. REJECTION ,sell on rise-
Trapped Buyers at top &
PSY 23500 +fib +support breakdown

Waiting for bullish moveHere is the detailed analysis for a bullish trade setup on USD/JPY (4H timeframe):
Key Observations:
1. Resistance Zone (151.000-152.000)
- The price has rejected this level three times (as marked in red).
- This suggests strong resistance, and a breakout would indicate a strong bullish move.
2. Ascending Trendline Support
- The price has bounced off the trendline five times (marked in blue).
- However, a breakdown of this trendline could signal bearish movement.
3. Fibonacci Retracement (0.5 - 0.618 Level)
- The retracement zone aligns with a previous resistance level, now acting as support .
- This increases the probability of a bullish reversal.
4. Entry Confirmation Criteria:
- Wait for a strong green 4-hour candle with high volume near the 149.000 - 149.500 support area.
- If price respects the Fibonacci level and forms a bullish engulfing or strong pin bar, it confirms bullish momentum.
Trade Plan for Bullish Entry:
- Entry: Around 149.000 - 149.500 , once a bullish confirmation candle forms.
- Stop Loss (SL): Below 148.500 (below Fibonacci 0.618 level & previous structure).
- Take Profit (TP):
- TP1: 150.500 (near the trendline break level).
- TP2: 151.500 - 152.000 (major resistance zone).
Risk Management:
- Risk-reward ratio should be at least 1:2 .
- If price breaks below 148.500 , reconsider the bullish bias.
Conclusion:
- The setup favors a bullish trade only if a strong reversal candle appears at the Fibonacci & support zone.
- A breakout above 151.500 - 152.000 could trigger a bigger bullish rally.
Follow me for more ideas :)
