SENSEX Monthly EXP IntraSwing level Analysis for 29th JAN 2026SENSEX Monthly EXP IntraSwing level Analysis for 29th JAN 2026
⚠️82285 - 82325 Lo0kks Crucial⚠️
As SENSEX Last EXP. Before BUDGET, Market may more Choppy
Put OI: 17,93,824, Call OI: 18,39,826, PCR: 0.97. Data Shows: TAG of WAR
Intraday Put OI Chg: 8,00,027, Intraday Call OI Chg: 8,11,105, Intraday Change OI PCR: 0.99
Due to Delayed Data Chart will Updated 10-15 mins later.
Plot levels to Own Software / real time data provider's chart.
_____________^^^^^^^^^^^^^________________
💥Level Interpretation / description:
L#1: If the candle crossed & stays above the “Buy Gen”, it is treated / considered as Bullish bias.
L#2: Possibility / Probability of REVERSAL near RLB#1 & UBTgt
L#3: If the candle stays above “Sell Gen” but below “Buy Gen”, it is treated / considered as Sidewise. Aggressive Traders can take Long position near “Sell Gen” either retesting or crossed from Below & vice-versa i.e. can take Short position near “Buy Gen” either retesting or crossed downward from Above.
L#4: If the candle crossed & stays below the “Sell Gen”, it is treated / considered a Bearish bias.
L#5: Possibility / Probability of REVERSAL near RLS#1 & USTgt
HZB (Buy side) & HZS (Sell side) => Hurdle Zone,
*** Specialty of “HZB#1, HZB#2 HZS#1 & HZS#2” is Sidewise (behaviour in Nature)
Rest Plotted and Mentioned on Chart
Color code Used:
Green =. Positive bias.
Red =. Negative bias.
RED in Between Green means Trend Finder / Momentum Change
/ CYCLE Change and Vice Versa.
Notice One thing: HOW LEVELS are Working.
Use any Momentum Indicator / Oscillator or as you "USED to" to Take entry.
━━━━━━━━━━━━━━━━━━━━━━━━━━━━━━━━━━━━━━━━━━━
⚠️ DISCLAIMER:
The information, views, and ideas shared here are purely for educational and informational purposes only. They are not intended as investment advice or a recommendation to buy, sell, or hold any financial instruments. I am not a SEBI-registered financial adviser.
Trading and investing in the stock market involves risk, and you should do your own research and analysis. You are solely responsible for any decisions made based on this research.
"As HARD EARNED MONEY IS YOUR's, So DECISION SHOULD HAVE TO BE YOUR's".
━━━━━━━━━━━━━━━━━━━━━━━━━━━━━━━━━
❇️ Follow notification about periodical View
💥 Do Comment for Stock WEEKLY Level Analysis.🚀
📊 Do you agree with this view?
✈️ HIT THE PLANE ICON if this technical observation resonates with you. It will Motivate me.
━━━━━━━━━━━━━━━━━━━━━━━━━━━━━━━━━
💡 If You LOOKING any CHART & want for Level and ANALYZE?
Share your desired stock names in the comments below! I will try to analyze the chart Levels, patterns and share my technical view (so far my Knowledge).
If Viewers think It can identify meaningful setups. Looking forward to hearing from all of you — let's keep this discussion going and help each other make better trading decisions.
Fibonacci

NIFTY Analysis for 29th JAN 2026: IntraSwing Spot levelsNIFTY Analysis for 29th JAN 2026: IntraSwing Spot levels
For coming Days 25270 - 25316 Looks Crucial.
Todays Close above that Zone suggests Bull Power.
If Breaks Below 25270 & Sustain for 15 - 30 mins, Bears can take Advantage.
Due to SENSEX Last EXP before BUDGET, Volatility must have Crucial role.
CAUSIOUS TRADE ADVISABLE.
👇🏼Screenshot of NIFTY Spot All-day(27th Jan 2026) in 5 min TF.
🚀Follow GIFTNIFTY Post for NF levels
_________________:::__________________
💥Level Interpretation / description:
L#1: If the candle crossed & stays above the “Buy Gen”, it is treated / considered as Bullish bias.
L#2: Possibility / Probability of REVERSAL near RLB#1 & UBTgt
L#3: If the candle stays above “Sell Gen” but below “Buy Gen”, it is treated / considered as Sidewise. Aggressive Traders can take Long position near “Sell Gen” either retesting or crossed from Below & vice-versa i.e. can take Short position near “Buy Gen” either retesting or crossed downward from Above.
L#4: If the candle crossed & stays below the “Sell Gen”, it is treated / considered a Bearish bias.
L#5: Possibility / Probability of REVERSAL near RLS#1 & USTgt
HZB (Buy side) & HZS (Sell side) => Hurdle Zone,
*** Specialty of “HZB#1, HZB#2 HZS#1 & HZS#2” is Sidewise (behaviour in Nature)
Rest Plotted and Mentioned on Chart
Color code Used:
Green =. Positive bias.
Red =. Negative bias.
RED in Between Green means Trend Finder / Momentum Change
/ CYCLE Change and Vice Versa.
Notice One thing: HOW LEVELS are Working.
Use any Momentum Indicator / Oscillator or as you "USED to" to Take entry.
━━━━━━━━━━━━━━━━━━━━━━━━━━━━━━━━━━━━━━━━━━━
⚠️ DISCLAIMER:
The information, views, and ideas shared here are purely for educational and informational purposes only. They are not intended as investment advice or a recommendation to buy, sell, or hold any financial instruments. I am not a SEBI-registered financial adviser.
Trading and investing in the stock market involves risk, and you should do your own research and analysis. You are solely responsible for any decisions made based on this research.
"As HARD EARNED MONEY IS YOUR's, So DECISION SHOULD HAVE TO BE YOUR's".
━━━━━━━━━━━━━━━━━━━━━━━━━━━━━━━━━
❇️ Follow notification about periodical View
💥 Do Comment for Stock WEEKLY Level Analysis.🚀
📊 Do you agree with this view?
✈️ HIT THE PLANE ICON if this technical observation resonates with you. It will Motivate me.
━━━━━━━━━━━━━━━━━━━━━━━━━━━━━━━━━
💡 If You LOOKING any CHART & want for Level and ANALYZE?
Share your desired stock names in the comments below! I will try to analyze the chart Levels, patterns and share my technical view (so far my Knowledge).
If Viewers think It can identify meaningful setups. Looking forward to hearing from all of you — let's keep this discussion going and help each other make better trading decisions.

XAUUSD – Brian | M45 Technical Analysis— Buyers Still in Control Above 5,200
Gold continues to trade firmly above the 5,000 milestone, with price action confirming strong bullish acceptance at higher levels. On the M45 timeframe, the market remains in an expansion phase, supported by aggressive buying volume and well-defended value areas.
Current conditions suggest that buyers are still in control, with pullbacks being absorbed rather than sold into. This behavior typically characterizes a strong trending environment rather than a distribution phase.
Macro Context (Brief Overview)
From a fundamental perspective, institutional positioning remains stable, with no signs of defensive de-risking despite gold trading at record highs. At the same time, the market remains sensitive to upcoming macro events, which may introduce short-term volatility but have not altered the broader bullish bias so far.
As long as uncertainty persists and risk appetite fluctuates, gold continues to benefit from its role as a strategic hedge.
Market Structure & Volume Context (M45)
The current structure on M45 remains constructive:
Price is holding above the rising trendline.
Buying volume remains elevated, indicating strong demand and reduced willingness to sell.
Pullbacks continue to develop in a corrective manner rather than impulsive declines.
In strong trends, high volume combined with shallow retracements often signals continuation rather than exhaustion.
Key Technical Zones to Watch
Based on the chart structure and volume profile, several zones stand out:
Upside Reaction Zone
5,385: A major resistance and extension area where price may pause, consolidate, or react before deciding the next directional leg.
Primary Value Support
POC + VAH: 5,243 – 5,347
This is the most critical zone for continuation. Acceptance and holding within this range would reinforce the bullish structure.
Secondary Support
VAL: 5,163 – 5,168
A deeper pullback into this zone would still be considered corrective as long as price stabilizes and reclaims value.
Deeper Structural Support
POC: 5,086 – 5,091
This level represents broader value and would likely come into play only during heightened volatility.
Forward Expectations & Bias
Primary bias: Bullish continuation while price holds above value zones
Pullbacks are currently viewed as opportunities for re-accumulation rather than trend reversal.
Short-term volatility is expected, but structure remains the key reference point rather than individual candles.
Strong trends rarely move in straight lines. The ability of gold to hold value during pauses continues to support the case for further upside.
Refer to the accompanying chart for a detailed view of value areas, trend structure, and projected paths.
Follow the TradingView channel to get early structure updates and join the discussion on key market levels.

Gold at ATH before FOMC shakeout first or straight breakout?🧭 Macro Snapshot
Donald Trump maintains a hardline stance, increasing military presence in the Middle East → geopolitical risk remains elevated.
Tonight’s key focus: Federal Reserve
Political pressure and questions around Fed independence.
DXY continues to weaken, retesting major historical support (2020–2022) → supportive for gold.
👉 Conclusion: Geopolitics + a weaker USD set the bullish bias, while the Fed determines short-term volatility.
📊 Intraday Range to Watch
Upper range: 5,280 – 5,305
Lower range: 5,190 – 5,160
→ High probability of range trading and liquidity absorption ahead of the Fed decision.
🟢 Support
5,220–5,225 | 5,150–5,165 | 5,080–5,085 | 5,050–5,060
🔴 Resistance
5,280–5,294 | 5,300 | 5,315 | 5,380–5,385
⚠️ Strategy Notes
Expect possible fake moves / stop hunts within the range.
Avoid chasing highs or catching tops without confirmation.
Focus on price reaction at key levels and stay disciplined.
Summary: Gold is fundamentally supported, but today the key is how price reacts within 5,160–5,305.
Be patient — wait for confirmation — trade the reaction.

GIFTNIFTY IntraSwing Levels for 28th JAN 2026GIFTNIFTY IntraSwing Levels for 28th JAN 2026
🚀Follow & Compare NIFTY spot Post for Taking Trade
________________________________________________________
💥Level Interpretation / description:
L#1: If the candle crossed & stays above the “Buy Gen”, it is treated / considered as Bullish bias.
L#2: Possibility / Probability of REVERSAL near RLB#1 & UBTgt
L#3: If the candle stays above “Sell Gen” but below “Buy Gen”, it is treated / considered as Sidewise. Aggressive Traders can take Long position near “Sell Gen” either retesting or crossed from Below & vice-versa i.e. can take Short position near “Buy Gen” either retesting or crossed downward from Above.
L#4: If the candle crossed & stays below the “Sell Gen”, it is treated / considered a Bearish bias.
L#5: Possibility / Probability of REVERSAL near RLS#1 & USTgt
HZB (Buy side) & HZS (Sell side) => Hurdle Zone,
*** Specialty of “HZB#1, HZB#2 HZS#1 & HZS#2” is Sidewise (behaviour in Nature)
Rest Plotted and Mentioned on Chart
Color code Used:
Green =. Positive bias.
Red =. Negative bias.
RED in Between Green means Trend Finder / Momentum Change
/ CYCLE Change and Vice Versa.
Notice One thing: HOW LEVELS are Working.
Use any Momentum Indicator / Oscillator or as you "USED to" to Take entry.
⚠️ DISCLAIMER:
The information, views, and ideas shared here are purely for educational and informational purposes only. They are not intended as investment advice or a recommendation to buy, sell, or hold any financial instruments. I am not a SEBI-registered financial adviser.
Trading and investing in the stock market involves risk, and you should do your own research and analysis. You are solely responsible for any decisions made based on this research.
"As HARD EARNED MONEY IS YOUR's, So DECISION SHOULD HAVE TO BE YOUR's".
━━━━━━━━━━━━━━━━:===:━━━━━━━━━━━━━━━━━━
❇️ Follow notification about periodical View
💥 Do Comment for Stock WEEKLY Level Analysis.🚀
📊 Do you agree with this view?
✈️ HIT THE PLANE ICON if this technical observation resonates with you. It will Motivate me.
━━━━━━━━━━━━━━━━:===:━━━━━━━━━━━━━━━━━━
💡 If You LOOKING any CHART & want for Level and ANALYZE?
Share your desired stock names in the comments below! I will try to analyze the chart Levels, patterns and share my technical view (so far my Knowledge).
If Viewers think It can identify meaningful setups. Looking forward to hearing from all of you — let's keep this discussion going and help each other make better trading decisions.

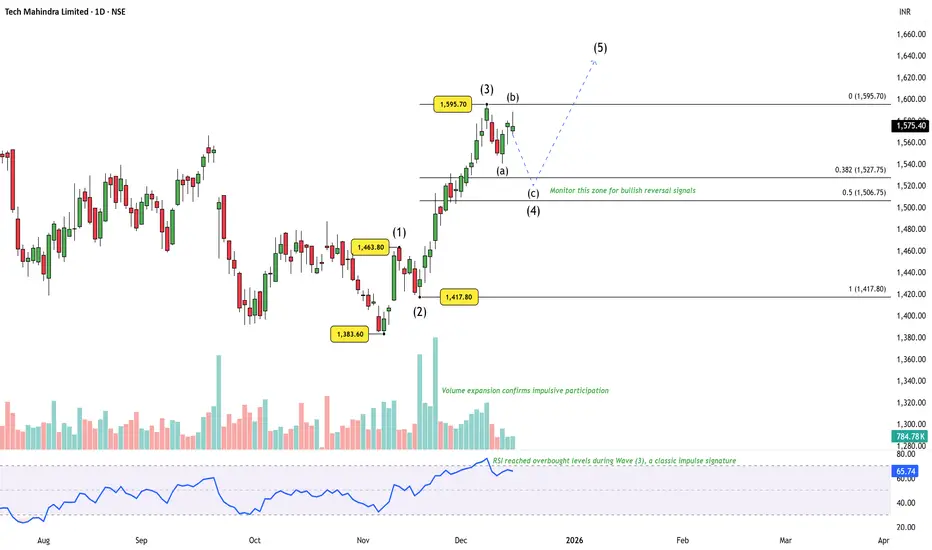
Tech Mahindra: Structure Still Favors One More Upside LegPrice action from the ₹1383.60 low has unfolded as a clean impulsive sequence, with Waves (1), (2), and a strong Wave (3) already in place. The advance was supported by clear volume expansion , validating the impulsive nature of the move. Momentum also peaked during Wave (3) , with RSI reaching overbought levels — a classic third-wave signature .
Following the Wave (3) high near ₹1595.70 , price has transitioned into a corrective phase. The decline is best interpreted as Wave (4) in progress , with only the (a),(b) legs formed so far. The structure continues to respect the typical Fibonacci retracement zone , keeping the broader bullish setup intact. A final (c) leg is still expected before Wave (4) can be considered complete.
Importantly, the higher-degree context does not materially alter the forward expectation . Whether the move from ₹1383.60 marks the start of a fresh impulsive advance , or represents the internal Wave C of a larger corrective pattern unfolding as a five-wave structure, the current setup continues to favor one more upside leg — Wave (5) .
That said, patience remains key . Focus remains on identifying a proper Wave (4) termination before anticipating continuation higher.
Disclaimer: This analysis is for educational purposes only and does not constitute investment advice. Please do your own research (DYOR) before making any trading decisions.
HDFCLIFE: Potential Stock for Feb EXP. & Positional LevelsHDFCLIFE: Potential Stock for Feb EXP. & also an Investment Idea
👇🏼 Comparative Study of some of leading Insurance compaanies.
👇🏼 Screenshot of HDFCLIFE Intraday Level for 28th Jan 2026
💥Level Interpretation / description:
L#1: If the candle crossed & stays above the “Buy Gen”, it is treated / considered as Bullish bias.
L#2: Possibility / Probability of REVERSAL near RLB#1 & UBTgt
L#3: If the candle stays above “Sell Gen” but below “Buy Gen”, it is treated / considered as Sidewise. Aggressive Traders can take Long position near “Sell Gen” either retesting or crossed from Below & vice-versa i.e. can take Short position near “Buy Gen” either retesting or crossed downward from Above.
L#4: If the candle crossed & stays below the “Sell Gen”, it is treated / considered a Bearish bias.
L#5: Possibility / Probability of REVERSAL near RLS#1 & USTgt
HZB (Buy side) & HZS (Sell side) => Hurdle Zone,
*** Specialty of “HZB#1, HZB#2 HZS#1 & HZS#2” is Sidewise (behaviour in Nature)
Rest Plotted and Mentioned on Chart
Color code Used:
Green =. Positive bias.
Red =. Negative bias.
RED in Between Green means Trend Finder / Momentum Change
/ CYCLE Change and Vice Versa.
Notice One thing: HOW LEVELS are Working.
Use any Momentum Indicator / Oscillator or as you "USED to" to Take entry.
━━━━━━━━━━━━━━━━━━━━━━━━━━━━━━━━━━━━━━━━━━━
⚠️ DISCLAIMER:
The information, views, and ideas shared here are purely for educational and informational purposes only. They are not intended as investment advice or a recommendation to buy, sell, or hold any financial instruments. I am not a SEBI-registered financial adviser.
Trading and investing in the stock market involves risk, and you should do your own research and analysis. You are solely responsible for any decisions made based on this research.
"As HARD EARNED MONEY IS YOUR's, So DECISION SHOULD HAVE TO BE YOUR's".
━━━━━━━━━━━━━━━━━━━━━━━━━━━━━━━━━
❇️ Follow notification about periodical View
💥 Do Comment for Stock WEEKLY Level Analysis.🚀
📊 Do you agree with this view?
✈️ HIT THE PLANE ICON if this technical observation resonates with you. It will Motivate me.
━━━━━━━━━━━━━━━━━━━━━━━━━━━━━━━━━
💡 If You LOOKING any CHART & want for Level and ANALYZE?
Share your desired stock names in the comments below! I will try to analyze the chart Levels, patterns and share my technical view (so far my Knowledge).
If Viewers think It can identify meaningful setups. Looking forward to hearing from all of you — let's keep this discussion going and help each other make better trading decisions.

DLF 15-Min: Impulse Attempt in PlayPrice action on the 15-minute chart shows early signs of an impulsive advance . Wave (i) and (ii) appear in place with a clearly defined invalidation at 604.55 . As long as this level holds, the structure favors a Wave-(iii) expansion toward the marked targets. A corrective Wave-(iv) pause may follow before one more leg higher completes the sequence, potentially forming a higher-degree Wave 1 .
Levels are marked. Structure will decide.
Disclaimer: This analysis is for educational purposes only and does not constitute investment advice. Please do your own research (DYOR) before making any trading decisions.

NIFTY Analysis for 28th JAN 2026: IntraSwing Spot levelsNIFTY Analysis for 28th JAN 2026: IntraSwing Spot levels
👇🏼Screenshot of NIFTY Spot All-day(27th Jan 2026) in 3 min TF
💥💥HARMONIC BEARISH BUTTERFLY in Progress.💥💥
🚀Follow GIFTNIFTY Post for NF levels
^^^^^^^_______^^^^^^^
💥Level Interpretation / description:
L#1: If the candle crossed & stays above the “Buy Gen”, it is treated / considered as Bullish bias.
L#2: Possibility / Probability of REVERSAL near RLB#1 & UBTgt
L#3: If the candle stays above “Sell Gen” but below “Buy Gen”, it is treated / considered as Sidewise. Aggressive Traders can take Long position near “Sell Gen” either retesting or crossed from Below & vice-versa i.e. can take Short position near “Buy Gen” either retesting or crossed downward from Above.
L#4: If the candle crossed & stays below the “Sell Gen”, it is treated / considered a Bearish bias.
L#5: Possibility / Probability of REVERSAL near RLS#1 & USTgt
HZB (Buy side) & HZS (Sell side) => Hurdle Zone,
*** Specialty of “HZB#1, HZB#2 HZS#1 & HZS#2” is Sidewise (behaviour in Nature)
Rest Plotted and Mentioned on Chart
Color code Used:
Green =. Positive bias.
Red =. Negative bias.
RED in Between Green means Trend Finder / Momentum Change
/ CYCLE Change and Vice Versa.
Notice One thing: HOW LEVELS are Working.
Use any Momentum Indicator / Oscillator or as you "USED to" to Take entry.
━━━━━━━━━━━━━━━━━━━━━━━━━━━━━━━━━━━━━━━━━━━
⚠️ DISCLAIMER:
The information, views, and ideas shared here are purely for educational and informational purposes only. They are not intended as investment advice or a recommendation to buy, sell, or hold any financial instruments. I am not a SEBI-registered financial adviser.
Trading and investing in the stock market involves risk, and you should do your own research and analysis. You are solely responsible for any decisions made based on this research.
"As HARD EARNED MONEY IS YOUR's, So DECISION SHOULD HAVE TO BE YOUR's".
━━━━━━━━━━━━━━━━━━━━━━━━━━━━━━━━━
❇️ Follow notification about periodical View
💥 Do Comment for Stock WEEKLY Level Analysis.🚀
📊 Do you agree with this view?
✈️ HIT THE PLANE ICON if this technical observation resonates with you. It will Motivate me.
━━━━━━━━━━━━━━━━━━━━━━━━━━━━━━━━━
💡 If You LOOKING any CHART & want for Level and ANALYZE?
Share your desired stock names in the comments below! I will try to analyze the chart Levels, patterns and share my technical view (so far my Knowledge).
If Viewers think It can identify meaningful setups. Looking forward to hearing from all of you — let's keep this discussion going and help each other make better trading decisions.

HDFCBANK Lead the Pre-Budget Rally - Lead Turnover Stock HDFCBANK Lead Turnover Stock Level analysis for 28th JAN 2026
Lead the Pre-Budget Rally.
👇🏼Screenshot: All-day (27th Jan 2026) in 5 min TF..
💥Level Interpretation / description:
L#1: If the candle crossed & stays above the “Buy Gen”, it is treated / considered as Bullish bias.
L#2: Possibility / Probability of REVERSAL near RLB#1 & UBTgt
L#3: If the candle stays above “Sell Gen” but below “Buy Gen”, it is treated / considered as Sidewise. Aggressive Traders can take Long position near “Sell Gen” either retesting or crossed from Below & vice-versa i.e. can take Short position near “Buy Gen” either retesting or crossed downward from Above.
L#4: If the candle crossed & stays below the “Sell Gen”, it is treated / considered a Bearish bias.
L#5: Possibility / Probability of REVERSAL near RLS#1 & USTgt
HZB (Buy side) & HZS (Sell side) => Hurdle Zone,
*** Specialty of “HZB#1, HZB#2 HZS#1 & HZS#2” is Sidewise (behaviour in Nature)
Rest Plotted and Mentioned on Chart
Color code Used:
Green =. Positive bias.
Red =. Negative bias.
RED in Between Green means Trend Finder / Momentum Change
/ CYCLE Change and Vice Versa.
Notice One thing: HOW LEVELS are Working.
Use any Momentum Indicator / Oscillator or as you "USED to" to Take entry.
━━━━━━━━━━━━━━━━━━━━━━━━━━━━━━━━━━━━━━━━━━━
⚠️ DISCLAIMER:
The information, views, and ideas shared here are purely for educational and informational purposes only. They are not intended as investment advice or a recommendation to buy, sell, or hold any financial instruments. I am not a SEBI-registered financial adviser.
Trading and investing in the stock market involves risk, and you should do your own research and analysis. You are solely responsible for any decisions made based on this research.
"As HARD EARNED MONEY IS YOUR's, So DECISION SHOULD HAVE TO BE YOUR's".
━━━━━━━━━━━━━━━━━━━━━━━━━━━━━━━━━
❇️ Follow notification about periodical View
💥 Do Comment for Stock WEEKLY Level Analysis.🚀
📊 Do you agree with this view?
✈️ HIT THE PLANE ICON if this technical observation resonates with you. It will Motivate me.
━━━━━━━━━━━━━━━━━━━━━━━━━━━━━━━━━
💡 If You LOOKING any CHART & want for Level and ANALYZE?
Share your desired stock names in the comments below! I will try to analyze the chart Levels, patterns and share my technical view (so far my Knowledge).
If Viewers think It can identify meaningful setups. Looking forward to hearing from all of you — let's keep this discussion going and help each other make better trading decisions.

GIFTNIFTY Feb 2026 Fut Roll-Over Levels For 27th JAN 2026GIFTNIFTY Feb 2026 Fut Roll-Over Levels For 27th JAN 2026
🚀Follow & Compare NIFTY spot Post for Taking Trade
===============================================
💥Level Interpretation / description:
L#1: If the candle crossed & stays above the “Buy Gen”, it is treated / considered as Bullish bias.
L#2: Possibility / Probability of REVERSAL near RLB#1 & UBTgt
L#3: If the candle stays above “Sell Gen” but below “Buy Gen”, it is treated / considered as Sidewise. Aggressive Traders can take Long position near “Sell Gen” either retesting or crossed from Below & vice-versa i.e. can take Short position near “Buy Gen” either retesting or crossed downward from Above.
L#4: If the candle crossed & stays below the “Sell Gen”, it is treated / considered a Bearish bias.
L#5: Possibility / Probability of REVERSAL near RLS#1 & USTgt
HZB (Buy side) & HZS (Sell side) => Hurdle Zone,
*** Specialty of “HZB#1, HZB#2 HZS#1 & HZS#2” is Sidewise (behaviour in Nature)
Rest Plotted and Mentioned on Chart
Color code Used:
Green =. Positive bias.
Red =. Negative bias.
RED in Between Green means Trend Finder / Momentum Change
/ CYCLE Change and Vice Versa.
Notice One thing: HOW LEVELS are Working.
Use any Momentum Indicator / Oscillator or as you "USED to" to Take entry.
━━━━━━━━━━━━━━━━━━━━━━━━━━━━━━━━━━━━━━━━━━━
⚠️ DISCLAIMER:
The information, views, and ideas shared here are purely for educational and informational purposes only. They are not intended as investment advice or a recommendation to buy, sell, or hold any financial instruments. I am not a SEBI-registered financial adviser.
Trading and investing in the stock market involves risk, and you should do your own research and analysis. You are solely responsible for any decisions made based on this research.
"As HARD EARNED MONEY IS YOUR's, So DECISION SHOULD HAVE TO BE YOUR's".
━━━━━━━━━━━━━━━━━━━━━━━━━━━━━━━━━
❇️ Follow notification about periodical View
💥 Do Comment for Stock WEEKLY Level Analysis.🚀
📊 Do you agree with this view?
✈️ HIT THE PLANE ICON if this technical observation resonates with you. It will Motivate me.
━━━━━━━━━━━━━━━━━━━━━━━━━━━━━━━━━
💡 If You LOOKING any CHART & want for Level and ANALYZE?
Share your desired stock names in the comments below! I will try to analyze the chart Levels, patterns and share my technical view (so far my Knowledge).
If Viewers think It can identify meaningful setups. Looking forward to hearing from all of you — let's keep this discussion going and help each other make better trading decisions.

BAJFINANCE: Nearing Reversal / Trend Finding Zone.BAJFINANCE Level Analysis: Intraswing for 27th+ JAN 2026
Aggressive traders can enter at this Level @ 925 - +28. Best Buy zone @ 915 - 921
__________&&&&&&_______
💥Level Interpretation / description:
L#1: If the candle crossed & stays above the “Buy Gen”, it is treated / considered as Bullish bias.
L#2: Possibility / Probability of REVERSAL near RLB#1 & UBTgt
L#3: If the candle stays above “Sell Gen” but below “Buy Gen”, it is treated / considered as Sidewise. Aggressive Traders can take Long position near “Sell Gen” either retesting or crossed from Below & vice-versa i.e. can take Short position near “Buy Gen” either retesting or crossed downward from Above.
L#4: If the candle crossed & stays below the “Sell Gen”, it is treated / considered a Bearish bias.
L#5: Possibility / Probability of REVERSAL near RLS#1 & USTgt
HZB (Buy side) & HZS (Sell side) => Hurdle Zone,
*** Specialty of “HZB#1, HZB#2 HZS#1 & HZS#2” is Sidewise (behaviour in Nature)
Rest Plotted and Mentioned on Chart
Color code Used:
Green =. Positive bias.
Red =. Negative bias.
RED in Between Green means Trend Finder / Momentum Change
/ CYCLE Change and Vice Versa.
Notice One thing: HOW LEVELS are Working.
Use any Momentum Indicator / Oscillator or as you "USED to" to Take entry.
━━━━━━━━━━━━━━━━━━━━━━━━━━━━━━━━━━━━━━━━━━━
⚠️ DISCLAIMER:
The information, views, and ideas shared here are purely for educational and informational purposes only. They are not intended as investment advice or a recommendation to buy, sell, or hold any financial instruments. I am not a SEBI-registered financial adviser.
Trading and investing in the stock market involves risk, and you should do your own research and analysis. You are solely responsible for any decisions made based on this research.
"As HARD EARNED MONEY IS YOUR's, So DECISION SHOULD HAVE TO BE YOUR's".
━━━━━━━━━━━━━━━━━━━━━━━━━━━━━━━━━
❇️ Follow notification about periodical View
💥 Do Comment for Stock WEEKLY Level Analysis.🚀
📊 Do you agree with this view?
✈️ HIT THE PLANE ICON if this technical observation resonates with you. It will Motivate me.
━━━━━━━━━━━━━━━━━━━━━━━━━━━━━━━━━
💡 If You LOOKING any CHART & want for Level and ANALYZE?
Share your desired stock names in the comments below! I will try to analyze the chart Levels, patterns and share my technical view (so far my Knowledge).
If Viewers think It can identify meaningful setups. Looking forward to hearing from all of you — let's keep this discussion going and help each other make better trading decisions.

XAUUSD – Brian | H3 Technical AnalysisGold has officially broken above the 5,000 level for the first time, confirming a major structural shift on higher timeframes. The breakout reinforces the broader bullish narrative, with price now trading firmly in expansion mode rather than consolidation.
The move above 5,000 reflects sustained safe-haven demand amid elevated global uncertainty. While short-term volatility remains possible, the broader environment continues to favour gold as a defensive asset, supporting upside continuation scenarios.
Market Structure & Trend Context (H3)
On the H3 timeframe, XAUUSD remains well-contained within a rising price channel, with structure defined by higher highs and higher lows. The recent impulsive leg confirms continuation within the dominant trend rather than a terminal move.
Key structural observations from the chart:
Price is holding above the ascending trendline, which has acted as dynamic support throughout the advance.
A clean impulsive push above 5,000 followed by shallow pullbacks suggests strong buyer acceptance at higher prices.
The broader Elliott structure remains constructive, with price progressing through higher-wave extensions rather than showing signs of distribution.
Key Technical Zones to Monitor
Several important technical areas stand out:
5,000 – trendline retest zone: A potential area for price to stabilise if a technical pullback develops.
Strong liquidity zone around 4,787: A deeper support area where buy-side liquidity is concentrated, aligned with prior structure.
FVG zone below current price: Represents unfinished business in case volatility increases.
Upper resistance / extension zone near 5,315 (Fibonacci 1.618): A key upside reaction area where price may pause or consolidate before further expansion.
As long as price remains above the trendline and key liquidity supports, the bullish structure remains intact.
Liquidity & Forward Outlook
The breakout above 5,000 opens a new liquidity regime. With limited historical resistance overhead, price is now driven more by liquidity expansion and momentum than by traditional supply zones.
Short-term pullbacks should be viewed in the context of trend continuation rather than reversal, unless there is a clear breakdown in structure. Acceptance above 5,000 would further strengthen the case for continued upside toward higher Fibonacci extensions.
Trading Bias
Primary bias: Bullish continuation while structure holds
Key areas of interest:
Trendline / 5,000 retest zone
4,787 liquidity support
5,315 extension resistance
Preferred timeframe for confirmation: H1–H4
Strong trends rarely move in a straight line. Patience and alignment with structure remain critical in this phase of the market.
Refer to the accompanying chart for a detailed view of trend structure, liquidity zones, and Fibonacci extensions.
Follow the TradingView channel to get early access to structural updates and join the discussion.

Nifty 50 Pre open Analysis 27-01-2026Expecting a Gap up of mearly 58-78 points from 25048. 24933 will act as support and 25250++ will act as resistance. The market theme is sell on rise with FII carrying forward puts for 3 day was a surprise. So expecting a pull back from a higher points.
Stay sharp stay focused.
Regards
Ajay Ekka.

HDFCBANK JAN 26 Exp. Level analysis for 27th JAN 2026 HDFCBANK JAN 26 Exp. Level analysis for 27th JAN 2026
💥Level Interpretation / description:
L#1: If the candle crossed & stays above the “Buy Gen”, it is treated / considered as Bullish bias.
L#2: Possibility / Probability of REVERSAL near RLB#1 & UBTgt
L#3: If the candle stays above “Sell Gen” but below “Buy Gen”, it is treated / considered as Sidewise. Aggressive Traders can take Long position near “Sell Gen” either retesting or crossed from Below & vice-versa i.e. can take Short position near “Buy Gen” either retesting or crossed downward from Above.
L#4: If the candle crossed & stays below the “Sell Gen”, it is treated / considered a Bearish bias.
L#5: Possibility / Probability of REVERSAL near RLS#1 & USTgt
HZB (Buy side) & HZS (Sell side) => Hurdle Zone,
*** Specialty of “HZB#1, HZB#2 HZS#1 & HZS#2” is Sidewise (behaviour in Nature)
Rest Plotted and Mentioned on Chart
Color code Used:
Green =. Positive bias.
Red =. Negative bias.
RED in Between Green means Trend Finder / Momentum Change
/ CYCLE Change and Vice Versa.
Notice One thing: HOW LEVELS are Working.
Use any Momentum Indicator / Oscillator or as you "USED to" to Take entry.
━━━━━━━━━━━━━━━━━━━━━━━━━━━━━━━━━━━━━━━━━━━
⚠️ DISCLAIMER:
The information, views, and ideas shared here are purely for educational and informational purposes only. They are not intended as investment advice or a recommendation to buy, sell, or hold any financial instruments. I am not a SEBI-registered financial adviser.
Trading and investing in the stock market involves risk, and you should do your own research and analysis. You are solely responsible for any decisions made based on this research.
"As HARD EARNED MONEY IS YOUR's, So DECISION SHOULD HAVE TO BE YOUR's".
━━━━━━━━━━━━━━━━━━━━━━━━━━━━━━━━━
❇️ Follow notification about periodical View
💥 Do Comment for Stock WEEKLY Level Analysis.🚀
📊 Do you agree with this view?
✈️ HIT THE PLANE ICON if this technical observation resonates with you. It will Motivate me.
━━━━━━━━━━━━━━━━━━━━━━━━━━━━━━━━━
💡 If You LOOKING any CHART & want for Level and ANALYZE?
Share your desired stock names in the comments below! I will try to analyze the chart Levels, patterns and share my technical view (so far my Knowledge).
If Viewers think It can identify meaningful setups. Looking forward to hearing from all of you — let's keep this discussion going and help each other make better trading decisions.

BANKNIFTY WEEKLY Exp. Level analysis for 27th JAN 2026BANKNIFTY WEEKLY Exp. Level analysis for 27th JAN 2026
^^^^^^^_______^^^^^^^_______
✅ Latest EU Trade Deal News (as of January 26-27, 2026)
🚨 Major Breaking Development : India-EU FTA Concluded
Biggest news: India and the European Union have successfully concluded negotiations on their long-awaited Free Trade Agreement (FTA) – often called the "Mother of All Trade Deals".
Key Updates:
Commerce Secretary Rajesh Agrawal confirmed: “The deal has been finalised.”
Formal announcement expected on February 27, 2026.
Legal scrubbing of the text is underway.
Formal signing to happen at an early date after legal review.
The agreement is expected to take effect from 2027.
What the Deal Covers
Tariff reductions on:
Textiles, garments, footwear, leather products
Automobiles, auto components, EVs
Wines, spirits, chocolates, dairy products
Marine products, gems & jewellery
Greater market access for Indian pharma, IT/ITES, and engineering goods
EU gains better access for automobiles, wines, dairy, and procurement markets
Progress on data protection, geographical indications (GI), and investment facilitation
Balanced and forward-looking agreement from India’s perspective
Strategic Context
Deal seen as India’s hedge against US tariffs under Trump 2.0 (especially on Russian oil imports).
Bilateral trade currently ~$136–140 billion (2024–25).
Expected to significantly boost Indian exports in labour-intensive sectors.
India-EU Summit
High-level summit likely on January 27, 2026 in New Delhi (Republic Day context).
EU Commission President Ursula von der Leyen and Trade Commissioner Maroš Šefčovič expected to attend.
Other Notable EU Trade Developments
EU-Mercosur FTA: Still facing delays due to opposition from France, Poland, and others over agriculture/environmental concerns. Legal challenges ongoing.
EU-Russia: Stepwise ban on Russian pipeline gas and LNG imports finalized.
No major new breakthroughs reported on EU-UK, EU-China, or EU-US trade deals recently.
^^^^^^^_______^^^^^^^_______
💥Level Interpretation / description:
L#1: If the candle crossed & stays above the “Buy Gen”, it is treated / considered as Bullish bias.
L#2: Possibility / Probability of REVERSAL near RLB#1 & UBTgt
L#3: If the candle stays above “Sell Gen” but below “Buy Gen”, it is treated / considered as Sidewise. Aggressive Traders can take Long position near “Sell Gen” either retesting or crossed from Below & vice-versa i.e. can take Short position near “Buy Gen” either retesting or crossed downward from Above.
L#4: If the candle crossed & stays below the “Sell Gen”, it is treated / considered a Bearish bias.
L#5: Possibility / Probability of REVERSAL near RLS#1 & USTgt
HZB (Buy side) & HZS (Sell side) => Hurdle Zone,
*** Specialty of “HZB#1, HZB#2 HZS#1 & HZS#2” is Sidewise (behaviour in Nature)
Rest Plotted and Mentioned on Chart
Color code Used:
Green =. Positive bias.
Red =. Negative bias.
RED in Between Green means Trend Finder / Momentum Change
/ CYCLE Change and Vice Versa.
Notice One thing: HOW LEVELS are Working.
Use any Momentum Indicator / Oscillator or as you "USED to" to Take entry.
━━━━━━━━━━━━━━━━━━━━━━━━━━━━━━━━━━━━━━━━━━━
⚠️ DISCLAIMER:
The information, views, and ideas shared here are purely for educational and informational purposes only. They are not intended as investment advice or a recommendation to buy, sell, or hold any financial instruments. I am not a SEBI-registered financial adviser.
Trading and investing in the stock market involves risk, and you should do your own research and analysis. You are solely responsible for any decisions made based on this research.
"As HARD EARNED MONEY IS YOUR's, So DECISION SHOULD HAVE TO BE YOUR's".
━━━━━━━━━━━━━━━━━━━━━━━━━━━━━━━━━
❇️ Follow notification about periodical View
💥 Do Comment for Stock WEEKLY Level Analysis.🚀
📊 Do you agree with this view?
✈️ HIT THE PLANE ICON if this technical observation resonates with you. It will Motivate me.
━━━━━━━━━━━━━━━━━━━━━━━━━━━━━━━━━
💡 If You LOOKING any CHART & want for Level and ANALYZE?
Share your desired stock names in the comments below! I will try to analyze the chart Levels, patterns and share my technical view (so far my Knowledge).
If Viewers think It can identify meaningful setups. Looking forward to hearing from all of you — let's keep this discussion going and help each other make better trading decisions.

Maruti Suzuki - A Solid OpportunityMaruti Suzuki has entered into short term bearish mode.
It is down nearly 7% from the top in last 2 weeks, confirming a strong downside momentum.
Structure: Playing Wave C, of 4 in short term.
Trend: Bearish
Also a clear divergence in RSI indicator at the top
Trade Setup: Short
Target: 15270/-
StopLoss: 16500/-
Notes
This is a classic Elliot wave pattern. Wave C generally moves fast.
⚠️ Disclaimer: Not financial advice. Manage risk properly.

Paytm - Is a Bearish Barrier Triangle Signaling a Deeper CorrectLooking at the 4H chart for One 97 Communications Ltd. (Paytm), Am seeing a classic consolidation pattern following a strong impulsive move. After completing what appears to be a 5-wave sequence (blue labels), the price action is now squeezing into a Barrier Triangle structure—a specific Elliott Wave pattern that often precedes a sharp "thrust" in the direction of the larger trend.
Wave B did an exactly 0.786 retracement.
Below 1260, its gonna be a straight fall to 1100 odd.
RSI already indicating a clear breakdown.

short trade📊 Market Read (NIFTY Futures – 5 min)
Strong bearish impulse earlier → confirms bearish market structure
Current price is pulling back slowly (weak bullish candles)
Price is below EMA ribbon / MAs → trend still down
This is a pullback → continuation setup, not a reversal
Bias: SELL (short) ✅
🔴 Best SELL Entry Zones (High Probability)
Primary Sell Zone (Preferred)
25,500 – 25,515
Reason:
Pullback into EMA ribbon
Previous minor support → now resistance
Liquidity resting above small equal highs
➡️ Wait for:
Bearish rejection candle
OR small bullish → strong bearish engulf
Aggressive Sell
25,490 – 25,495
Only if:
Weak pullback
Immediate bearish continuation
⚠️ Risky, reduce quantity
❌ Invalidation / Stop Loss
SL above 25,535
Clear break + close above EMA ribbon = bearish idea invalid
🎯 Targets (As marked on your chart)
TP 1
25,437
Partial booking (50–60%)
TP 2
25,411
Full exit / trail aggressively

Next week: Will gold listen to the Fed… or the White House?🔎 Context
Next week could be highly volatile as monetary policy and geopolitics converge.
Donald Trump signaled a potential 100% tariff on Canadian goods if Canada moves closer to trade deals with China—raising trade-war risks.
At the same time, military assets are being deployed en masse around Iran, heightening concerns that tensions could escalate.
👉 Safe-haven flows may return, with gold potentially opening the week gap-up and early buying.
🧠 Quick take
Primary trend: Bullish
At elevated prices: a short, sharp shakeout is possible to absorb liquidity
No top/bottom calls—watch price reactions at key zones
📌 Key levels to watch
🟢 Supports: 4920–4900 | 4890–4882 | 4850–4830 | 4660–4640
🔴 Observation resistances: 5006–5030–5090 | 5110–5115 | Current ATH
🎭 Weekly scenarios (reference only)
Early week: Gap-up / early push
Pre-FOMC: Chop & liquidity sweep
Then: Deep shakeout or base-building and continuation
👉 Distribution at the top—or just a pause before the next leg higher?

NIFTY Weekly Level Analysis: PRE- BUDGET from 27th-30th JAN 2026NIFTY Weekly Level Analysis: PRE- BUDGET from 27th-30th JAN 2026
🚀Follow & Compare NIFTY spot Daily Post for Taking Trade
👇🏼Screenshot of NIFTY Spot All-day(23rd Jan 2026) in 3 min TF.
🚀Follow GIFTNIFTY Post for NF levels
👇🏼Screenshot of GIFTNIFTY All-day(23rd Jan 2026) in 5 min TF..
💥Level Interpretation / description:
L#1: If the candle crossed & stays above the “Buy Gen”, it is treated / considered as Bullish bias.
L#2: Possibility / Probability of REVERSAL near RLB#1 & UBTgt
L#3: If the candle stays above “Sell Gen” but below “Buy Gen”, it is treated / considered as Sidewise. Aggressive Traders can take Long position near “Sell Gen” either retesting or crossed from Below & vice-versa i.e. can take Short position near “Buy Gen” either retesting or crossed downward from Above.
L#4: If the candle crossed & stays below the “Sell Gen”, it is treated / considered a Bearish bias.
L#5: Possibility / Probability of REVERSAL near RLS#1 & USTgt
HZB (Buy side) & HZS (Sell side) => Hurdle Zone,
*** Specialty of “HZB#1, HZB#2 HZS#1 & HZS#2” is Sidewise (behaviour in Nature)
Rest Plotted and Mentioned on Chart
Color code Used:
Green =. Positive bias.
Red =. Negative bias.
RED in Between Green means Trend Finder / Momentum Change
/ CYCLE Change and Vice Versa.
Notice One thing: HOW LEVELS are Working.
Use any Momentum Indicator / Oscillator or as you "USED to" to Take entry.
━━━━━━━━━━━━━━━━━━━━━━━━━━━━━━━━━━━━━━━━━━━
⚠️ DISCLAIMER:
The information, views, and ideas shared here are purely for educational and informational purposes only. They are not intended as investment advice or a recommendation to buy, sell, or hold any financial instruments. I am not a SEBI-registered financial adviser.
Trading and investing in the stock market involves risk, and you should do your own research and analysis. You are solely responsible for any decisions made based on this research.
"As HARD EARNED MONEY IS YOUR's, So DECISION SHOULD HAVE TO BE YOUR's".
━━━━━━━━━━━━━━━━━━━━━━━━━━━━━━━━━
❇️ Follow notification about periodical View
💥 Do Comment for Stock WEEKLY Level Analysis.🚀
📊 Do you agree with this view?
✈️ HIT THE PLANE ICON if this technical observation resonates with you. It will Motivate me.
━━━━━━━━━━━━━━━━━━━━━━━━━━━━━━━━━
💡 If You LOOKING any CHART & want for Level and ANALYZE?
Share your desired stock names in the comments below! I will try to analyze the chart Levels, patterns and share my technical view (so far my Knowledge).
If Viewers think It can identify meaningful setups. Looking forward to hearing from all of you — let's keep this discussion going and help each other make better trading decisions.

NIFTY Spot IntraSwing level Analysis for 27th JAN 2026Monthly Exp Day NIFTY Spot IntraSwing level Analysis for 27th JAN 2026
🚀Follow GIFTNIFTY EXP & Next Month Post for Roll-Over & NF levels
👇🏼Screenshot of NIFTY Spot All-day(23rd Jan 2026) in 3 min TF.
👇🏼Screenshot of GIFTNIFTY All-day(23rd Jan 2026) in 5 min TF.
━━━━━━━━━━━$$$$$$$$$$$━━━━━━━━━━━
💥Level Interpretation / description:
L#1: If the candle crossed & stays above the “Buy Gen”, it is treated / considered as Bullish bias.
L#2: Possibility / Probability of REVERSAL near RLB#1 & UBTgt
L#3: If the candle stays above “Sell Gen” but below “Buy Gen”, it is treated / considered as Sidewise. Aggressive Traders can take Long position near “Sell Gen” either retesting or crossed from Below & vice-versa i.e. can take Short position near “Buy Gen” either retesting or crossed downward from Above.
L#4: If the candle crossed & stays below the “Sell Gen”, it is treated / considered a Bearish bias.
L#5: Possibility / Probability of REVERSAL near RLS#1 & USTgt
HZB (Buy side) & HZS (Sell side) => Hurdle Zone,
*** Specialty of “HZB#1, HZB#2 HZS#1 & HZS#2” is Sidewise (behaviour in Nature)
Rest Plotted and Mentioned on Chart
Color code Used:
Green =. Positive bias.
Red =. Negative bias.
RED in Between Green means Trend Finder / Momentum Change
/ CYCLE Change and Vice Versa.
Notice One thing: HOW LEVELS are Working.
Use any Momentum Indicator / Oscillator or as you "USED to" to Take entry.
━━━━━━━━━━━━━━━━━━━━━━━━━━━━━━━━━━━━━━━━━━━
⚠️ DISCLAIMER:
The information, views, and ideas shared here are purely for educational and informational purposes only. They are not intended as investment advice or a recommendation to buy, sell, or hold any financial instruments. I am not a SEBI-registered financial adviser.
Trading and investing in the stock market involves risk, and you should do your own research and analysis. You are solely responsible for any decisions made based on this research.
"As HARD EARNED MONEY IS YOUR's, So DECISION SHOULD HAVE TO BE YOUR's".
━━━━━━━━━━━━━━━━━━━━━━━━━━━━━━━━━
❇️ Follow notification about periodical View
💥 Do Comment for Stock WEEKLY Level Analysis.🚀
📊 Do you agree with this view?
✈️ HIT THE PLANE ICON if this technical observation resonates with you. It will Motivate me.
━━━━━━━━━━━━━━━━━━━━━━━━━━━━━━━━━
💡 If You LOOKING any CHART & want for Level and ANALYZE?
Share your desired stock names in the comments below! I will try to analyze the chart Levels, patterns and share my technical view (so far my Knowledge).
If Viewers think It can identify meaningful setups. Looking forward to hearing from all of you — let's keep this discussion going and help each other make better trading decisions.

Dabur India Ltd: A Double Zigzag Within DistributionThe rally into the 577 high marked the completion of a mature advance, with momentum clearly fading near the top. Since then, price action has transitioned into a corrective phase.
The decline from 577 is unfolding as a higher-degree W–X–Y correction . Within this structure, the bounce from 479.15 has been overlapping and choppy, lacking impulsive strength. Structurally, this recovery is shaping into a double zigzag , reinforcing that the move is corrective.
This is a distribution phase, not accumulation.
The market is rotating out, not building fresh long exposure.
If this interpretation holds, the entire correction from 577 is expected to complete as a W–X–Y double zigzag , effectively forming a double zigzag within a higher-degree double zigzag — a structure typically seen during extended distribution phases.
From a Fibonacci perspective, the final leg of the correction is projected to terminate near the 0.786 retracement around the 464 zone , where price, structure, and retracement align. This zone becomes the most logical area for the correction to fully mature.
Until price shows clear impulsive behavior and breaks above key resistance, rallies should be treated as corrective bounces within distribution , not trend continuation.
Disclaimer: This analysis is for educational purposes only and does not constitute investment advice. Please do your own research (DYOR) before making any trading decisions.
