Political instability can gold rebound to the previous ATH?Political instability: Venezuela’s President Maduro arrested – Can gold rebound to the previous ATH?
1️⃣ Market Context
The overall structure remains bullish.
Price is undergoing a short-term correction after a strong volatile move.
The 4300 area is acting as a key support zone.
RSI shows buy–sell convergence; bulls are gradually absorbing bears, keeping downside pressure well controlled.
2️⃣ News & Fundamental Factors
Geopolitical tension: Venezuela attacked by the U.S., President arrested and transferred to the U.S.
Expectation of a gap and bullish move in gold in the upcoming session.
Current news flow continues to support a positive outlook for gold.
3️⃣ Main Scenario
Priority scenario: Price holds above 4300 and resumes the bullish structure.
Key intraday levels to watch:
Support: 4300–431X, 4270–4275
Resistance: 4370–4375, 4402–4404
Focus on shallow pullbacks in line with the main trend.
4️⃣ Trading Strategy (Intraday / Weekly)
Trend-following remains the core approach, while being prepared for minor pullbacks to avoid missing moves.
Closely monitor price reactions at:
4300: Nearest support, currently holding well.
437X: Potential intraday reaction zone.
Always wait for price action confirmation, avoid entries in the middle of the range.
5️⃣ Extensions & Notes
If 4300 breaks decisively:
Deeper correction toward 427X, 425X
Further extension to 417X, a zone worth watching for swing opportunities.
Volatility remains high → risk management is the top priority.
✨ Wishing everyone a profitable new week.
Fibonaccianalysis

Chumtrades XAUUSD Trading Plan NF todayMarket Psychology
Expect price to range sideways before a clear breakdown.
Market is waiting for NFP, smart money stays cautious → focus on range trading (4330–4280).
🔴 Resistance (Key Resistance)
4335 – 4340
4318 – 4322
Support (Key Support)
4260 → Short-term lower range
424X → Swing BUY zone
4204 → Deep pullback, strong swing BUY area
🎯 Trading Expectation
Before news:
Trade the range
Sell high – Buy low
Avoid FOMO in the middle
After news / Breakdown:
Look for deep BUY entries
Focus on 424X – 4204

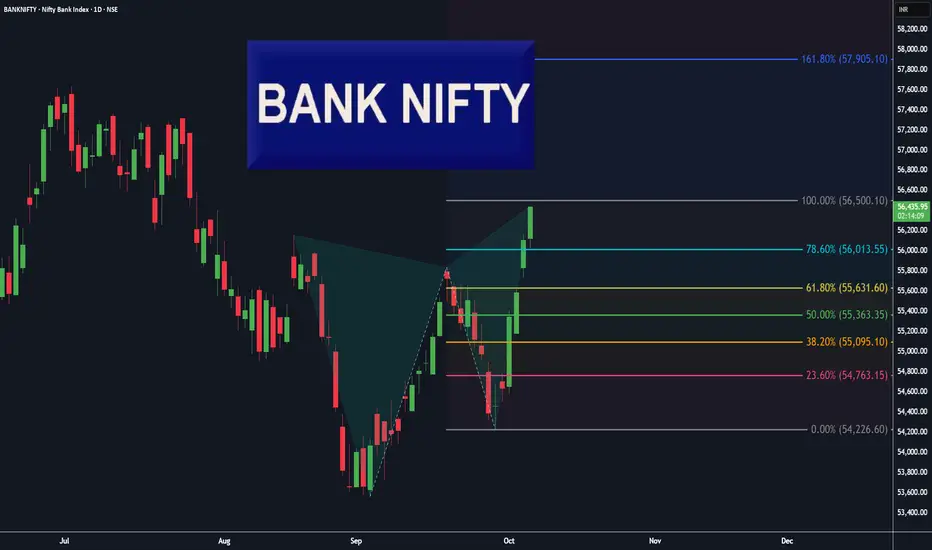
BankNifty Daily, Butterfly pattern completed!Beautiful Butterfly 🦋 pattern has completed on Daily chart of BankNifty.
Expect some profit booking or neutral trend in coming days up-to 55840 level.
Most near level is the re-test of 78.6% level ( 56013 ), for a new UP trend ( investors ).
" Buy 🟢 " above 56013 with the stop loss 🔻 of 55840, for the
🎯 Target 1: 56300
🎯 Target 2: 56500
🎯 Target 3: 57000
🎯 Target 4: open.
" Sell 🔴 " below 55631with the stop loss 🔺 of 55843, for the
🎯 Target 1: 55363
🎯 Target 2: 55095
🎯 Target 3: 54763
🎯 Target 4: open.
Smart Levels is Smart Trading. 👨🎓
⚠ RISK DISCLAIMER :
All content provided by "TradeWithKeshhav" is for information & educational purposes only.
It does not constitute any financial advice or a solicitation to buy or sell any securities of any type. All investments / trading involve risks. Past performance does not guarantee future results / returns.
Always do your own analysis before taking any trade.
Regards :
@TradeWithKeshhav & team
Happy Trading and Investing!
Nifty 50 Daily, Trend Based Fibonacci Extension (Natural levels)Hey Traders, I hope you all are doing well in your life.
Market is nature's response and Price is the God.
Let's check the market with the help of natural levels tool : Trend Based Fibonacci Extension .
After forming a ' W ' pattern on Daily chart, Nifty50 has given a pull-back ( base for Fib-Extension level tool, 24587 ).
Most near level is the re-test of 38.2% level ( 24980 ), for a new UP trend ( investors ).
" Buy 🟢 " above 25110 with the stop loss 🔻 of 24980, for the
🎯 Target 1: 25402
🎯 Target 2: 25650
🎯 Target 3: 26260
🎯 Target 4: 26500.
" Sell 🔴 " below 24960 with the stop loss 🔺 of 25110, for the
🎯 Target 1: 24880
🎯 Target 2: 24780
🎯 Target 3: 24680
🎯 Target 4: 24500.
Smart Levels is Smart Trading. 👨🎓
⚠ RISK DISCLAIMER :
All content provided by "TradeWithKeshhav" is for information & educational purposes only.
It does not constitute any financial advice or a solicitation to buy or sell any securities of any type. All investments / trading involve risks. Past performance does not guarantee future results / returns.
Always do your own analysis before taking any trade.
Regards :
@TradeWithKeshhav & team
Happy Trading and Investing!

XAUUSD – Gold Trading Plan: Fresh Record Highs & Fibo Zone React📊 Market Context
Gold regained strong bullish momentum on Monday, surging to a new record high above 3,720 USD/oz. The Fed’s dovish outlook, signaling the possibility of two additional rate cuts this year, continues to support non-yielding assets like gold. At the same time, geopolitical risks remain a tailwind for safe-haven demand.
🔢 Technical Analysis (H2)
Immediate Resistance / SELL Zones:
3,818.769 – Key reaction zone where sellers may defend aggressively.
3,754.890 – Secondary SELL zone reaction area for short-term pullbacks.
Mid-Level Support / BUY Zone:
3,694.521 – First key area to watch for dips and potential buy reactions.
3,660.130 – Stronger support level if price pulls back deeper.
Major BUY Zone Reaction:
3,583.663 – Critical confluence of structure and Fibonacci support, a potential bounce zone if a major correction unfolds.
📈 Suggested Trading Scenarios
1️⃣ Bullish Continuation Setup
BUY: Look for pullbacks to 3,694–3,660 with bullish candlestick confirmation.
Targets: 3,754 → 3,818, leave partial position open if momentum breaks higher.
Stop Loss: Below 3,645 for safer positioning.
2️⃣ Countertrend SELL Setup
SELL: Enter short at 3,754–3,818 zones only with strong rejection signals.
Targets: 3,694 → 3,660, trail stops aggressively to lock profits.
3️⃣ Deep Correction Opportunity
BUY: If price flushes to 3,583–3,585, consider scaling into longs.
Targets: 3,660 → 3,754, aligning with the broader uptrend.
⚠ Key Trading Notes
Expect increased volatility with Fed guidance and ongoing geopolitical risks.
Use smaller position sizes near resistance zones and employ stop-loss discipline.
Avoid mid-range entries; focus on well-defined zones for optimal risk-to-reward setups.
💬 Community Discussion
📊 Will gold sustain its rally toward 3,818 or see a deep pullback before another leg higher? Share your charts and insights below so we can compare strategies!

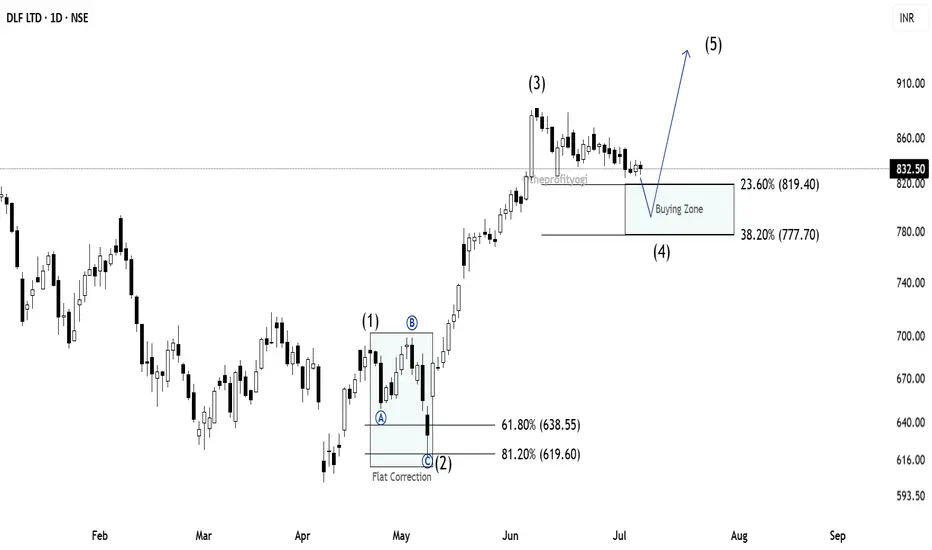
DLF: Elliott Wave AnalysisWe will soon get an excellent buying opportunity in DLF.
As we can see, I have marked DLF using Elliott Wave theory and Fibonacci.
You can see that, after forming wave (1), the market falls to form wave (2). In wave (2), we can see Flat Correction marked with ABC counting.
Price then moved fast, indicating a clear impulse to form wave (3).
Currently, we are in wave (4) in DLF.
As per the rule, we can expect wave (4) to terminate between 23.6% and 38.2%
This is the most probable zone where we can expect a new impulse, i.e., wave (5), to start.
One has to wait for the market to fall in this Buying zone to get a good buying opportunity.
This analysis is based on Elliott Wave theory and Fibonacci.
This analysis is for educational purposes only.
This is not a buying recommendation.
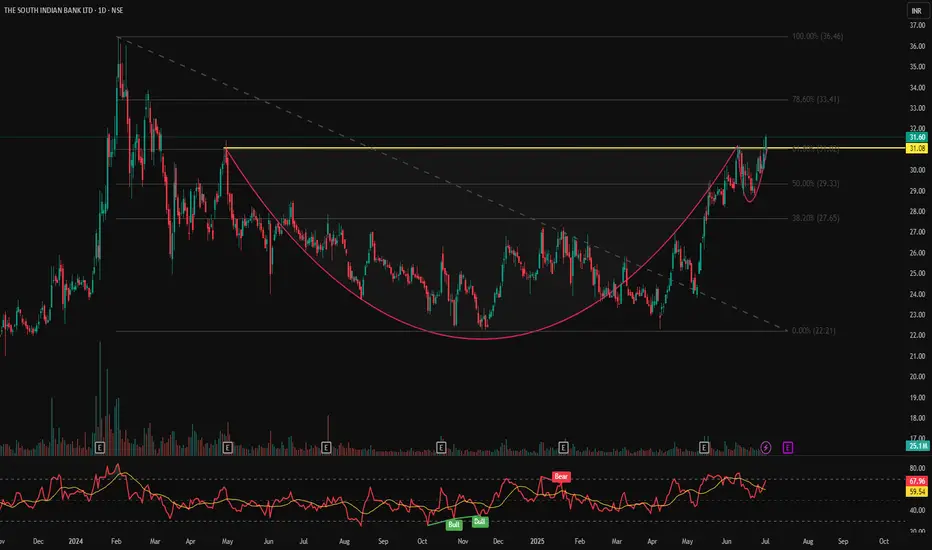
SOUTHBANK – Breakout From Cup & Handle | Daily Chart📊 SOUTHBANK – Breakout From Cup & Handle | RSI Bullish | High Volume | Fibonacci Levels | Daily Chart
📅 Chart Date: July 2, 2025
📍 CMP: ₹31.60 (+2.63%)
📈 Symbol: NSE:SOUTHBANK
🔍 Technical Breakdown
✅ Cup & Handle Breakout
A perfect cup & handle pattern breakout is visible
Price breaks out above the neckline at ₹31.08, which was a strong resistance zone
Breakout supported by rising volume (25.1M) adds conviction
📊 RSI Momentum
RSI (14) reading at 67.96 signals bullish strength, approaching overbought but not yet extreme
RSI crossover and previous bullish divergence helped initiate the move
📐 Fibonacci Retracement Levels (Swing: ₹22.21 to ₹36.46)
38.2% – ₹27.65
50.0% – ₹29.33
61.8% – ₹31.08 ✅ (Breakout zone)
78.6% – ₹33.41
100% – ₹36.46 🎯
🏁 Key Levels
Breakout Zone (Neckline): ₹31.08
CMP: ₹31.60
Resistance Levels: ₹33.41 → ₹36.46
Support Levels: ₹29.33 → ₹27.65
💡 Trade Idea
Entry: Above ₹31.10 on volume confirmation
SL: Below ₹29.30
Targets: ₹33.40 → ₹36.40+
Momentum + Breakout = High Conviction Setup
⚠️ Disclaimer
This analysis is for educational purposes only. Always do your own research and consult a registered advisor before investing.
CDSL: Moving as expected, what's next?As predicted, CDSL is in wave 4 now.
Wave 4 is Zig-zag correction in nature.
Currently, it looks like we are in wave C of zigzag.
The targets for this wave C are minimum 61.8% , next targets will be 100% at both these levels we have cluster of fib levels. At these levels wave 4 may complete.
It means, at these levels we can have buying opportunity for wave 5.
But buying is only if there is any bullish candlestick pattern is formed.
For educational purposes only.
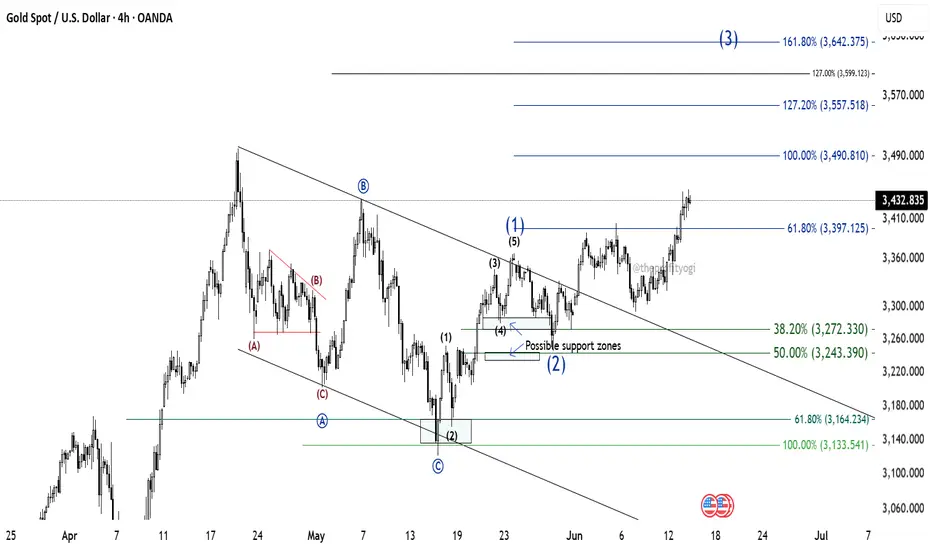
GOLD: Further levels using Elliott Wave TheoryWe successfully forecasted the path of gold in our post on May 12th.
Now, GOLD is looking like it's entering an impulse wave.
Wave (1) of this impulse was completed on 23rd May. The price then falls between the zone 38.2% and 50% to form wave (2). This was also predicted by us.
Currently, GOLD is in wave (3).
Now, to get the targets of wave (3), we have two possibilities.
1. Wave (3) goes to 100% and then reverses. This case is of the Terminal impulse. And the further path of GOLD can be predicted later.
2. Wave (3) goes to 161.8% (minimum). This is the case of Trending or normal impulse. And further path of GOLD can be predicted accordingly.
For now, GOLD is looking like going to touch at least the 100% (3490.81) level.
This analysis is based on Elliott Wave theory and Fibonacci.
This analysis is for educational purposes only.
This is not any buying recommendations.
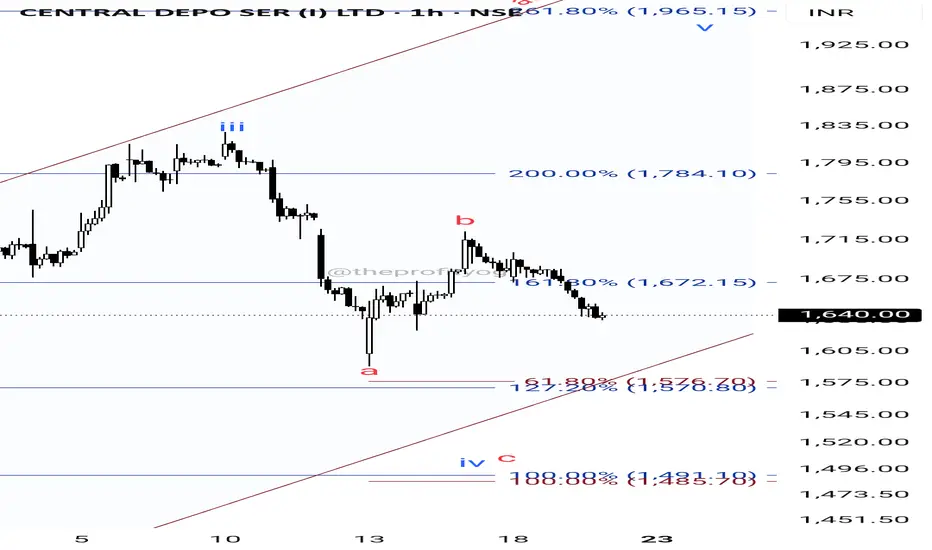
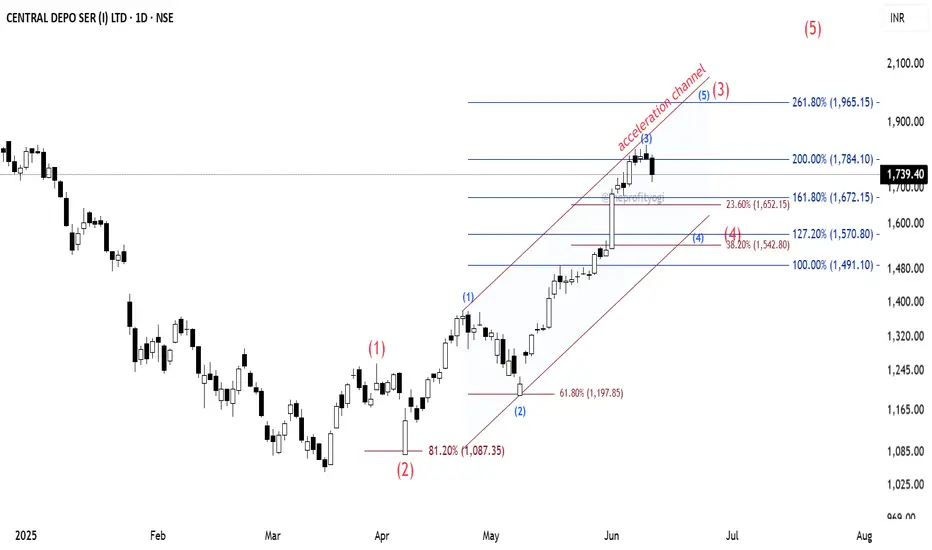
CDSL: Elliott Wave AnalysisThe CDSL daily chart indicates that the stock is in an impulse.
See the counting using Elliott Wave theory where the major wave (2) (shown in red) bounced from the 81.2% level to enter into wave (3).
The subordinate of wave (3) are shown in blue colour, where we can see the subordinate wave (2) of major wave (3) bounced from 61.8%.
To get the possible projection of the subordinate wave (3), I have applied Fibonacci extension to it, and we can see the price is at 200% extension currently. If the recent high is not broken up, we can presume that this is the top of wave (3).
Now, wave (4) will form. And for predicting wave (4) target that I have plotted the Acceleration Channel. This channel can be plotted by joining the line from the top of wave (1) to the top of wave (3) and then its parallel line from the bottom of wave (2).
This channel gives us a hint about where wave (4) may terminate.
Also, I have applied Fibonacci retracement from the bottom of wave (1) to the top of wave (3), and as we know that wave (4) may terminate between 23.6% and 38.2% levels.
So we can get some idea about where wave (4) may complete.
We can see there are clusters of Fib extension and retracement levels near these zones. So we may have a safe buying zone between those.
Important: Here, I have assumed that the subordinate wave (3) is completed.
If the price crosses above the recent top, then we have to replot and recount this study.
This analysis is based on Elliott Wave theory and Fibonacci.
This analysis is for educational purposes only.
This is not any buying recommendations.
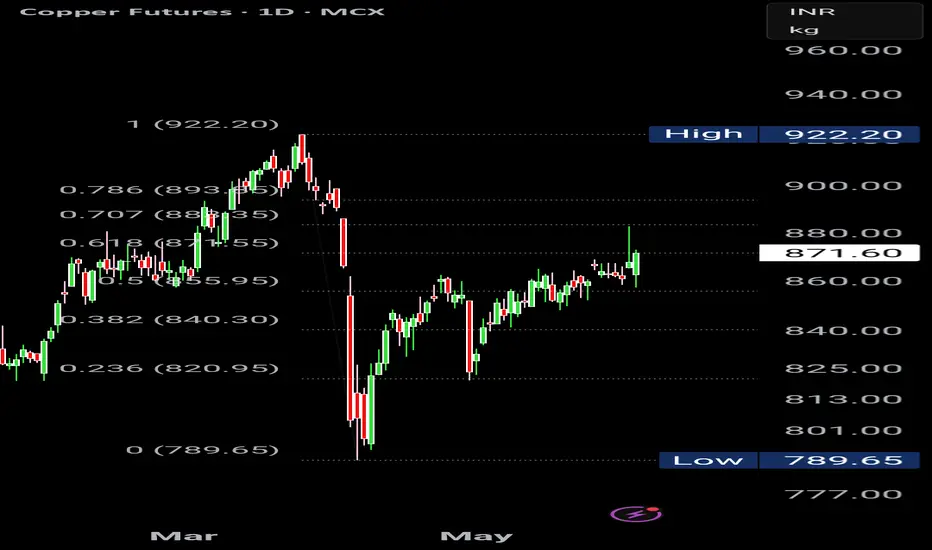
MCX COPPER CLOSES ABOVE 61.8 Fib Level. Today is an important GANN DATE for MCX COPPER. LETS SEE IF IT GOES INTO A BULLISH TRAJECTORY.
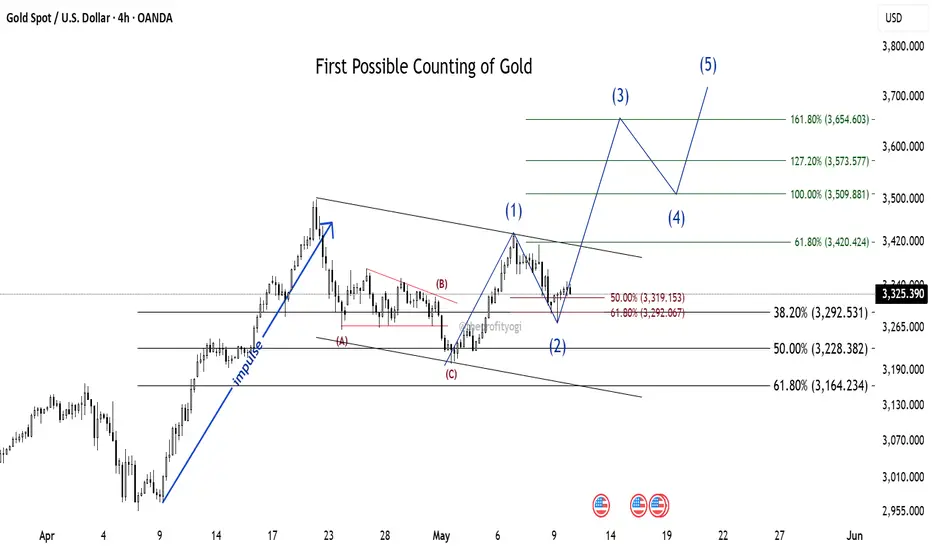
Possible Elliott Wave counting of GoldCounting 1:
After a clear impulse, the price formed a Zig-zag correction (marked in red ABC).
If the correction is completed near 50% (near 3228 level), then the recent upmove is a new impulse.
Of which wave 1 is completed, reaching a high of 3435. The market is currently in wave 2, and the next possible moves are marked as impulse counting (blue 12345).
This analysis is based on Elliott Wave theory and Fibonacci study.
This analysis is for educational purposes only.
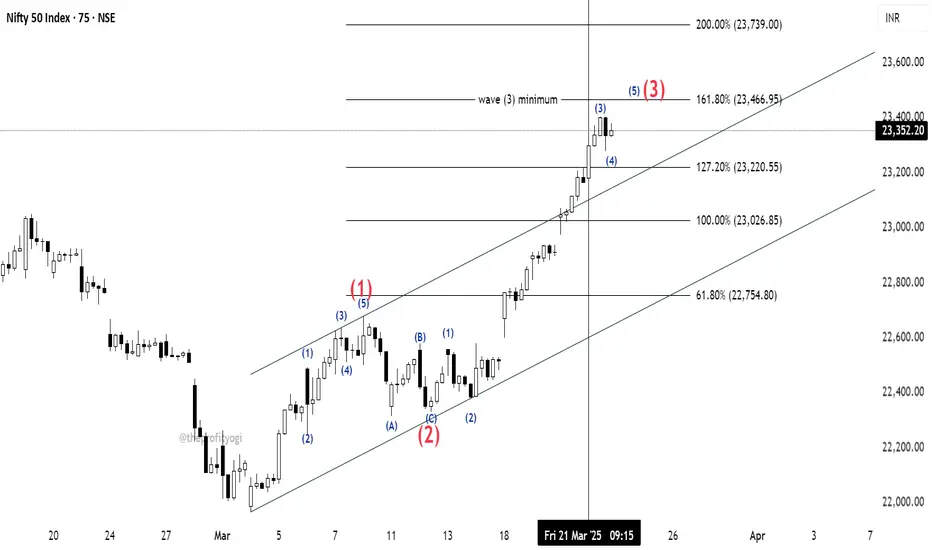
NIFTY detailed countingAs discussed in the last post, NIFTY's price has crossed over 23026.85 before 21st March so we can count the current move as wave (3). We can also see that price has broken the base channel, which is an important sign of wave (3) progression.
The detailed counting is given in the chart.
As we can see, the price is in subordinate wave 3 of the bigger wave (3).
The minimum target of Trending Impulse is 161.8% as per the rule.
We can expect the price to touch that level in the upcoming session.
I have marked, for now, a bigger wave (3) (in red) at 161.8% but as mentioned earlier, it is just the minimum target of it and the price may go beyond this level too.
This analysis is based on Elliott Wave theory and Fibonacci.
This is not any buying recommendation.
This analysis is for educational purposes only.
KALYAN JEWELLERS how much it can go up?Wave (c) of Elongated Flat Correction finished near 420 price level in KALYAN JEWELLERS.
It is observed that whenever there is Elongated Flat Correction (wave (c) will go beyond 161.8% extension), the price further tends to go in Double Correction.
Now, after every Flat Correction, price will go 61.8% retracement of entire move most of the times.
So we can assume here that KALYAN JEWELLERS will continue in uptrend upto 61.8% (near 652 level) and here it may form wave (X) of Double Correction. Price may then reverse again to form wave (Y).
This analysis is based on Elliott Wave theory and Fibonacci.
This not any buying or selling recommendations.
This analysis is for educational purposes only.

Buying in ITC for small targetThe ITC 75-minute chart forms a Terminal Impulse.
There is a good buying opportunity near the 440 and 445 price zone.
Strict stoploss below wave 2 which is below 432 level.
The target for wave 5 will be 470.
This analysis is based on Elliott Wave theory and Fibonacci.
Please always do your research before you take any action.
For educational purposes only.

TCS Buying Opportunity▎Analysis of TCS Stock using Elliott Wave Theory
Overview:
TCS (Tata Consultancy Services) has recently formed an Ending Diagonal pattern in the 75-minute timeframe, indicative of a terminal impulse wave. This pattern suggests that the stock may be nearing the end of its current trend, and a reversal could be imminent.
Elliott Wave Theory Context:
According to Elliott Wave Theory, an Ending Diagonal typically occurs in the final wave of a trend (Wave 5). This pattern is characterized by converging trendlines and can signify exhaustion in buying or selling pressure. Traders often look for a reversal after such formations, particularly when combined with Fibonacci retracement levels.
Fibonacci Retracement:
Following the completion of the Ending Diagonal, TCS has retraced approximately 61.8% of its previous upward move. The 61.8% Fibonacci retracement level is considered a significant area for potential support, where aggressive traders might start to accumulate positions in anticipation of a reversal.
For those who prefer a more conservative approach, waiting for the 81% retracement level could provide an additional margin of safety before entering a trade. This level often acts as a strong support zone and can offer better risk-reward ratios.
Entry Points:
• Aggressive Entry: Near the 61.8% Fibonacci retracement level.
• Conservative Entry: Around the 81% Fibonacci retracement level.
Stop Loss:
As indicated in the accompanying chart, it is crucial to place a stop loss just below the recent swing low or beneath the 81% retracement level. This helps to manage risk effectively should the market move against the anticipated direction.
▎Conclusion:
The current technical setup for TCS presents potential buying opportunities based on the Ending Diagonal formation and Fibonacci retracement levels. Traders should consider their risk tolerance and trading style when deciding on entry points and stop loss placements. As always, it is essential to conduct further analysis and confirm signals with additional indicators before making trading decisions.
Disclaimer: This analysis is for educational purposes only and should not be considered as financial advice. Always do your own research and consult with a financial advisor before making investment decisions.

When to buy BHARTIAIRTELIn BHARTI AIRTEL, a Diagonal (Terminal impulse) is finished and the price is falling.
After any Diagonal the next fall is always 61.8% or 81.2%.
So, if anyone is interested in buying this stock, they may start buying near these two levels: 1577.45 and 1544.05.
This analysis is based on Elliott wave theory and Fibonacci.
This is not any buying recommendation. Please always do your own research before you take any trade.
This analysis is for educational purposes only.

NIFTY downside targetsIf we count a single leg for NIFTY, (recent move), we can see Flat Correction.
Wave B is returning from the golden ratio of 61.8%
We will use the Fib extension to find the target of wave C. We can see that the minimum target of 61.8% has already been crossed. Price now moving for the Rule of equality i.e. 100%.
But we can see several Fib clusters near the price range of 23667.40 and 23621.35
So we can expect wave C up to these zones.
This analysis is done using Elliott Wave theory and Fibonacci.
This analysis is for educational purposes only.

Low risk buying in RELIANCEA low-risk high probability buying setup is forming in RELIANCE.
Price is taking support at the cluster of 38.2% retracement, 100% extension of Flat correction, and trendline in red.
If the price enters and sustains in the blue channel, showing bullish pressure, it will provide a good buying opportunity with a stop loss below the recent low.

Morning Star at several Fib clusters in HINDPETRO Wave C of Flat correction has fulfilled the rule of equality (Wave A and Wave C are equal).
There is also a Fib level of fib retracement of the previous impulse at this level.
We can also see the Morning Star pattern forming at this cluster.
This suggests a high probability of a buy trade in HINDPETRO .
Stop-loss for this trade can be put below 61.8%, i.e., around 360 level.
This analysis is for educational purposes only.

Adani Power - Perfect Fibonacci Trade SetupAdani Power Trade Setup
The fibonacci setup is giving a very good trade setup for this stock.
the MACD trend lines are about to move up showcasing the end of downward cycle and it's perfectly setting on the fibonacci setup.
Wait for a day or two for the movement in the upward direction and take an entry in the stock with a price target of 895.
the trade is having a ratio of 1:3.6

Unlock KNRCON’s : Riding the Bullish Breakout to New HighKNR Construction Ltd (KNRCON), a few key features can be observed:
Weekly High: Around 415
Weekly Low: Around 202.53
Current Price: Around 352.95
Breakout Structure (BOS): The stock seems to have experienced a breakout above resistance.
Here’s a potential trading strategy based on the current data:
1. Support and Resistance Levels:
Resistance Level: ~415 (near the weekly high) – if the stock moves towards this level, it could face selling pressure.
Support Level: ~308 (50% Fibonacci retracement) – this can act as a strong buy zone in case of a correction.
Long-term Support: ~202 (weekly low) – strong support level.
2. Entry Strategy:
Breakout Trading: Since the stock has broken out from a previous resistance (BOS), a good entry point would be around the current price (352.95), with a target near the next resistance level (415).
Pullback Entry: If the stock retraces, consider entering around the 50% retracement level (308) with a stop loss below the next support level (255).
3. Stop Loss:
For an aggressive trade, place the stop loss around 308.
For a more conservative approach, place the stop loss around 255 (75% Fibonacci retracement).
4. Target Levels:
First Target: ~388 (previous highs)
Second Target: ~415 (weekly high)
Long-Term Target: If momentum remains strong, potential breakout beyond 415 could lead to a higher upside.

Banknifty Analysis : 0.6 Fibonacci Retracement ReachedBanknifty Downtrend Breakout and reached 0.6 Fibonacci Retracement.
