Chumtrades XAUUSD Any pullback is an opportunity to buy higher.This morning’s move was a corrective sell-off, best understood as profit-taking from BUY-side, not a trend reversal.
The overall structure remains within a rising trend channel, with no sign of a structural break → BUY bias stays intact, looking to buy pullbacks in line with the trend.
🟢 Key Support Zones
447x: near-term support (4476 – 4472 – 4470)
4450 – 4455
4430 – 4435
🔴 Key Resistance Zones
4548 – 4550
4560 – 4565
4599 – 4600 (upper resistance)
📌 Additional Note
453x is a mid-zone to watch closely for price reaction.
📊 Intraday Expectation
Price is expected to range sideways on the H2 timeframe
Range high: 4549
Range low: 4473
→ Possible BUY near the lower boundary and SELL near the upper boundary if the range holds.
⚠️ Risk Management
No major news at the moment; price is mainly driven by technical flows.
Holiday period → thin liquidity, higher risk of stop hunts.
Keep stops reasonable and avoid overtrading.
Wishing everyone a productive trading day.
Fibonacci Extension

Chumtrades XAUUSD | ATH Is Not a Reason to ShortMacro bias:
US CPI cooled, while expectations for Fed easing in 2026 remain intact. Japanese bond yields surged, signaling capital rotation away from speculative assets and into safe havens like gold. The macro backdrop continues to support gold.
Structure:
Gold has broken above ATH, with the previous high around 438x now acting as support. Short-term high is forming near 4420. The uptrend remains dominant on H1 & M30.
Bias:
👉 Prefer BUYs in line with the trend
❌ Avoid FOMO chasing
⚠️ SELL only for short-term scalps after lower-timeframe structure breaks
BUY zones:
438x (previous ATH)
4350–4353
4336–4330
Invalidation:
A clear close below 4320 opens a move toward 4310 / 4300
In this case, the H1–M30 bullish structure is invalidated
Risk note:
Momentum is very steep → sudden pullbacks are possible. Manage risk tightly and focus on buying at key zones, not emotions.

XAUUSD – Weekly outlookXAUUSD – Weekly outlook: structure points towards 4,580 as long as bulls hold the line
Brian – Favouring buy-the-dip setups while price holds above 3,996
1. Market overview – triangle break and trend confirmation
On the daily chart, gold has finally broken out of the long consolidation triangle, with Friday’s candle closing cleanly above the descending trendline that has capped price for weeks.
For me, this breakout is the first proper confirmation that the primary bullish trend is resuming.
The next major resistance on the chart sits around 4,246 – a key level I’m watching as a trend-confirmation line.
If price can break and hold above 4,246, the path towards the higher zone around 4,580 opens up, in line with the Fibonacci extension drawn on the chart.
In short: the structure into next week is bullish, with pullbacks seen as opportunities to position for a potential move towards new highs.
2. Technical structure – from breakout to extension targets
The breakout from the triangle comes after a sequence of higher lows bouncing off the rising trendline, indicating accumulation rather than distribution.
Below price, we have demand zones clustered around the 4,110 trendline area and deeper supports near 4,040 and 3,920.
Above price, the roadmap is fairly clear:
First, a test of 4,246 (local resistance & former supply).
Then the ATH / prior high region around 4,360–4,380.
Finally, the Fibonacci 1.618 extension projects into the 4,560–4,580 zone, which is my medium-term upside objective if bulls can maintain control.
As long as daily structure keeps printing higher highs and higher lows and price stays above the key invalidation at 3,996, I will continue to treat gold as buy-on-dip rather than looking for major tops.
3. Key zones & trading ideas for next week
I’m not treating this as a signal service, but here’s how I’m mapping the chart for my own trading:
Primary idea – Buy the dip into trendline / support
Watch zone: around the rising trendline near 4,110.
If price pulls back into this area early in the week and shows a clear rejection on H4/D1 (wick rejections, bullish engulfing etc.), I’ll be interested in building long positions.
Upside path:
First objective: 4,246 – trend-confirmation resistance.
If broken and retested from above, the next leg could extend towards 4,360–4,380.
Extension target: 4,560–4,580 in line with the 1.618 Fibonacci projection.
Secondary idea – Using Fibonacci zones on break above 4,246
If gold breaks and holds above 4,246, the Fibonacci zones between roughly 4,360 and 4,580 become interesting for scaling in / managing positions:
Partial profits or tight trailing stops can be considered as we approach 4,360–4,380.
Any healthy corrective pullback from that region that respects the rising structure could still offer add-on entries with the 4,580 zone as a medium-term target.
Invalidation:
A daily close below 3,996 would seriously damage this bullish structure and force me to reassess. Below that, I would step aside and wait for a new pattern rather than trying to force the long idea.
4. Fundamental backdrop – why gold still has a bid
From a macro point of view, gold is navigating a mix of:
Tariff and trade tensions, which keep hedging demand alive as investors look for protection against policy shocks.
Ongoing geopolitical risks and conflict, supporting gold’s role as a classic safe-haven asset.
A late-cycle interest-rate environment, where markets are increasingly focused on when and how aggressively central banks will adjust policy after a period of elevated rates and liquidity distortions.
This combination tends to limit the downside for gold: even when we see corrections, dip-buyers are never too far away, especially when the technical structure is aligned with the macro story.
5. Strategy & risk management
Into next week, my bias is clear: structure is bullish above 3,996, so I prefer buying pullbacks rather than trying to short into strength.
The trendline around 4,110 is my first area of interest for fresh longs; anything closer to 4,040–4,000 (if we see a deeper flush) would be considered an even better price, provided the daily structure doesn’t break.
As always, position sizing and stop placement are key – one good weekly move is far more valuable than several emotional entries trying to catch every candle.
What do you reckon – does this breakout have enough fuel to take us towards 4,580, or do you see a deeper correction setting up first? Feel free to share your view in the comments.

MARUTI, DARVAS BOX BREAKOUTBUY MARUTI 13400 TILL 13100 for 13650/14200 in short term. Clear Darvas box breakout happening with volumes. Stock after multi year breakout above 10000 is now heading towards 18500 as medium term investment bet (Fibonacci extension levels)

ETH - 2 hour chart - Trend based Fibonacci Retracement Price took strong support from the green demand zone and bounced, starting a fresh upward move. This rally reached the Fibonacci 0.618–0.786 zone, where price faced resistance and started a pullback. During this pullback, a falling trendline formed, showing short-term selling pressure. Now price is moving between the 0.236 and 0.382 Fibonacci levels and is again testing the trendline from below. If price gives a clean breakout above this falling trendline and holds, it can continue its upward move toward higher Fibonacci levels. If the breakout fails, price may retest lower Fibonacci areas or even move back toward the support zone.
Entry: Buy on trendline breakout and retest around 3530–3550
Stop Loss: Below recent swing and Fibonacci 0.236 zone around 3450–3470
Targets:
• First target near 0.382 zone around 3600
• Second target near 0.5 zone around 3680
• Final target near 0.618–0.786 zone around 3750–3850
Disclaimer: This analysis is for educational purposes only and not financial advice. Always do your own research before trading or investing.

GOLD DIP ALERT! Sniping the $3,89x FIBO Floor Ahead of FOMC!FranCi$$_FiboMatrix Quick Insight (H1/M30 Focus)
Welcome Traders! Gold paused its sell-off near $4,065 as safe-haven demand returned pre-FOMC. Dovish Fed expectations are weakening the USD, setting the stage for a major rally. This is the final BUY ON DIPS setup!
🧠 INSIGHT & LOGIC
Fundamental Anchor: Weak US inflation and strong expectations for a Fed rate cut are the key drivers limiting downside. Long-term bias is Bullish.
Technical Focus: We are tracking the final deep correction to the $3,89x zone (Fibo 1.5 - 1.618 Extension). This is the ultimate technical floor for the ATH rally.
Action Plan: WAIT for the price to hit this extreme zone and confirm reversal (H1/M30).
🎯 KEY ACTION ZONES
🔥 CRITICAL BUY: $3,89x region ($3,881.435$).
Strategy: BUY on confirmation here.
TP TARGET 1: $4,037.647 (Immediate Resistance).
TP TARGET 2: $4,232.374 (Major Structural Resistance).
SL MANDATE: Place SL safely below the 1.618 Fibo zone.
Patience is key. Do NOT rush the entry! Is the $3,89x$ floor strong enough for the ATH rally? 👇

GOLD RECOVERS: H1 Bounces at $4,150 – Sniping the Fibo SELL Zone🎯 Macro Summary & Bias: Weak USD & CPI Focus Drive Recovery
Gold price gained some traction in early European trading on Wednesday, recovering above the $4,150 level.
Primary Driver: The weaker US Dollar (USD) is currently supporting the price recovery.
Mixed Forces: Easing US-China trade tensions are putting some pressure on Gold, but this is offset by Fed rate cut expectations and general market uncertainty, which should limit the downside.
Key Event: Traders are keenly focused on the US CPI (Consumer Price Index) inflation report for September this Friday. Any sign of hotter-than-expected US inflation could lift the USD and pressure Gold in the short term.
Technical Bias: After the DOUBLE TOP DUMP and a +3000 PIPS move down, the market is now attempting a corrective rally. Our strategy is to SELL the strong Fibo/Volume resistance (Sell on Rally) before looking for the next BUY zone.
📊 In-Depth Technical Analysis (H1): Pinpointing the FIBO Reaction Levels
Based on the recent major market reversal from the Double Top and the current corrective bounce (Referencing image_43ce7f.png), we have our strategic levels:
1. Strategic SELL Zones (FIBO SELL REACT ZONES):
These are the primary resistance zones for executing SELL trades, anticipating the continuation of the post-dump correction:
REACTION FIBO 0.5 ZONE - SELL ZONE 4190 - 4200: This is the first critical resistance zone (0.5 Fibo retracement) to look for a Short entry.
REACTION FIBO - SELL ZONE BIG VOLUME for SELL SIDE 4300 - 4310: This is the major supply/liquidity zone and the ultimate target for the current corrective rally.
2. Strategic BUY Zone (ORDER BUY REACT ZONE):
This is the key support area where the previous dump found temporary relief, which we use for stop-loss or potential re-entry:
ORDER BUY ZONE 4100 - 4090: This is the immediate support zone formed after the dump, which is currently holding the price.
📈 TODAY'S ACTION PLAN
Primary Action (Prioritize SELL on Rally): Wait for the corrective bounce to reach the REACTION FIBO 0.5 ZONE - SELL ZONE 4190 - 4200.
Short Entry: Execute the SELL entry upon confirmed reversal candles (H1/M30/M15) in the 4190 - 4200 zone.
Targets (TP): Aim to retest the recent low and the LIQUIDITY PUMP area.
Contingency BUY: If price breaks decisively above 4200, the rally may extend to the BIG VOLUME SELL ZONE 4300 - 4310.
⚠️ Risk Warning
Risk Management: Place Stop Loss (SL) above the 4200 zone for the short entry. Watch the US CPI report on Friday closely, as inflation data could cause extreme volatility.
Wishing all FranCi$$_FiboMatrix traders a disciplined and victorious day!

GOLD PULLBACK: $4330 SLIDE! Sniping the Fibo BUY Zone🎯 Macro Summary & Bias: USD Stability Triggers Profit-Taking
Gold is extending its corrective slide from the all-time high zone, hitting around $4,331 - $4,330.
Primary Headwind: The US Dollar (USD) attracted buyers for three consecutive days, causing stability which triggered profit-taking in the overbought Gold market.
Long-Term Support: DXY trades slightly negatively due to the US government shutdown and trade tensions, keeping the long-term bullish outlook intact.
Technical Bias: The market is in a deep correction/profit-taking phase. Our focus is strictly on finding the FIBO BUY REACT ZONES to join the underlying bullish trend. DO NOT CHASE THE SELL MOVE.
📊 In-Depth Technical Analysis (H1): Pinpointing the FIBO Reaction Levels
Based on the current corrective structure and the Fibo/Volume zones defined on image_ddd575.png, we have our strategic levels:
1. Strategic SELL Zones (FIBO SELL REACT ZONES):
These are current resistance areas for short-term rejection or supply zone testing:
REACTION FIBO SELL ZONE 4340 - 4320: Current resistance. Look for a SCALP SELL opportunity if the price rejects this zone.
REACTION SELL ZONE - Big Volume for Sell Side 435x: Major supply/liquidity zone if price attempts a deeper retracement.
2. Strategic BUY Zones (FIBO BUY REACT ZONE):
These are the most critical Fibo support zones for initiating Long entries:
REACTION FIBO BUY ZONE 4270 - 4265: The first crucial Fibo Retracement support.
REACTION BUY ZONE - Big Volume For Buy Side 4230 - 4220: The high-volume demand zone and optimal entry point for the major Long trade.
📈 TODAY'S ACTION PLAN
Primary Action (Prioritize BUY): Wait for the price to correct to the REACTION FIBO BUY ZONE 4270 - 4265 or 4230 - 4220.
Long Entry: Execute the BUY entry only upon confirmed reversal candles (H1/M30/M15).
Scalp SELL Action: If the price strongly rejects the 4340 - 4320 zone, a quick SCALP SELL targeting the nearest BUY ZONE can be considered.
Targets (TP): Aim for the highs and the 435x Sell Zone for the Longs.
⚠️ Risk Warning
Risk Management: Always place a safe Stop Loss (SL) below the nearest active BUY ZONE. DO NOT OVERLEVERAGE in this corrective phase.
Wishing all FranCi$$_FiboMatrix traders a disciplined and victorious day!

GOLD Accumulates Above $4200 Which Fibo React Zone Fires First ?🎯 Macro Summary & Bias: The Calm Before the Geopolitical Storm
Gold is trading above the psychological $4,200 mark but struggled to gain meaningful traction on Monday due to mixed forces.
Driving Forces: Increased geopolitical tensions and trade uncertainty act as tailwinds for the safe-haven asset.
USD Weakness: Expectations for more Fed rate cuts and the US government shutdown weaken the USD, providing support for XAU/USD. Traders have fully priced in two more rate cuts this year, which continues to pressure the US Dollar.
Technical Outlook: Gold is currently consolidating above $4,200, signaling that the bullish structure remains intact. We are now watching for confirmation at key Fibo levels before the next breakout.
📊 In-Depth Technical Analysis (H1): Pinpointing the FIBO Reaction Levels
Our core strategy is to BUY ON DIPS at the identified Fibo Reaction Zones and look for short-term Sells only as resistance tests (Referencing image_58f686.png).
1. Strategic BUY Zones (FIBO BUY REACT ZONE):
These are the crucial support zones for initiating Long entries:
Reaction Fibo Buy Zone 4230 - 422x. This is the immediate, primary support zone where we anticipate the first bounce.
Big Volume For The BUY Side 4205 - 4200. This is the major demand zone and the ultimate pullback point to catch the large growth wave.
2. Strategic SELL Zones (FIBO SELL REACT ZONES):
These are high-volume resistance areas for potential Take Profit (TP) or short-term Scalp Sells:
Reaction Fibo Sell Zone 4280 - 4285. The first key resistance level where the price may encounter selling pressure.
Reaction Fibo Sell Zone 4315 - 4320. The next significant resistance and TP level.
Big Volume For The Sell Side 4356 - 4360. The major supply and long-term TP target.
📈 TODAY'S ACTION PLAN
Primary Action (Prioritize CHỜ ĐỢI BUY): The market is consolidating. Do NOT FOMO. Patiently wait for the price to correct to the Reaction Fibo Buy Zone 4230 - 422x.
Long Entry: Upon confirmation (H1/M30/M15 reversal candles) at the BUY Zones, confidently activate the Long (BUY) entry.
Targets (TP): Aim for the successive SELL Zones: 428x, 431x, and the ultimate target at 4356 - 4360.
⚠️ Risk Warning
Risk Management: Always place a safe Stop Loss (SL) below the nearest active BUY ZONE. Monitor trade talks closely as they could trigger sharp volatility.
Wishing all FranCi$$_FiboMatrix traders a disciplined and victorious week!

Fibo BUY Zone Mandatory for Trend Continuation.🎯 Macro Summary & Bias: The Bulls Are Unstoppable!
Gold is the most sought-after asset as XAU/USD aims directly for the $4,300 mark and further.
Primary Catalyst: Financial markets remain cautious amidst the ongoing US government shutdown.
Driving Force: Widespread USD weakness—fueled by the funding battle in the US government—strengthens the bullish case for Gold.
Record Strength: XAU/USD is maintaining positive upward momentum despite extreme overbought conditions.
Technical Focus: In this continuous Bull market, FIBO is the paramount tool for identifying the critical pullback points to initiate BUY entries.
📊 In-Depth Technical Analysis (H1): Pinpointing the FIBO Reaction Levels
Our core strategy remains BUY ON DIPS at the most precise Fibo levels, leveraging the strong Parabolic structure.
1. Strategic BUY Zone (FIBO BUY REACT ZONE):
This is the most crucial Fibo support zone where we anticipate a high-probability pullback:
4,321.332 The REACTION FIBO BUY ZONE 0.5.
This is the most vital retracement point to catch the next growth wave.
2. Sell/Take-Profit Targets (FIBO SELL TARGETS):
These are the Fibo extension targets where the Longs are aiming:
TP Target 1 (Extension) 4,436.179 The REACTION FIBO SELL ZONE 1.5 - 1.618. The next immediate target for the rally.
TP Target 2 (Deep Extension) 4,538.394 The REACTION FIBO SELL ZONE 2.5 - 2.618. The long-term target if momentum remains unchecked.
📈 TODAY'S ACTION PLAN
Primary Action (Prioritize BUY): Patiently wait for the price to correct to the REACTION FIBO BUY ZONE 0.5 at 4,321.332.
Upon confirmation (H1/M30/M15 reversal candles), confidently activate the Long (BUY) entry.
Targets (TP): Aim for TP Target 1 (4,436.179) and further to TP Target 2 (4,538.394).
⚠️ Risk Warning
Risk Warning: Given the extreme overbought conditions, always place a safe Stop Loss (SL) below the Fibo BUY ZONE and maintain stringent risk management!
Wishing all FranCi$$_FiboMatrix traders a disciplined and victorious day!

GOLD: 419x FIBO! READY FOR 426x TARGET.Gold is surging near $4,210, backed by Fed rate cut expectations and ongoing trade tensions. The long-term structure is rock-solid Bullish. Our plan is simple: WAIT and BUY the intelligent pullback!
🎯 THE BUY REACT ZONES (H1)
We are prioritizing Longs and patiently waiting for the price to hit the exact FIBO RETRACE levels.
1. PRIME BUY ENTRY (The Sweet Spot):
Zone: 4194 - 4190 (Our key Fibo Retrace Buy Zone).
Action: Look for the price to correct here. Execute a BUY (Long) upon confirmed H1/M30 candle reversal signals.
2. DEEPER STRATEGIC BUY:
Zone: 4,145.676 (Our major Order BUY zone).
Zone 2: 4124 - 4120 (Fibo Extension Buy Zone).
Action: If the first zone fails, be ready to load up at these deeper accumulation points.
3. TAKE PROFIT TARGET:
Target: 4264 - 4268 (The Fibo Extension Sell Zone).
AD Note: Sells are only for quick scalps; we wait for the major Fibo reaction at 426x.
⚠️ Immediate Focus: WAIT for the 419x retest. Discipline is key to catching this trend continuation!

GOLD AT ATH! $4,200 BATTLE – Which Fibo Zone Fires First?Gold is fiercely battling the $4,200 mark after hitting a new All-Time High near $4,220. Bulls are pausing, but macro risks (geopolitics, trade war warnings) keep the trend Long. Our focus: Sniping the Reaction Zones.
🎯 THE FIBO ACTION ZONES (H1/M30)
1. STRATEGIC BUY ZONE (Optimal Long Entry):
Zone 1: 4162 - 4158 (The crucial Fibo Retest/0.618 support).
Zone 2: 4144 - 4140 (Deeper strong support).
Action: Wait for the pullback into 4162 - 4158 and execute a BUY upon bullish confirmation.
2. SELL/TP ZONES (Profit Taking & Resistance):
TP Target 1: 4208 - 4212 (Immediate Fibo Resistance).
TP Target 2: 4225 - 4250 (Fibo Extension 1.5 - 1.618).
Action: Look for SCALP SELL opportunities or take profits (TP) here if price rejects these levels.
📈 TODAY'S MOVE: Patience for the 416x retest. Join the Long trend aggressively only after a solid bounce confirmation!
⚠️ Risk Management: Keep SL tight below your chosen BUY Zone. Discipline over FOMO!

GOLD CRASH ALERT: +60 PRICES DUMP! Waiting for the Ultimate Fibo React BUY Zone.
FranCi$$_FiboMatrix Emergency Action Plan
Gold just suffered a brutal 60-point plunge from 416x to 411x, triggered by mounting geopolitical tensions. The market is volatile, and deep correction is highly likely. We must trade smart, not emotionally.
🎯 EMERGENCY ACTION ZONES (H1/M30)
Avoid chasing! We only trade when price hits our calculated FIBO REACTION ZONES.
1. SCALP SELL RETRACEMENT:
Zone 1 (High): Watch the 407x area (4,077.605).
Zone 2 (Key Fibo Resistance): The 405x area (4,048.493).
Action: If price bounces back into either zone, look for strong bearish rejection to execute a SCALP SELL.
2. CRITICAL BUY REACT ZONE (The Lifeline):
Zone: We are waiting for the AD's updated FIBO REACTION zones that conform to the new deep trend.
Action: DO NOT BUY BLINDLY. Only enter a Long when the price reaches these deeper support levels and gives a strong, confirmed BUY REACT signal.
⚠️ Immediate Focus: OBSERVE & WAIT. The AD will provide continuous updates. Manage risk strictly—this volatility demands discipline!

Sniping the Next BUY Zone for Maximum Gains.The sentiment is clear: Bulls are running the show, preparing for potentially an eighth consecutive weekly gain. Our strategy is simple—wait for the intelligent retest to join the momentum.
🎯 THE TARGET ZONES (M30/H1)
We're focusing on the two most crucial zones derived from Fibo React Logic:
1. PRIME BUY ENTRY (The Sweet Spot):
Zone: 4018 - 4014 (Our key Fibo Retest Zone).
Action: Wait for Gold to pull back to this area. Execute a BUY (Long) only upon confirmed M30/H1 candle rejection (e.g., Bullish Engulfing/Pin Bar).
2. TAKE PROFIT TARGET (The Next Peak):
Zone: 4094 - 4098 (Fibo Extension/SELL React Zone).
Action: This is the primary TP for our Long entries, representing the next major target for the buyers.
📈 TRADING SCENARIO
Strategy: Patience is key. Let the market retrace to 4018 - 4014. Once confirmation hits, ride the wave up to 4094 - 4098.
🚨 Risk Alert:
Be disciplined with your Stop Loss. Maintain strict risk management, especially if the price fails to hold the 4018 - 4014 zone.
Let's trade with precision today!

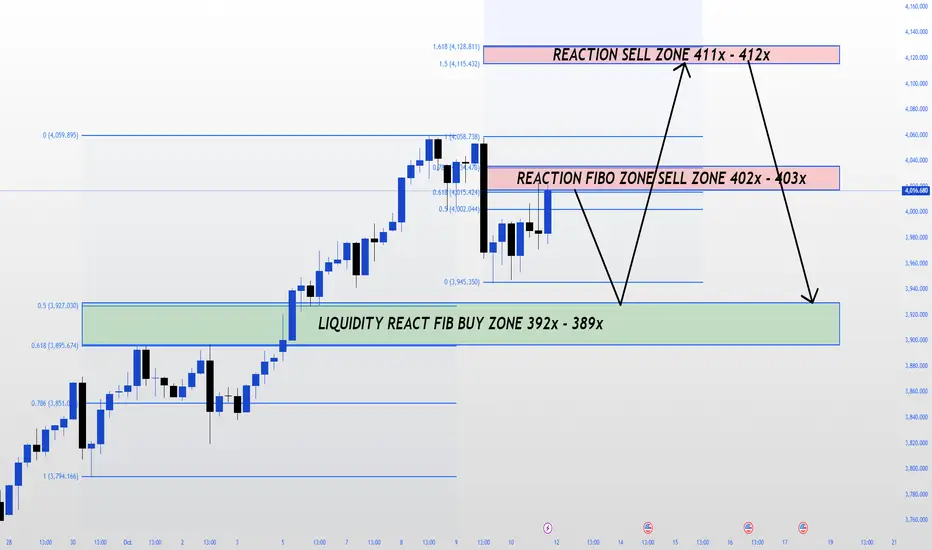
$4,000 RECLAIMED! Targeting Fibo Extremes on H4.The big picture is clear: Gold has strongly pushed past the $4,000 mark, driven by major safe-haven demand amidst US-China tensions. Buyers are pushing for an eighth straight weekly gain!
But where are the high-probability zones?
🔑 THE FRANCI$$_FIBOMATRIX PLAN (H4)
We're keying in on two critical Fibo Reaction Zones for the perfect entry:
1. SELL ZONE (Correction/Reversal Focus):
Zone 1 (FIBO): 402x - 403x (4,025.424 - 4,032.844). Action: Look for H1/H4 candle rejection here to initiate a corrective short trade.
Zone 2 (Extension): 411x - 412x (4,115.422 - 4,128.811). Action: The ultimate target if momentum holds; watch this for the major supply zone.
2. BUY ZONE (Trend Continuation):
The Sweet Spot: 392x - 389x (3,907.030 - 3,895.674). This is our key Liquidity React Fibo Buy Zone. Action: Wait for the deep pullback here, confirm with bullish signals, and join the main trend with a target back to the 402x/411x range.
🚨 Critical Risk Alert:
A decisive weekly close below $3,962 signals a high risk of deep correction towards $3,900. Manage your Longs tightly below this level!
GOLD UPDATE – Bulls Defend $4,000 Ahead of Powell’s SpeechGold continues to hold firm above the key $4,000 psychological level, even after a sharp correction from the all-time high near $4,059. The market’s focus now shifts to Fed Chair Jerome Powell’s speech, which could set the tone for the next directional move.
Despite the recent dip, the overall structure remains bullish, and the FiboMatrix setup still signals that buyers are not out of the game yet.
Technical Structure (H1 – FiboMatrix View)
Support Zone (BUY Setup):
4010 – 4012 → Retest of breakout trendline + Fibo 0.618 reaction zone.
Strong intraday base where liquidity may reload for another bullish leg.
Reaction Buy Zone:
402x → Potential confirmation area if price reacts positively.
Resistance Zone (ATH):
4060 → Previous intraday top, acting as the first major barrier before retesting 408x.
SELL Reaction Zone:
4084 – 4086 → Fibo 1.5 – 1.618 expansion zone, potential scalp short zone with tight stop above 4090.
🎯 Trading Plan (Francis Strategy)
✅ BUY Setup:
Entry: 4010 – 402x (wait for confirmation).
TP1: 4060
TP2: 4084
SL: Below 3996
⚠️ SELL Setup (Short-term scalp):
Entry: 4084 – 4086 (if rejection forms).
Target: 4040 → 4020
SL: Above 4096
🔑 Francis Outlook
Gold’s short-term correction looks more like a controlled retracement than a trend reversal.
As long as the price holds above the $4,000 handle, the bullish bias stays intact.
👉 Expect potential consolidation before Powell’s remarks, followed by a sharp reaction depending on the tone of his speech.
A clean breakout above 4060 – 4086 will open the path toward $4,100+ and new ATH targets.
🚀 Trend Bias: Bullish above 4010 – Buy the Dip, Sell only at Fibo extremes with confirmation.

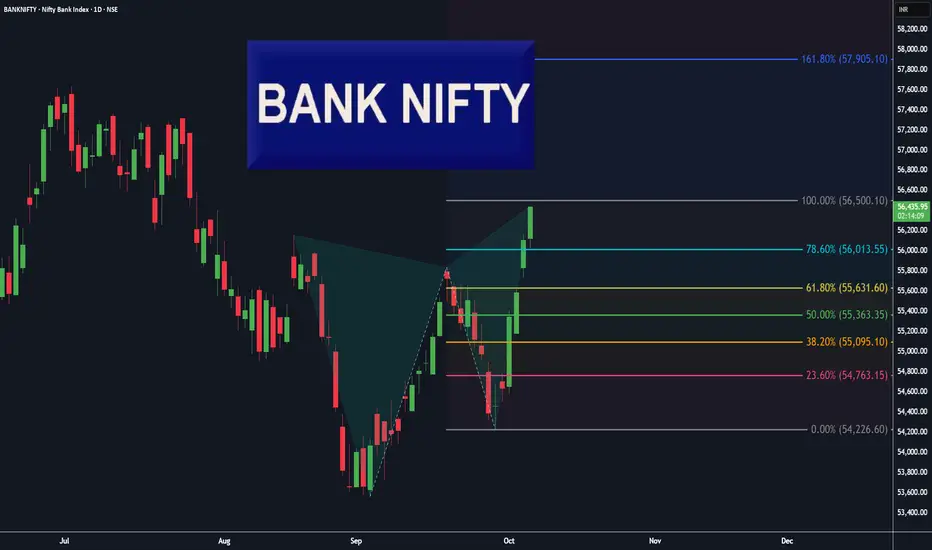
BankNifty Daily, Butterfly pattern completed!Beautiful Butterfly 🦋 pattern has completed on Daily chart of BankNifty.
Expect some profit booking or neutral trend in coming days up-to 55840 level.
Most near level is the re-test of 78.6% level ( 56013 ), for a new UP trend ( investors ).
" Buy 🟢 " above 56013 with the stop loss 🔻 of 55840, for the
🎯 Target 1: 56300
🎯 Target 2: 56500
🎯 Target 3: 57000
🎯 Target 4: open.
" Sell 🔴 " below 55631with the stop loss 🔺 of 55843, for the
🎯 Target 1: 55363
🎯 Target 2: 55095
🎯 Target 3: 54763
🎯 Target 4: open.
Smart Levels is Smart Trading. 👨🎓
⚠ RISK DISCLAIMER :
All content provided by "TradeWithKeshhav" is for information & educational purposes only.
It does not constitute any financial advice or a solicitation to buy or sell any securities of any type. All investments / trading involve risks. Past performance does not guarantee future results / returns.
Always do your own analysis before taking any trade.
Regards :
@TradeWithKeshhav & team
Happy Trading and Investing!
Nifty 50 Daily, Trend Based Fibonacci Extension (Natural levels)Hey Traders, I hope you all are doing well in your life.
Market is nature's response and Price is the God.
Let's check the market with the help of natural levels tool : Trend Based Fibonacci Extension .
After forming a ' W ' pattern on Daily chart, Nifty50 has given a pull-back ( base for Fib-Extension level tool, 24587 ).
Most near level is the re-test of 38.2% level ( 24980 ), for a new UP trend ( investors ).
" Buy 🟢 " above 25110 with the stop loss 🔻 of 24980, for the
🎯 Target 1: 25402
🎯 Target 2: 25650
🎯 Target 3: 26260
🎯 Target 4: 26500.
" Sell 🔴 " below 24960 with the stop loss 🔺 of 25110, for the
🎯 Target 1: 24880
🎯 Target 2: 24780
🎯 Target 3: 24680
🎯 Target 4: 24500.
Smart Levels is Smart Trading. 👨🎓
⚠ RISK DISCLAIMER :
All content provided by "TradeWithKeshhav" is for information & educational purposes only.
It does not constitute any financial advice or a solicitation to buy or sell any securities of any type. All investments / trading involve risks. Past performance does not guarantee future results / returns.
Always do your own analysis before taking any trade.
Regards :
@TradeWithKeshhav & team
Happy Trading and Investing!

GOLD Marching Toward $4,000 Zone? Gold Holds Firm Above 3,900Gold starts the week with relentless bullish momentum, breaking through 3,900 USD for the first time and eyeing new record highs.
The rally is fueled by safe-haven demand as the US government shutdown drags on and market expectations grow for an upcoming Fed rate cut. Despite a stronger USD and risk appetite in equities, gold buyers remain firmly in control.
🔎 Technical Outlook (H1 – FIBO Matrix)
📍 Reaction Buy Zones
3884 – 3880 (Fibo 0.5 support) → Short-term demand pocket.
386x (Fibo 0.618 H1) → Stronger liquidity-backed support, high-probability rebound zone.
📍 Reaction Sell Zones
393x – 394x (Fibo Extension 1.5 – 1.618) → Intraday resistance, possible rejection.
4,000 (Psychological Round Level) → Key psychological barrier; heavy liquidity likely.
🎯 Trade Plan
1️⃣ BUY Scenario
Entry: 3884 – 3880 / 386x, wait for bullish confirmation.
Targets: 3925 → 3940 → 4000.
Stop Loss: Below 3850.
2️⃣ SELL (Short-term Scalp)
Entry: 393x – 394x or rejection at 4000.
Targets: 3900 → 3884.
Stop Loss: Above 3952.
⚡ Key Insights
Trend bias remains bullish → Prefer long setups from strong Fibo supports.
3925 is the immediate hurdle, 4000 the ultimate psychological wall.
Watch USD volatility and Fed commentary for intraday direction.
💬 What’s your take, India?
Do you expect Gold to hit 4,000 this week, or will sellers defend the zone? Drop your setups 👇

LiamTrading – GOLD Weekly Plan ..GOLD Weekly Plan: Prepare for a Breakthrough to a New ATH
The new trading week opens with extremely complex sentiments — many traders are confused, and even the “big players” are cautious.
But if you look closely at the price structure, everything becomes clear: gold is still in a sustainable uptrend.
🧠 Psychological & Trend Analysis
Gold has just closed the week with a strong upward momentum, confirming the continuation of the medium-term uptrend.
At this stage, “Selling at the peak” is almost a dangerous move – as each correction is shallow and quick, not allowing sellers enough time to exit.
This creates a strong “fear of missing out” (FOMO) sentiment – driving funds to continue pouring in when the price hits the trendline or technical retracement zones.
📊 Technical Analysis
On the H4 chart, the upward structure of gold is clearly visible following the impulse + correction box pattern (each accumulation – breakout repeats).
The 3820–3830 zone continues to be the “golden retracement point” as it coincides with the medium-term uptrend line.
Last week's bounce from this zone brought excellent profits for those who patiently waited.
Currently, the next target for gold lies at the Fibonacci 1.618 zone – around 3980, which is also a significant psychological level where many investors might take profits.
🎯 Trading Scenario
Buy setup (trend-following):
Entry: 3830
Stoploss: 3815
Take Profit: 3980
Sell reaction (short-term upon reaching target):
Entry: around 3980
Stoploss: 3988
TP open depending on price reaction (scalping strategy)
🔍 Conclusion
Gold is still on the right growth trajectory, with short corrections merely opportunities to “accumulate”.
Continue trading with the trend, patiently waiting for the price to retrace to strong confluence zones instead of FOMO at high prices.
I will continue to share more details in daily updates here.
Follow me to not miss the latest gold scenarios.

Gold Outlook: Eyeing $4,000 – Fibo Expansion Zones in PlayGold continues to benefit from safe-haven demand as political risks in Washington and mixed U.S. data keep investors cautious. The metal is trading inside a clear bullish channel, with Fibonacci projections suggesting further upside before any major correction.
📊 Technical Deep Dive – H4 Structure
🔹 Fibonacci Confluence
The current rally respects 0.618 retracement at $3,820 and 0.786 retracement near $3,872, confirming algorithmic order flow.
Next expansion points are sitting at Fibo 1.5 – 1.618 ($3,995 – $4,003), a major liquidity target where reactions are likely.
🔹 Liquidity Pockets
$3,820 – $3,828: Historical demand block + Fibo 0.618, strong buy reaction zone.
$3,860 – $3,872: Active reaction layer, intraday support if retested.
$3,995 – $4,003: Key sell reaction zone, a liquidity grab area before possible retracement.
🔹 Candle & Flow
Breakout candles show strong momentum, pushing price toward untested liquidity.
However, multiple tests of $3,895 signal distribution pressure ahead of the $4,000 test.
🎯 Trade Playbook
🟢 Bullish Setup (Main Play)
Entry: $3,860 – $3,872
Targets: $3,895 → $3,995 → $4,003
Stop: Below $3,850
🔵 Deep Buy Setup (Aggressive)
Entry: $3,820 – $3,828
Targets: $3,872 → $3,895
Stop: Below $3,808
🔴 Countertrend Short (Scalp)
Entry: $3,995 – $4,003
Targets: $3,970 → $3,950
Stop: Above $4,010
⚡ Key Insights
Watch for a $4,000 liquidity sweep – could trigger either breakout continuation or sharp pullback.
If $3,860 support fails, deeper correction into $3,820 is expected before next rally.
H4 close above $3,895 strengthens bullish bias toward $4,003+.
📌 Question for traders: Will Gold break $4,000 and run, or is this a setup for a liquidity trap before correction? Share your view 👇

Gold Trading Plan | Limited Downside, Key Fibo Zones in Play🌍 Market Context
Gold is facing renewed selling pressure after yesterday’s bounce from the $3,820 area.
Risk-on sentiment and fresh USD buying are weighing on XAU/USD.
However, expectations of Fed rate cuts later this year and geopolitical tensions remain supportive, limiting deeper downside moves.
📊 Technical Analysis – Fibo Matrix Setup
🔴 SELL Reaction Zones
386x – 388x (Fibo retracement 0.5 – 0.618 + 0.786 confluence)
→ Intraday SELL scalp zone with strong rejection probability.
3881 – 3892 (Fibo 1.5 – 1.618 downtrend extension)
→ Key SELL liquidity zone for deeper rejection.
🟢 BUY Support Zones
3820 – 3819 (short-term recovery base) → Initial intraday support.
3795 – 3793 (Fibo 1.5 – 1.618 recovery zone) → Major liquidity pocket, ideal for BUY setups if tested.
🎯 Trading Scenarios
1️⃣ SELL Setup
Entry: 386x – 388x (watch rejection candlesticks).
Target: 3820 → 3795.
Stop Loss: Above 3892.
2️⃣ BUY Setup
Entry: 3795 – 3793 with bullish confirmation.
Target: 3860 → 3880.
Stop Loss: Below 3785.
⚡ Key Notes
USD momentum is crucial – if dollar strength continues, Gold may retest 379x zones.
Fed’s rate cut outlook and geopolitical headlines remain the “floor” for Gold.
Stick to clear Fibo reaction zones for best risk-to-reward setups.
💬 Community Insight:
Do you expect Gold to hold 3820 before bouncing, or will we see a flush into 379x liquidity?
Drop your setups below 👇

XAUUSD Daily Plan – Gold’s Pullback Before the Next Leg Higher📊 Market Overview
Gold has pulled back from its fresh record highs but the move looks more like healthy accumulation than a reversal. The 3,800 zone has acted as a strong support, absorbing selling pressure and keeping the broader bullish trend intact. Immediate rebounds confirm that buyers are still in control, preparing for the next breakout.
📍 Key Levels to Watch
🔴 SELL Reaction Zone
3,871 – 3,872 → First resistance level, possible short-term rejection.
3,915 – 3,920 (Fibo Liquidity Zone) → Stronger sell wall where profit-taking may appear.
🟢 BUY Zones
3,808 – 3,810 (Fibo 0.786 Support) → Important reaction zone for intraday buy setups.
3,747 – 3,752 (Fibo Liquidity Buy Zone) → Deep correction level, strong long-term demand area.
🎯 Trading Scenarios
1️⃣ Bullish Continuation Setup
Entry: Buy near 3,808 – 3,810 on bullish candlestick confirmation.
Targets: 3,871 → 3,900+
Stop: Below 3,795
2️⃣ Deep Pullback Opportunity
Entry: 3,747 – 3,752 if price flushes lower.
Targets: 3,808 → 3,871
Stop: Below 3,735
3️⃣ Countertrend SELL Setup
Entry: 3,915 – 3,920 only with strong rejection.
Targets: 3,871 → 3,808
Stop: Above 3,928
⚡ Trading Notes
Gold remains in a strong bullish channel – selling should only be tactical and short-term.
Watch US political headlines and end-of-month flows, as they could trigger volatility.
Stick to defined Fibo zones for best risk-to-reward setups.
💬 Community Discussion
Do you think Gold will test 3,900+ this week or will we see a deeper correction first? Share your charts and ideas below 👇
