GOLD: The Dollar Blinks! Time to 'Pay' at the 0.618 Fibo (4018) The Macro Play: USD Retreat Sets the Stage for Gold's Counter-Attack
The precious metal is catching a bid as the US Dollar softens after hitting its recent highs. The fundamental backdrop is keeping Gold buoyant:
Fed Pivot Narrative: Despite the hawkish undertones in the last FOMC meeting minutes, the market's conviction in two potential Fed rate cuts by year-end remains a powerful tailwind, making non-yielding Gold more attractive.
Geopolitical Fog: While the short-term truce news caused a minor retreat, the overarching safe-haven demand driven by global tensions and the looming US government funding crisis provides critical floor support.
Bottom Line: Gold is navigating a choppy consolidation phase. Short-term pressure exists, but the Long-Term Macro Thesis favors a cautious recovery.
📊 The MatrixFibo PTKT: SCALP Zones Are Active!
Price action shows clear reaction points within the recent sharp move lower. Our plan is to Trade the Reactions at these high-probability confluence zones.
1️⃣ The Aggressive SELL Zone (SELL SCALP Setup)
We are looking for the market to exhaust its short-term recovery rally at major resistance levels.
Primary SELL ZONE: 3997 - 4000 (0.5 Fibo Level):
This area is critical psychological resistance and the 50% retracement of the latest impulse down.
PLAN: Await a failed breakout or clear bearish rejection signal (Pinbar, Bearish Engulfing) at 3997 - 4000.
TARGET: The move should aim to clear the lows, heading straight for 3915 - 3910.
The Ultimate SELL Reversal: 4014 - 4018 (0.618 Fibo Downtrend Zone):
This is the REACTION FIBO 0.618 DOWNTREND H1 ZONE. This level is our strongest strategic SELL point if the bounce extends deeper.
2️⃣ The Key BUY Zone (BUY SCALP Setup)
We treat this area as the final line of defense for the current uptrend structure.
Key Support & BUY SCALP REACT ZONE: 3915 - 3910:
This zone is a Major Confluence point: Key Support, the 0.786 Fibo, and the Uptrend Channel Bottom.
PLAN: Look for strong buying pressure to emerge as price tests 3915 - 3910. Requires a solid Bullish Price Action Confirmation.
TARGET: A successful bounce targets the liquidity back at 3997 - 4000.
🛑 FranCis MatrixFibo Risk Policy
Volatility Alert: Expect large swings around US data and Fed commentary. NEVER TRADE WITHOUT A HARD STOP LOSS (SL) on SCALPS.
Strategy Focus: The market is range-bound. Stick to a Two-Sided Scalping Plan defined by the identified price levels.
Discipline: Only enter trades at or with clear confirmation from the React Zones.
Fibonacci Retracement

GOLD UPDATE – Bulls Defend $4,000 Ahead of Powell’s SpeechGold continues to hold firm above the key $4,000 psychological level, even after a sharp correction from the all-time high near $4,059. The market’s focus now shifts to Fed Chair Jerome Powell’s speech, which could set the tone for the next directional move.
Despite the recent dip, the overall structure remains bullish, and the FiboMatrix setup still signals that buyers are not out of the game yet.
Technical Structure (H1 – FiboMatrix View)
Support Zone (BUY Setup):
4010 – 4012 → Retest of breakout trendline + Fibo 0.618 reaction zone.
Strong intraday base where liquidity may reload for another bullish leg.
Reaction Buy Zone:
402x → Potential confirmation area if price reacts positively.
Resistance Zone (ATH):
4060 → Previous intraday top, acting as the first major barrier before retesting 408x.
SELL Reaction Zone:
4084 – 4086 → Fibo 1.5 – 1.618 expansion zone, potential scalp short zone with tight stop above 4090.
🎯 Trading Plan (Francis Strategy)
✅ BUY Setup:
Entry: 4010 – 402x (wait for confirmation).
TP1: 4060
TP2: 4084
SL: Below 3996
⚠️ SELL Setup (Short-term scalp):
Entry: 4084 – 4086 (if rejection forms).
Target: 4040 → 4020
SL: Above 4096
🔑 Francis Outlook
Gold’s short-term correction looks more like a controlled retracement than a trend reversal.
As long as the price holds above the $4,000 handle, the bullish bias stays intact.
👉 Expect potential consolidation before Powell’s remarks, followed by a sharp reaction depending on the tone of his speech.
A clean breakout above 4060 – 4086 will open the path toward $4,100+ and new ATH targets.
🚀 Trend Bias: Bullish above 4010 – Buy the Dip, Sell only at Fibo extremes with confirmation.

GOLD XAU/USD – Intraday Plan | Bulls Targeting 4,000$Gold has once again proven its safe-haven dominance, pushing close to 3,980$ during the Asian session. Despite USD fluctuations and global market risk-on vibes, buyers remain firmly in control. The psychological milestone of 4,000$ is now directly in focus.
🔎 Technical Snapshot (M30)
Trend remains bullish, supported by the Fibo channel.
Dip-buying pressure continues to dominate intraday price action.
Sellers will only gain short-term control near the 3988 – 4000$ resistance zone.
🔑 Key Trading Levels
BUY Zone (Fibo 0.618): 395x → Ideal intraday demand.
Support Zone: 393x → Must hold for bullish structure.
Immediate Resistance: 397x → Current ATH zone.
SELL Reaction Zone: 3988 – 4000$ → Potential short scalp.
Major Resistance: 4000 – 4006$ → Strong psychological wall.
📌 Trading Plan (FranCi$$ Style)
✅ BUY on Dips
Entry: 395x – 393x
Targets: 3975 → 3988 → 4000$
Stop Loss: Below 392x
⚡ SELL Scalp
Entry: 3988 – 4000$
Targets: 3970 → 3950$
Stop Loss: Above 4015$
🎯 Final Take
Gold’s path remains upward, but the 4000$ barrier is where bulls meet the biggest challenge. Smart traders will look to buy dips for continuation and use scalp sells only at strong rejection zones.
🔥 Stay tuned with FranCi$$ for realtime intraday updates – precision signals, scalping setups, and golden opportunities!

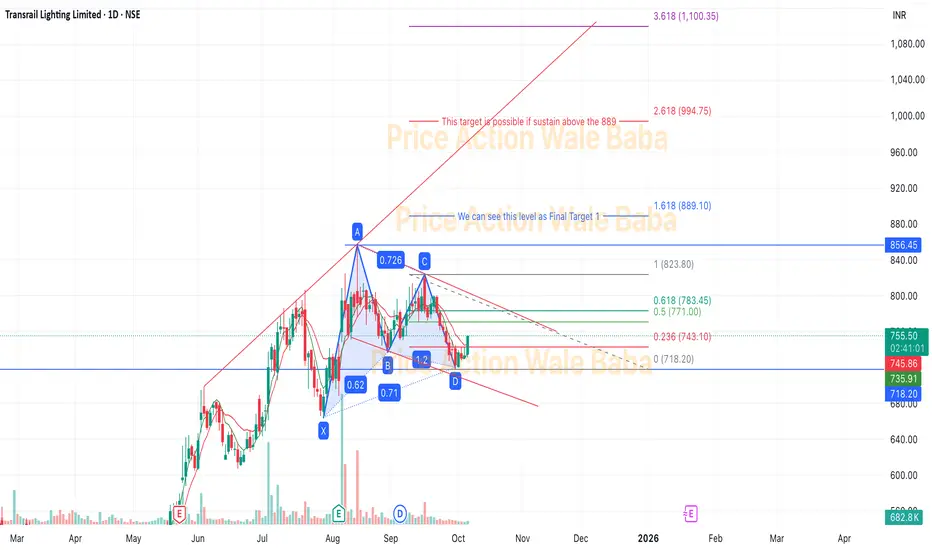
Transrail Lighting LtdTransrail Lighting Ltd is near support level and making a butterfly pattern.
Here, Fibonacci levels are applied. So, If it breaks the ratio of 0.5 & 0.618, we will see 1.0
Based on ratio you can see target level in the chart.
As per fundamentals theory, 0.5 and 0.618 are strong resistance, once sustain above this it will touch to 1.0 and 1.618. So accumulate on every dip.
Also, this stock has took support from the all time high level. It had given the breakout earlier and give some upside movement, now taking support from that ATH level and ready to go up.
GOLD Marching Toward $4,000 Zone? Gold Holds Firm Above 3,900Gold starts the week with relentless bullish momentum, breaking through 3,900 USD for the first time and eyeing new record highs.
The rally is fueled by safe-haven demand as the US government shutdown drags on and market expectations grow for an upcoming Fed rate cut. Despite a stronger USD and risk appetite in equities, gold buyers remain firmly in control.
🔎 Technical Outlook (H1 – FIBO Matrix)
📍 Reaction Buy Zones
3884 – 3880 (Fibo 0.5 support) → Short-term demand pocket.
386x (Fibo 0.618 H1) → Stronger liquidity-backed support, high-probability rebound zone.
📍 Reaction Sell Zones
393x – 394x (Fibo Extension 1.5 – 1.618) → Intraday resistance, possible rejection.
4,000 (Psychological Round Level) → Key psychological barrier; heavy liquidity likely.
🎯 Trade Plan
1️⃣ BUY Scenario
Entry: 3884 – 3880 / 386x, wait for bullish confirmation.
Targets: 3925 → 3940 → 4000.
Stop Loss: Below 3850.
2️⃣ SELL (Short-term Scalp)
Entry: 393x – 394x or rejection at 4000.
Targets: 3900 → 3884.
Stop Loss: Above 3952.
⚡ Key Insights
Trend bias remains bullish → Prefer long setups from strong Fibo supports.
3925 is the immediate hurdle, 4000 the ultimate psychological wall.
Watch USD volatility and Fed commentary for intraday direction.
💬 What’s your take, India?
Do you expect Gold to hit 4,000 this week, or will sellers defend the zone? Drop your setups 👇

Fibonacci Tool: Why It’s NOT a Trading StrategyMost traders wrongly treat Fibonacci as a standalone strategy—it’s just a support tool, not a secret pattern for auto profits. Discover how real pros use it for bias, not blind buys, and avoid the retail trap

Gold Trading Plan | Limited Downside, Key Fibo Zones in Play🌍 Market Context
Gold is facing renewed selling pressure after yesterday’s bounce from the $3,820 area.
Risk-on sentiment and fresh USD buying are weighing on XAU/USD.
However, expectations of Fed rate cuts later this year and geopolitical tensions remain supportive, limiting deeper downside moves.
📊 Technical Analysis – Fibo Matrix Setup
🔴 SELL Reaction Zones
386x – 388x (Fibo retracement 0.5 – 0.618 + 0.786 confluence)
→ Intraday SELL scalp zone with strong rejection probability.
3881 – 3892 (Fibo 1.5 – 1.618 downtrend extension)
→ Key SELL liquidity zone for deeper rejection.
🟢 BUY Support Zones
3820 – 3819 (short-term recovery base) → Initial intraday support.
3795 – 3793 (Fibo 1.5 – 1.618 recovery zone) → Major liquidity pocket, ideal for BUY setups if tested.
🎯 Trading Scenarios
1️⃣ SELL Setup
Entry: 386x – 388x (watch rejection candlesticks).
Target: 3820 → 3795.
Stop Loss: Above 3892.
2️⃣ BUY Setup
Entry: 3795 – 3793 with bullish confirmation.
Target: 3860 → 3880.
Stop Loss: Below 3785.
⚡ Key Notes
USD momentum is crucial – if dollar strength continues, Gold may retest 379x zones.
Fed’s rate cut outlook and geopolitical headlines remain the “floor” for Gold.
Stick to clear Fibo reaction zones for best risk-to-reward setups.
💬 Community Insight:
Do you expect Gold to hold 3820 before bouncing, or will we see a flush into 379x liquidity?
Drop your setups below 👇

XAUUSD – Gold Smashes to New ATH: Bulls in Full Control📊 Market Overview
Gold has surged into uncharted territory, breaking through to a fresh All-Time High (ATH). The earlier dip toward 3,800 USD acted as nothing more than a springboard, allowing buyers to reload before launching this powerful breakout.
Safe-haven demand continues to fuel the rally, as concerns over a potential US government shutdown and expectations of more Fed rate cuts strengthen bullish momentum.
📍 Crucial Levels to Watch
🔴 SELL Reaction Zone
3,911 – 3,915 (Liquidity Resistance) → Potential short-term ceiling, profit-taking may appear here.
🟢 BUY Reaction Zones
3,830 – 3,820 (Fibo Support) → First pullback level for intraday buyers.
3,808 – 3,810 → Secondary support zone for a deeper correction.
3,747 – 3,752 (Liquidity BUY Zone) → Stronger base for swing buyers.
🎯 Trading Setups
1️⃣ Buy the Dip (Primary Play)
Entry: 3,830 – 3,820, confirmation needed.
Targets: 3,900 → 3,915, extend toward 3,950+ if momentum remains strong.
Stop: Below 3,808.
2️⃣ Sell the Spike (Countertrend)
Entry: 3,911 – 3,915, only on visible rejection.
Targets: 3,871 → 3,830.
Stop: Above 3,922.
3️⃣ Swing Buy Opportunity
Entry: 3,752 – 3,747 (Fibo confluence).
Targets: 3,830 → 3,900.
Stop: Below 3,735.
⚡ Pro Tips
Trend bias = Strongly Bullish, prioritize long setups.
Countertrend shorts are tactical; keep stops tight.
Headlines from the US political scene and Fed could trigger extra volatility at highs.
💬 Discussion
Will gold extend to 3,950 – 4,000 USD, or is a sharp pullback around the corner? Drop your views and charts below 👇

XAUUSD Daily Plan – Gold’s Pullback Before the Next Leg Higher📊 Market Overview
Gold has pulled back from its fresh record highs but the move looks more like healthy accumulation than a reversal. The 3,800 zone has acted as a strong support, absorbing selling pressure and keeping the broader bullish trend intact. Immediate rebounds confirm that buyers are still in control, preparing for the next breakout.
📍 Key Levels to Watch
🔴 SELL Reaction Zone
3,871 – 3,872 → First resistance level, possible short-term rejection.
3,915 – 3,920 (Fibo Liquidity Zone) → Stronger sell wall where profit-taking may appear.
🟢 BUY Zones
3,808 – 3,810 (Fibo 0.786 Support) → Important reaction zone for intraday buy setups.
3,747 – 3,752 (Fibo Liquidity Buy Zone) → Deep correction level, strong long-term demand area.
🎯 Trading Scenarios
1️⃣ Bullish Continuation Setup
Entry: Buy near 3,808 – 3,810 on bullish candlestick confirmation.
Targets: 3,871 → 3,900+
Stop: Below 3,795
2️⃣ Deep Pullback Opportunity
Entry: 3,747 – 3,752 if price flushes lower.
Targets: 3,808 → 3,871
Stop: Below 3,735
3️⃣ Countertrend SELL Setup
Entry: 3,915 – 3,920 only with strong rejection.
Targets: 3,871 → 3,808
Stop: Above 3,928
⚡ Trading Notes
Gold remains in a strong bullish channel – selling should only be tactical and short-term.
Watch US political headlines and end-of-month flows, as they could trigger volatility.
Stick to defined Fibo zones for best risk-to-reward setups.
💬 Community Discussion
Do you think Gold will test 3,900+ this week or will we see a deeper correction first? Share your charts and ideas below 👇

XAUUSD – Gold Daily Plan | Sharp Drop, What’s Next?Gold printed a sudden 70+ point drop from 388x to 380x, leaving traders questioning:
– Was this a big player manipulation?
– Or simply institutional profit taking?
Key reaction zones will define if Gold holds above 3800 or dives deeper.
📍 Critical Levels
🔴 SELL Reaction Zone
387x → Strong resistance where sellers may step in.
🟢 BUY Zones
3780 (Retest Breakout + Trendline) → First demand zone.
375x (Fibo Support Zone) → Strong liquidity pocket, potential reversal.
🎯 Trading Scenarios
1️⃣ SELL Idea
Entry: 387x
Targets: 3800 → 3780
SL: Above 3888
2️⃣ BUY Idea
Entry: 3780 – 375x
Targets: 3838 → 387x
SL: Below 3745
⚡ Trading Notes
High volatility expected near 3800 psychological mark.
Stick to zone trading – avoid mid-range traps.
Monitor USD strength; any spike could pressure XAU further.
💬 Discussion
Do you think Gold will break below 3800 or bounce back to test 387x? Drop your views 👇

Gold Bulls in Control: Buy Zones Lined Up for the Breakout!📊 Market Context
Gold is trading near record highs around $3,850, heading toward its best month in 14 years. With Q3 2025 and September closing, gold has surged nearly 12% this month, driven by rising safe-haven demand amid the looming U.S. government shutdown and weaker USD sentiment.
The bullish structure remains intact, and dips continue to attract aggressive buyers.
📍 Key Trading Levels
🟢 BUY Zones
3846 – 3843 → Intraday BUY scalp zone
SL: 3836
TP: 1R → 2R → 3R → 4R (hold longer if above 389x)
3818 – 3816 → Deeper reaction BUY zone
SL: 3810
TP: 1R → 2R → 3R → 4R (limit orders can be set for extended swing positions)
🔴 SELL Reaction Zone
Around 387x → Expect heavy profit-taking and short-term pullbacks.
🎯 Trade Plan
Prioritize BUY setups only; gold remains in strong bullish momentum.
Use the 384x zone for scalps and 381x zone for deeper limit buys.
Trail stops once price breaks 389x, opening room for 3920+ targets.
⚡ Trading Notes
Volatility may spike with U.S. political risks – manage positions carefully.
Avoid chasing highs; wait for structured retracements to BUY zones.
Stick to R/R discipline; market rewards patience in strong trends.
💬 Community Insight
Do you think gold will smash through 3920+ this week, or will we get another retracement first? Drop your setups and let’s compare strategies 👇

XAUUSD – FIBO MATRIX Trading Plan | Key Levels for TodayMarket Snapshot
Gold is attracting steady buying interest as dovish Fed expectations keep the USD capped near 3-week highs.
At the same time, geopolitical tensions and tariff concerns add to safe-haven demand.
Focus now shifts to US PCE inflation data, which could trigger the next big move.
📍 Important Price Zones (M30)
🔴 SELL Reaction Zones
3767 – 377x → Major rejection area (Fibo 0.786).
3810 – 3817 → Strong SELL zone (Fibo 1.5 – 1.618).
🟢 BUY Support Zones
3725 → First support zone.
3690 – 3695 → Deep pullback support (Fibo confluence).
🎯 Trading Ideas
1️⃣ SELL Setup
Entry: 3767 – 377x (if rejection signal shows).
Targets: 3750 → 3725.
SL: Above 3778.
2️⃣ BUY Setup
Entry: 3725 with bullish confirmation.
Targets: 3760 → 377x.
SL: Below 3715.
3️⃣ Deep BUY Opportunity
Entry: 3690 – 3695 zone.
Targets: 3725 → 3760.
SL: Below 3685.
⚡ Trading Insights
Respect the Fibo reaction levels for clean entries.
Risk range: 6–8 USD to avoid stop hunts.
Book profits in steps: 1R → 2R → 3R for strong RR balance.
💬 Community Talk
Do you see gold breaking above 3770 first, or dropping to 3725/3695 before bouncing back? Share your chart view 👇

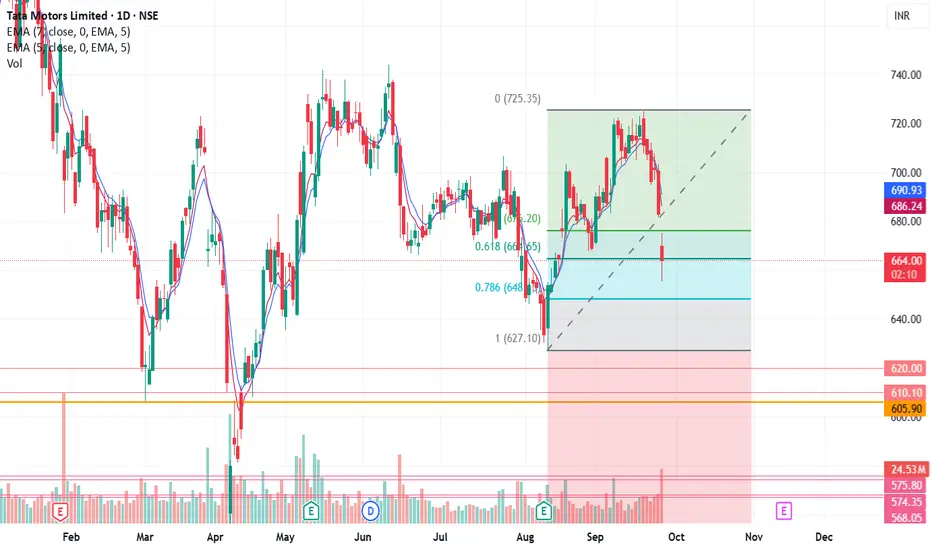
On Golden level of Fibonacci RetracementWith recent bullish momentum in the Auto industry, this looks like a good time to catch Tatamotors as it is on the Fibonacci Retracement golden level. I am bullish on this. Pinbar candle on the bottom on a daily basis gives me more confidence.
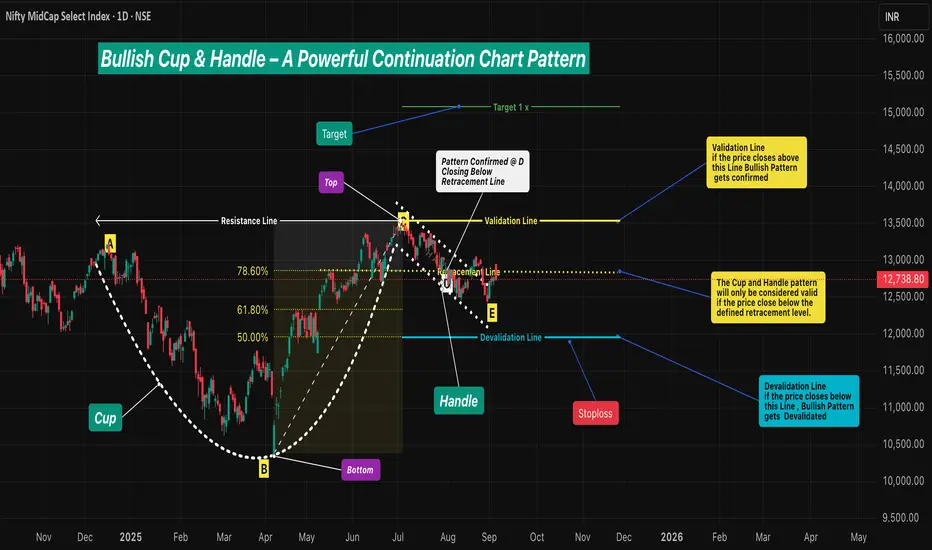
Bullish Cup & Handle – A Powerful Continuation Chart Pattern🔹 Intro / Overview
☕ The Cup and Handle is a 📈 bullish continuation pattern often studied in technical analysis.
⚔️ It forms when there is a fight between bulls 🐂 and bears 🐻 — the Cup develops as both remain strong.
📉 During the Handle, sellers 🛑 temporarily gain strength.
📈 But when price closes above the Validation Line, buyers regain control 💪 and bullish momentum dominates.
____________________________________________________________
📖 How to Identify
✅ Validation → The pattern is valid if price closes above the Validation Line.
❌ Devalidation → The pattern is invalid if price closes below the Devalidation Line(before Validation).
📉 Retracement Rule →The pattern is only confirmed if the price closes below the Retracement Line during the Handle formation.
This ensures a proper pullback forms before breakout .
____________________________________________________________
📖 Key Points of Pattern
✅ A valid Cup requires the retracement condition — confirmation occurs only if price closes below the Retracement Line .
⚖️ Balanced Highs → Point A (left peak) and Point C (right peak) should be relatively close in price, ensuring a proper Cup shape 🍵.
🔒 The Handle must not break the structural integrity of the Cup.(No Close Below Devalidation Lines)
____________________________________________________________
🎯 Trading Plan (Educational Only)
📌 Entry → Considered only after confirmation when price closes above the Validation Line.
🛡️ Stop-Loss (SL) → After validation, the Devalidation Line may act as an SL.
🎯 Target (TP) →
First Target → 1R (equal to the risk defined by Entry–SL distance).
Remaining Lots → Trail using ATR, Fibonacci levels, Box Trailing, or structure-based stops.
____________________________________________________________
📊 Chart Explanation
🍵 The Cup forms with a rounded base Point B and two balanced tops: Point A (left peak) & Point C (right peak) - The marginal price difference should be small to ensure a reliable Cup.
📈 The Retracement Line ( Point D ) confirms the pattern only if price closes below the Fibonacci Level of 78.60% and above the 50.00% .
📉 The Handle develops as price pulls back, with Point E marking the Handle low. and Good Handle of Cup is Formed (this low should not go below 50.00% Level )
📏 The Fibonacci retracement levels are drawn from Point B (Cup base) to Point C (right peak). These levels provide a reference framework to observe Retracement (minimum 78.60%) , Validation (100.00%) , and Devalidation (50.00%) areas for educational study of the structure.
____________________________________________________________
👀 Observations
✨ Works best after a strong uptrend 🚀 or at major support–resistance zones 🧱.
⚖️ A balanced Cup (Top Right ≈ Top Left) improves reliability.
📏 Handle Formation
The Handle should be shorter than the Cup depth — and should also be longer than the required minimum depth for proper structure.
If the Handle is too deep, it weakens the setup — and also if it is too short, the formation loses reliability.
____________________________________________________________
❗ Why It Matters
🔍 Shows the market battle between buyers and sellers.
💪 Highlights how buyers regain dominance after retracement validation.
⚖️ Balanced structure + strict rules = better filtering of weak setups.
📝 Provides clarity on entry, SL, and TP with a structured framework.
____________________________________________________________
🎯 Conclusion
The Cup and Handle pattern, when validated through Fibonacci retracement rules 📉, balanced highs ⚖️, and proper Handle structure 🔒, offers a disciplined framework for studying bullish continuation setups.
🔥 Patterns don’t predict. Rules protect.
____________________________________________________________
⚠️ Disclaimer
📘 For educational purposes only.
🙅 Not SEBI registered.
❌ Not a buy/sell recommendation.
🧠 Purely a learning resource.
📊 Not Financial Advice.
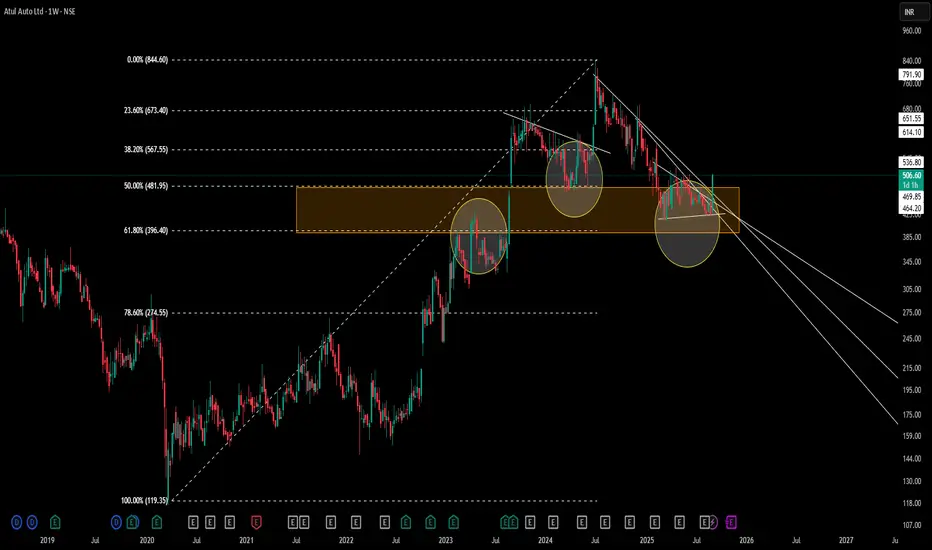
Atul Auto | MTF Fibonacci Confluence structuresWeekly Chart Analysis
– Drew a multi-timeframe Fibonacci from the 119.35 low (Mar ’20) to the 844.60 high (Oct ’24) on the Monthly time frame .
– Highlighted the 50–61.8% retracement zone (481.95–396.40) as an orange supply/demand area.
– Circles mark historical pivots where price reacted as support or resistance within this zone.
Key Observations
-Price consistently respected the 50–61.8% band during prior rallies and pullbacks.
-Recent price action formed a contracting triangle (CT) at the lower edge of the Fibonacci zone.
-Volume contraction noted inside the triangle, suggesting supply–demand equilibrium.
Disclaimer: This analysis is provided for educational and informational purposes only and does not constitute financial advice. Trading involves risk, and you should perform your own research and consider your risk tolerance before making any trading decisions.
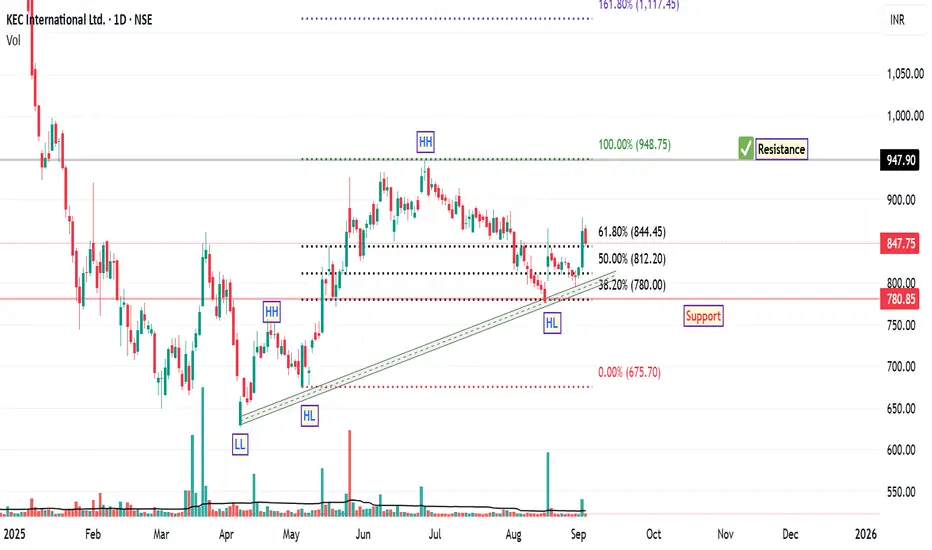
KEC International: Bullish Structure with StrengthSince April 7th, the price structure of KEC International has demonstrated a notable bullish trend reversal, characterized by the formation of higher highs and higher lows along an ascending trendline. This pattern is often interpreted by technical analysts as a sign of strengthening upward momentum.
A recent Fibonacci retracement, drawn from the swing low to the swing high of the current rally, revealed a pullback to the 38.2% level—a zone commonly viewed as a potential support area within a prevailing uptrend. The stock responded positively to this level, rebounding and subsequently closing above the 61.8% retracement level, which is another key technical threshold.
Interestingly, the price has retested the 61.8% level and held firm, suggesting that this area may be acting as a support base. Additionally, the stock has managed to close above its 200-day EMA, a long-term trend indicator that many market participants use to assess broader directional bias. A sustained position above the 200 EMA is generally considered constructive from a trend-following perspective.
From a structural standpoint, based on current chart dynamics, the next potential resistance zone appears to be near ₹948, while the suggested support level is around ₹780 . These levels are derived from historical price action and technical confluence zones, and may serve as reference points for monitoring future price behaviour.
Disclaimer: This analysis is intended solely for educational and informational purposes. It does not constitute investment advice or a recommendation to buy, sell, or hold any financial instrument. Market conditions are subject to change, and trading decisions should be made based on individual research, risk assessment, and consultation with a licensed financial advisor.
Multi-Confirmation Price Action: Fibonacci Zones, Base BreakoutsExplore multi-confirmation techniques using Fibonacci retracement to identify high-probability base breakout zones. Learn how to spot double bottom and inverted head & shoulders patterns at demand levels and execute confirmation trades for precision entries

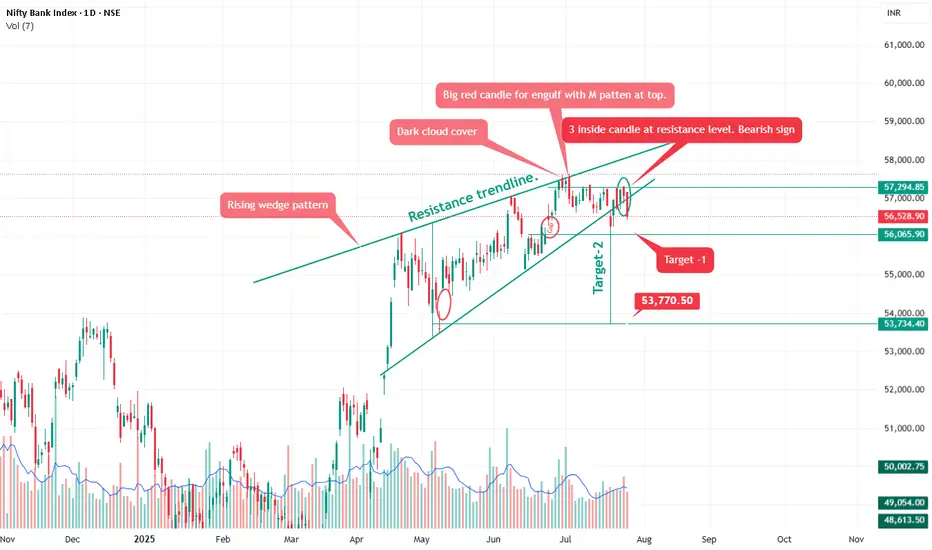
Bank nifty Rising wedge pattern.Pattern Analysis
Rising Wedge Pattern:
A bearish pattern typically seen near tops. It shows narrowing price movement with higher highs but declining momentum.
Breakdown confirmed as price has fallen below the lower wedge support trendline.
Confirms selling pressure and rejection from the top near 57,300–57,500 zone.
🕯️ Candlestick Signals
Dark Cloud Cover:
A bearish reversal pattern indicating sellers have taken control after a bullish phase.
Big Red Candle + ‘M’ Pattern:
Bearish engulfing at resistance – strong indication of a top formation.
3 Inside Down Candlestick Pattern at Resistance:
Recent red candles have higher volume, confirming institutional selling activity.
As anticipated in our previous analysis, Bank Nifty corrected from the 57,000 level to 56,056, validating the bearish setup.
It is also expected to short here 56,550 add on any rise up to 57,700-57,950 for target mentioned on chart.
Alternative Scenario: Be aware that the rising wedge could potentially break upwards. If the price breaks decisively above the resistance trendline with strong volume, the bearish outlook would be invalidated.
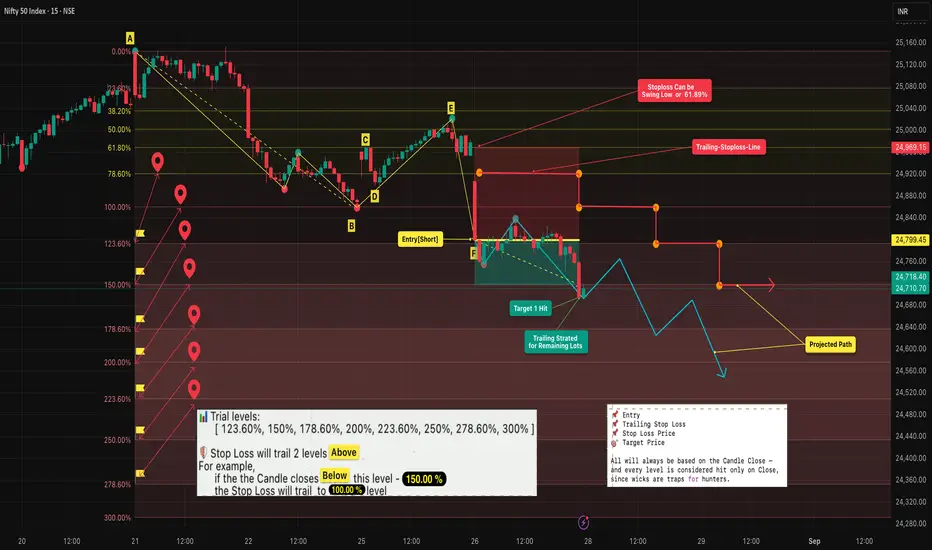
Fibonacci Retracement Trailing : Lock Profits & Ride Trends🔹 Intro / Overview
Managing trades after entry is just as critical as spotting the entry itself.
In this idea, we apply Fibonacci retracements with a trailing stop system to capture profits while staying disciplined.
A well-structured trailing plan helps traders:
✅ Lock in gains early
🛡️ Protect capital against reversals
📊 Stay rule-based instead of emotional
---
📖 Concept
- A swing High (A) to Low (B) defines our Fibonacci retracement zones.
- Retracements (C, E) test Fibonacci levels but don’t confirm entry until structure is validated.
- Entry (F) occurs only after a successive close confirms the short trade.
- Stop Loss (SL) is placed at the 61.8% retracement (closer and more protective than the far swing).
- Trailing: SL trails forward only , two Fib levels behind price. It manages the remaining position after booking partial profits.
---
📊 Chart Explanation (Step-by-Step)
1️⃣ Swing Definition
📍 A = Swing High
📍 B = Swing Low
2️⃣ Retracement Testing
- C → first retracement (no confirmation)
- D → invalid as no proper close
- E → deeper retracement, still no entry
3️⃣ Entry Point
✅ At F, successive closes confirm → short entry taken
4️⃣ Stop Loss (SL)
📉 Set at 61.8% retracement for tighter risk management
5️⃣ Targets & Trailing
🎯 Target 1 hit → exit one lot, secure partial profits
🔄 Remaining lots managed with trailing system:
• SL adjusted only forward , never backward
• SL trails as price moves down:
• 150% → SL to 100%
• 178.6% → SL to 123.6%
• 200% → SL to 150%, etc.
6️⃣ Projected Path
🔍 Blue/red paths illustrate how price could move while trailing locks in gains
---
🔍 Observations
📌 Entry validated on structure → reduces false signals
🎯 Booking partial profits builds confidence and ensures realized gains
🔄 Trailing maximizes potential while staying safe
📊 Fib-based progression keeps decisions mechanical, not emotional
---
✨ Why It Matters
✔ Turns static Fibonacci into a dynamic strategy
✔ Prevents giving back profits when trends reverse
✔ Adds confidence and discipline in trade management
✔ Teaches how to scale out smartly
---
✅ Conclusion
Fibonacci retracement alone gives levels — but combining it with a trailing stop system transforms it into a complete trade plan.
By booking partial profits and trailing the rest:
🛡️ You protect capital
🚀 You ride trends longer
🤝 You trade with discipline instead of emotion
---
⚠️ Disclaimer
For educational purposes only · Not SEBI registered · Not a buy/sell recommendation · No investment advice — purely a learning resource
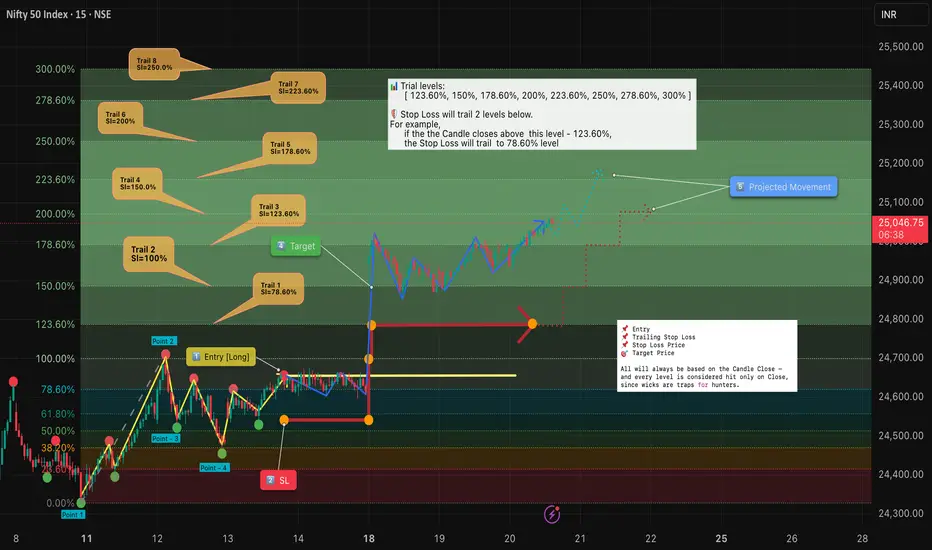
Trailing Stops: Protect Profits & Ride the Trend with Discipline🔹 Intro / Overview
Managing a position after entry is just as important as identifying the entry itself.
Here, we are specifically discussing trailing stops using Fibonacci retracements .
A well-structured trailing stop helps traders:
✅ Lock in profits
🛡️ Reduce risk
📊 Stay objective in the face of market noise
This idea shows how trailing stops can be applied in a structured way to complement Fibonacci retracements and trend management.
📖 Concept
📍 A trailing stop is a dynamic stop-loss that adjusts as price moves in your favor.
🔄 Instead of staying fixed, it “trails” price at a chosen distance — capturing more upside while capping downside.
🧩 Traders often trail stops using swing lows/highs, moving averages, or volatility measures like ATR .
📊 Chart Explanation (Step-by-Step)
1️⃣ Entry Criteria
✅ Successive closes above 78.6% confirm the long entry.
2️⃣ Stop Loss (SL)
📉 Placed at the previous swing low for structure-based protection.
⏩ SL adjustments move forward only with trailing rules — never backward.
3️⃣ Trailing Levels
👉 SL always trails two levels below the current trail level if the candle closes above it.
📈 Trail 1: 123.60% → SL moves to 78.60%
📈 Trail 2: 150.00% → SL moves to 100.00%
📈 Trail 3: 178.60% → SL moves to 123.60%
📈 Trail 4: 200.00% → SL moves to 150.00%
📈 Trail 5: 223.60% → SL moves to 178.60%
📈 Trail 6: 250.00% → SL moves to 200.00%
📈 Trail 7: 278.60% → SL moves to 223.60%
📈 Trail 8: 300.00% → SL moves to 250.00%
4️⃣ Target Points
🎯 At Target 1 , book one lot to secure profits.
📊 Remaining positions can be trailed further with the next levels.
5️⃣ Projected Path
🔍 Dotted blue/red projections illustrate potential movement under this trailing system.
🔍 Observations
📌 Objective Entry : Requires successive closes above 78.6%, reducing false signals.
🎯 Partial Profit Booking : Taking one lot off at Target 1 ensures realized gains.
🔄 Two-Level Trailing : Locks in profits while leaving room for trend continuation.
📊 Rule-Based Framework : Clear Fibonacci-based progression keeps decisions mechanical and consistent.
✨ Why It Matters
✔ Prevents turning winning trades into losers.
✔ Builds confidence by removing emotions from exit decisions.
✔ Lets profits run while maintaining protection.
✅ Conclusion
Trailing stops are not about perfection — they’re about discipline .
By systematically adjusting stops as the market moves, traders:
🛡️ Protect capital
🚀 Let profits run
🤝 Remove emotions from decision-making
When combined with Fibonacci retracements , trailing stops provide a structured framework to manage trades effectively after entry.
⚠️ Disclaimer : For educational purposes only · Not SEBI registered · Not a buy/sell recommendation · No investment advice — purely a learning resource
Coal India trade based on open = high theory
observations:-
recent trend has been upside
yesterday's candle made open = high, making it suitable to take up the short
target marked p 377, 371 based on Fibo levels
stop 386
lets enjoy this short trade

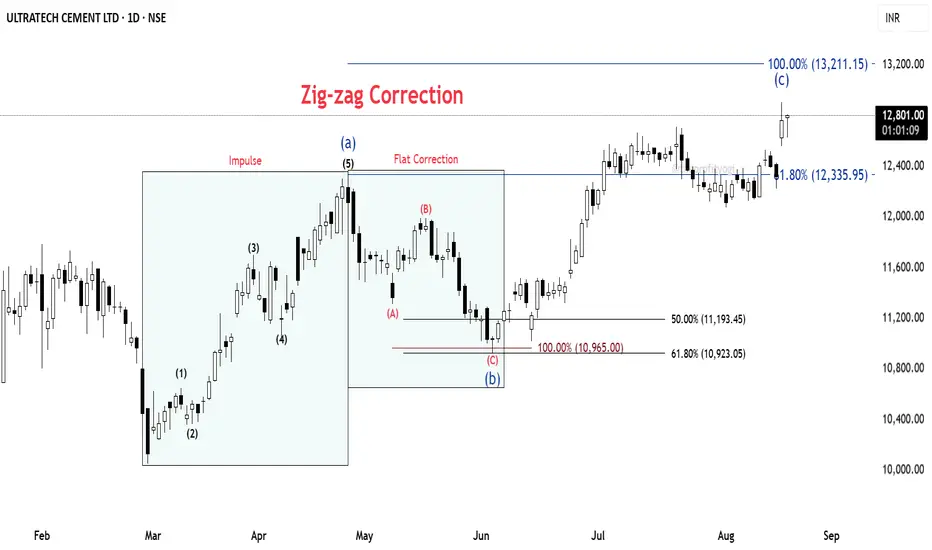
ULTRACEMCO: Wave C started from strong Fib clusterULTRACEMCO – Daily Chart Analysis
🔹 Base Point: The count begins from the low made on 3rd March 2025.
🔹 From this low, the price moved up in the form of a clear impulse wave, completing a 5-wave structure.
🔹 This was followed by a corrective fall, retracing 61.8% Fibonacci of the prior impulse.
⚡ Correction Phase:
The decline is counted as an ABC Flat correction (red).
Within this, the C wave extended fully to the 100% Fibonacci projection.
At this point, we observe a strong cluster zone formed by the 61.8% retracement and 100% extension, indicating confluence and potential support.
📈 Current Development:
From this support, the price has begun to move up again, showing the characteristics of a fresh impulse.
The overall structure fits into a larger Zig-Zag correction, where Wave C is still under development.⏳
📝 Summary:
✅ Impulse up (5 waves)
✅ Flat correction (A-B-C) complete at Fib cluster
🚀 Wave C of Zig-Zag unfolding
#ULTRACEMCO #NSEStocks #ElliottWave #Fibonacci #WaveAnalysis #TradingSetup #PriceAction
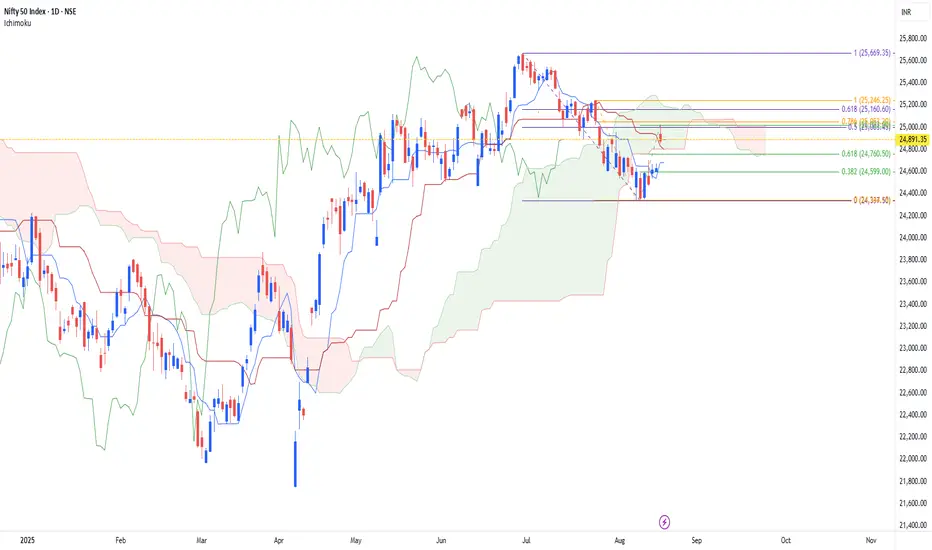
Nifty Short Entry Based on TRIPLE CROWN Theory
combining specific Fibo Retracement level, identified areas that can be used to go short in NIFTY
range to go short is - 25160 to 25000, which got triggered yesterday,
let us go for short till yesterday's high is not breached
target will be 24760 and 24600 and then 24340
stop can be placed 25000
this trade is purely based on entry when the price falls in TCZ (The Triple Crown Zone), which is price zone based on FIBO RETRACEMENT LEVELS IN A SPECIFIC ORDER
note :-
more then entering the trade
it will be more interesting to understand this theory and its impact if price stays in TCS zone today and how it reacts here on
stay tuned
have a good day to all