Nibe Ltd – Elliott Wave UpdateNibe Ltd – Elliott Wave Update
Nibe Ltd has reversed decisively from the 78.6% Fibonacci retracement, completing a textbook ABC corrective structure. The reversal was accompanied by clear bullish divergence on RSI and MACD, confirming exhaustion of the corrective phase.
Following the reversal:
Wave 1 of the new impulsive structure is complete
Wave 2 has unfolded as a shallow, time-wise correction
Price is now trading in Wave 3, supported by expanding momentum and rising volume
As long as price holds above the recent swing low (~₹1,030), the impulsive structure remains valid. Momentum indicators continue to support further upside, suggesting the trend is in an acceleration phase rather than exhaustion.
Trend Bias: Bullish
Structure: Impulsive (Wave 3 in progress)
Minimum Target: ₹1,700
Invalidation Level: Below the Wave-2 low
Fibonnacci

Chumtrades XAUUSD Trading PlanMarket Context
During Friday’s session, after the previous range breakout, the market saw strong profit-taking pressure from buyers.
Large capital exits triggered a sharp sell-off of ~96 prices, while the 426X base zone supported price very well.
Overall structure remains bullish.
👉 Session Expectation
Price is likely to move in a sideways range, with the upper–lower boundary around 423X – 428X (personal expectation).
🟢 Key Support Zones
• 4280 – 4282
• 4264 – 4266
• 4255 – 4257
• Deeper support: 424X
🔴 Key Resistance Zones
• 4330 – 4336
• 4347 – 4351 (±4353)
Good day, traders 🤝

This Stupid Simple Strategy will help you become a better traderI make educational content videos for swing trading
Charts used are 3 months or older .

GOLD broke out of the H4 trendline — real breakout or trap? Hello Traders! 👋
Gold has broken out of the H4 descending trendline, boosted by geopolitical tension and a weaker USD.
But the real question is: Is this a true breakout or just FOMO before a drop?
Here are the key zones I’ll be watching today:
BUY Zones (SL 10 – TP 10)
• 4165 – 4155
• 4170 – 4175
• 4140 – 4145
• 4110-4108
• 4099-4096
SELL Reaction Zones (SL 10 – TP 10)
• 4200 – 4203
• 4212 – 4215
• 4230-4035
• 4245 – 4247
👉 If price breaks below 4133, the trendline fails → potential sell-continuation setup.
📌 Bias: BUY is the main play — SELL only for short reaction scalps.
💬 What do YOU think — real breakout or classic bull trap? Drop your thoughts below!
❤️ Let’s discuss & grow together!

ETH - 2 hour chart - Trend based Fibonacci Retracement Price took strong support from the green demand zone and bounced, starting a fresh upward move. This rally reached the Fibonacci 0.618–0.786 zone, where price faced resistance and started a pullback. During this pullback, a falling trendline formed, showing short-term selling pressure. Now price is moving between the 0.236 and 0.382 Fibonacci levels and is again testing the trendline from below. If price gives a clean breakout above this falling trendline and holds, it can continue its upward move toward higher Fibonacci levels. If the breakout fails, price may retest lower Fibonacci areas or even move back toward the support zone.
Entry: Buy on trendline breakout and retest around 3530–3550
Stop Loss: Below recent swing and Fibonacci 0.236 zone around 3450–3470
Targets:
• First target near 0.382 zone around 3600
• Second target near 0.5 zone around 3680
• Final target near 0.618–0.786 zone around 3750–3850
Disclaimer: This analysis is for educational purposes only and not financial advice. Always do your own research before trading or investing.

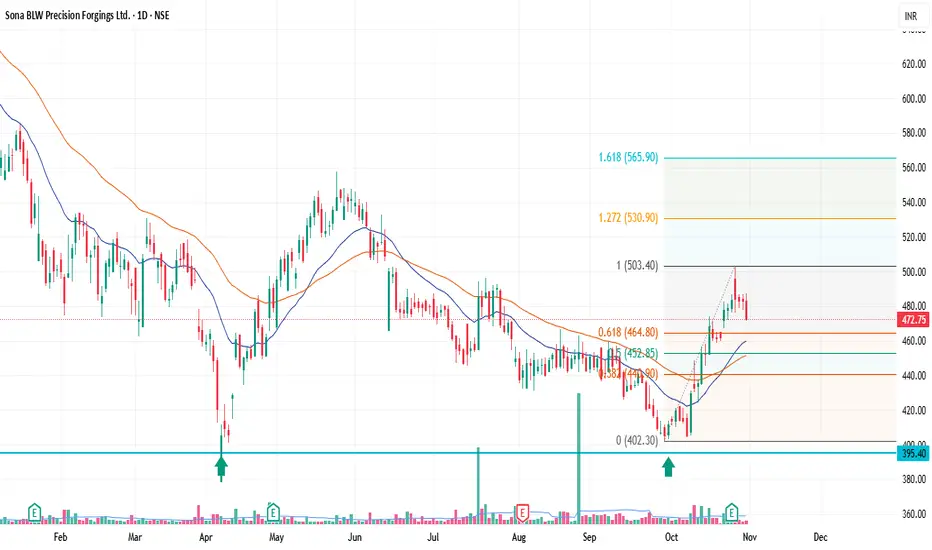
Sona BLW Precision Forgings Ltd. (SONACOMS) — pullback setup(SONACOMS) — Bullish Pullback Setup
📅 Timeframe: 1D | 💰 CMP: ₹472.75 | 📈 Volume: Above average
Technical View
Sona BLW has completed a strong impulse wave from ₹402 → ₹503, followed by a healthy pullback.
Price is now retracing near the 0.618 Fib level (₹464.8), aligning with the 21EMA — a zone that often acts as support during trend continuation.
Volume on the breakout was strong, showing accumulation interest.
Trade Plan
Entry Zone: ₹465–₹470
Stop Loss: ₹450 (below 0.5 Fib and 20EMA)
Targets:
🎯 T1: ₹503
🎯 T2: ₹530 (Fib 1.272)
🎯 T3: ₹566 (Fib 1.618)
Summary
✅ Uptrend resumption likely if ₹450 holds
✅ Rising 21EMA & 50EMA support the structure
✅ Strong breakout volume confirms institutional buying
Bias: Bullish
Risk–Reward: ~1:2.5+
Invalidation: Close below ₹450
Disclaimer : Risk management is crucial in this volatile market, so keep position sizing appropriate. This analysis is intended for educational purposes and not financial advice.
GOLD | Is This the FINAL Short Setup Before the Next Move? Welcome Traders!
Forget the noise — focus on structure and sentiment. Gold is holding firm near $3,950, but the macro backdrop just got tighter.
The question now: Can demand strength beat Powell’s new hawkish tone?
1. Market Insight – Powell vs. Demand
Two forces are pulling Gold in opposite directions:
🐻 Bearish Catalyst:
Powell hinted that another rate cut in December is unlikely, and the Fed plans to continue balance sheet reduction — strengthening the USD and weighing on non-yielding assets like Gold.
🐂 Bullish Support:
Persistent central bank demand and ETF inflows continue to provide a safety net, tightening overall Gold supply.
🎯 Outlook:
Expect sideways compression before a potential breakout. We’re stalking the strategic Sell Zone to align with the bearish fundamentals.
📊 2. Structure Check – Where Bears Wait
The market is approaching a major confluence zone:
SELL LIMIT Zone: $4,057 — intersection of the descending trendline and key horizontal resistance.
Immediate Support: $4,005 — target for the first leg down.
3. Action Plan – The Short Sniper Setup
Entry: SELL LIMIT $4,057
Stop-Loss: just above the descending trendline
TP1: $4,005 (short-term support retest)
Extended Target: $3,938 if breakdown accelerat
Powell’s hawkish tone is clear — but will bears finally take control from $4,057$, or will central bank demand defend the rally?

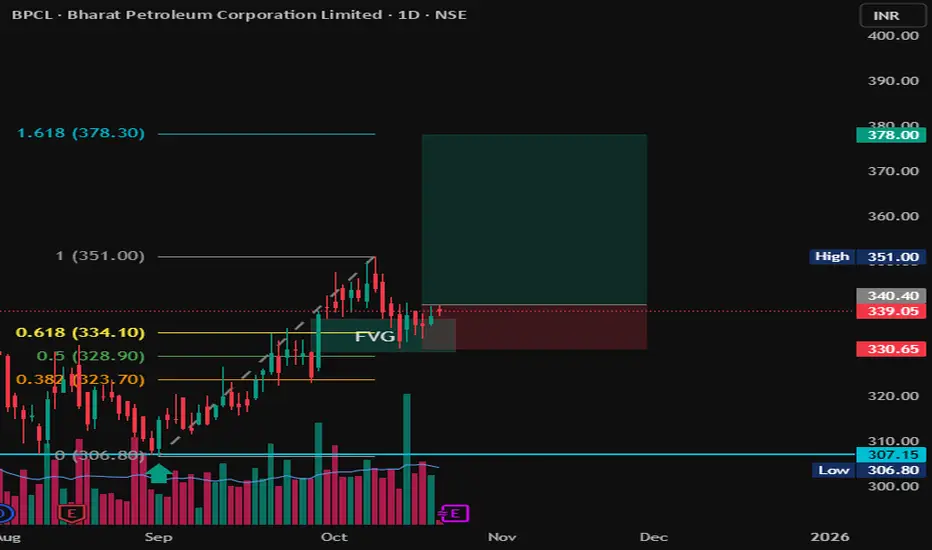
BPCL | FVG + Fibonacci COnfluence | Long Setup toward 378 💬 Description:
Chart Type: 1D (Daily)
Stock: BPCL – Bharat Petroleum Corporation Ltd.
🧩 Setup Overview
BPCL has completed a clean retracement into a Fair Value Gap (FVG) aligning with the 0.5–0.618 Fibonacci retracement zone from the previous upswing (306 → 351).
The zone around ₹334–₹340 acted as strong demand support, hinting at a possible continuation leg to the upside.
📊 Trade Plan
Entry Zone: ₹338–₹340
Stop Loss: ₹330
Target 1: ₹351
Target 2: ₹378 (1.618 Fib Extension)
Risk–Reward Ratio: ~1:3
📈 Technical Confluence
✅ FVG + 0.618 Fib alignment
✅ Retest & bounce confirmation
✅ Volume showing accumulation
✅ Clear higher-low structure maintained
🚨 Invalidation
Setup invalid if price closes below ₹330, which would break FVG and shift structure to bearish.
🧠 Bias: Bullish continuation
Time Horizon: Swing (2–4 weeks)
GOLD (XAU/USD) — Calm Before the FOMC Storm Gold is currently consolidating above $3,950, signaling a pause in volatility as traders await the FOMC decision for the next directional move.
1️⃣ Macro Outlook & Core Bias – FOMC in Focus 🔑
Market Pause: After rebounding during the Asian session, Gold’s upside momentum remains limited. Market participants are cautious ahead of the Fed’s policy update.
Headwinds: Renewed optimism on US–China trade and a slightly stronger USD are capping Gold’s advances.
Game Plan: Stay tactical — identify scalp zones and prepare for a major breakout once the FOMC event unfolds.
2️⃣ Technical Setup – Descending Channel in Play 📉
Structure: Price action is holding above $3,950, but movement remains confined within a descending channel/flag.
Bias: Short-term demand persists, yet the broader structure still favors bears.
Preferred Setup: Watch for BUY scalps from lower demand zones toward the Fibo/channel resistance area.
3️⃣ Trading Plan – Precision & Patience 💰
🟩 BUY Scenario (Long Scalp)
Buy Zone: $3,939.468
Strategy: Look for long scalps targeting the Fibo 0.5 resistance.
Stop-Loss: Tight SL just below the $3,939 level.
🟥 SELL Scenario (Short Setup)
Scalp Sell Zone: $4,015.646 (Fibo 0.5)
→ Short scalps targeting a retest of the channel midline.
Main Sell Zone: $4,046.448 (Fibo 0.618 / Channel Ceiling)
→ Ideal entry for a continuation short, aligning with the overall bearish channel.
4️⃣ Trader’s Take 🚀
The FOMC decision will set the tone —
Are you eyeing a bounce from $3,939, or waiting for the $4,046 rejection to ride the next wave down?

$4,005 BROKEN! GOLD READY FOR CPI COLLAPSEFranCi$$_FiboMatrix Emergency Action Plan (H1 Focus)
Welcome Traders! Gold (XAU/USD) has attracted sellers and is now trading below $4,100. With the US CPI release looming, the DOWNSIDE BREAKDOWN is our highest conviction scenario!
1. Market Snapshot
Current State: Gold is consolidating in a Sideway Zone between $4,159 (Resistance) and $4,005 (Critical Support).
Pressure: The recent break below $4,100$ and the recovering USD are key bearish factors.
The Catalyst: US CPI today. A hot inflation print will fuel the USD and shatter the $4,005$ floor.
Dominant Risk: Break below $4,005.438$ confirms the major bearish trend targeting $3,889$.
2. MAIN TRADING PLAN: Breakdown Scenario (SHORT) 💰
We are setting the trap to execute the SELL trade immediately upon the decisive breach of the $4,005$ Support.
Activate SHORT: Breakdown below $4,005.438$. (Wait for H1 close confirmation).
STOP-LOSS (SL): $4,159.686$. Placed safely above the Sideway Resistance.
TAKE-PROFIT 1 (TP1): $3,938.128 (Fibo Target).
TAKE-PROFIT 2 (TP2): $3,889.330 (Ultimate Structural Target).
3. Contingency Scenario (LONG) ⬆️
Activate LONG: Only if Gold decisively breaks $4,159.686$ (Breakout Zone) and targets $4,237.334.
Note: High-risk counter-trend trade, likely requiring a major negative surprise from the CPI report.
Community Interaction 🚀
The CPI is coming! Will the data be hot enough to smash $4,005$? Or is the Sideway Zone here to stay?
Drop your priority scenario NOW! 👇

GOLD RECOVERS: H1 Bounces at $4,150 – Sniping the Fibo SELL Zone🎯 Macro Summary & Bias: Weak USD & CPI Focus Drive Recovery
Gold price gained some traction in early European trading on Wednesday, recovering above the $4,150 level.
Primary Driver: The weaker US Dollar (USD) is currently supporting the price recovery.
Mixed Forces: Easing US-China trade tensions are putting some pressure on Gold, but this is offset by Fed rate cut expectations and general market uncertainty, which should limit the downside.
Key Event: Traders are keenly focused on the US CPI (Consumer Price Index) inflation report for September this Friday. Any sign of hotter-than-expected US inflation could lift the USD and pressure Gold in the short term.
Technical Bias: After the DOUBLE TOP DUMP and a +3000 PIPS move down, the market is now attempting a corrective rally. Our strategy is to SELL the strong Fibo/Volume resistance (Sell on Rally) before looking for the next BUY zone.
📊 In-Depth Technical Analysis (H1): Pinpointing the FIBO Reaction Levels
Based on the recent major market reversal from the Double Top and the current corrective bounce (Referencing image_43ce7f.png), we have our strategic levels:
1. Strategic SELL Zones (FIBO SELL REACT ZONES):
These are the primary resistance zones for executing SELL trades, anticipating the continuation of the post-dump correction:
REACTION FIBO 0.5 ZONE - SELL ZONE 4190 - 4200: This is the first critical resistance zone (0.5 Fibo retracement) to look for a Short entry.
REACTION FIBO - SELL ZONE BIG VOLUME for SELL SIDE 4300 - 4310: This is the major supply/liquidity zone and the ultimate target for the current corrective rally.
2. Strategic BUY Zone (ORDER BUY REACT ZONE):
This is the key support area where the previous dump found temporary relief, which we use for stop-loss or potential re-entry:
ORDER BUY ZONE 4100 - 4090: This is the immediate support zone formed after the dump, which is currently holding the price.
📈 TODAY'S ACTION PLAN
Primary Action (Prioritize SELL on Rally): Wait for the corrective bounce to reach the REACTION FIBO 0.5 ZONE - SELL ZONE 4190 - 4200.
Short Entry: Execute the SELL entry upon confirmed reversal candles (H1/M30/M15) in the 4190 - 4200 zone.
Targets (TP): Aim to retest the recent low and the LIQUIDITY PUMP area.
Contingency BUY: If price breaks decisively above 4200, the rally may extend to the BIG VOLUME SELL ZONE 4300 - 4310.
⚠️ Risk Warning
Risk Management: Place Stop Loss (SL) above the 4200 zone for the short entry. Watch the US CPI report on Friday closely, as inflation data could cause extreme volatility.
Wishing all FranCi$$_FiboMatrix traders a disciplined and victorious day!

GOLD Accumulates Above $4200 Which Fibo React Zone Fires First ?🎯 Macro Summary & Bias: The Calm Before the Geopolitical Storm
Gold is trading above the psychological $4,200 mark but struggled to gain meaningful traction on Monday due to mixed forces.
Driving Forces: Increased geopolitical tensions and trade uncertainty act as tailwinds for the safe-haven asset.
USD Weakness: Expectations for more Fed rate cuts and the US government shutdown weaken the USD, providing support for XAU/USD. Traders have fully priced in two more rate cuts this year, which continues to pressure the US Dollar.
Technical Outlook: Gold is currently consolidating above $4,200, signaling that the bullish structure remains intact. We are now watching for confirmation at key Fibo levels before the next breakout.
📊 In-Depth Technical Analysis (H1): Pinpointing the FIBO Reaction Levels
Our core strategy is to BUY ON DIPS at the identified Fibo Reaction Zones and look for short-term Sells only as resistance tests (Referencing image_58f686.png).
1. Strategic BUY Zones (FIBO BUY REACT ZONE):
These are the crucial support zones for initiating Long entries:
Reaction Fibo Buy Zone 4230 - 422x. This is the immediate, primary support zone where we anticipate the first bounce.
Big Volume For The BUY Side 4205 - 4200. This is the major demand zone and the ultimate pullback point to catch the large growth wave.
2. Strategic SELL Zones (FIBO SELL REACT ZONES):
These are high-volume resistance areas for potential Take Profit (TP) or short-term Scalp Sells:
Reaction Fibo Sell Zone 4280 - 4285. The first key resistance level where the price may encounter selling pressure.
Reaction Fibo Sell Zone 4315 - 4320. The next significant resistance and TP level.
Big Volume For The Sell Side 4356 - 4360. The major supply and long-term TP target.
📈 TODAY'S ACTION PLAN
Primary Action (Prioritize CHỜ ĐỢI BUY): The market is consolidating. Do NOT FOMO. Patiently wait for the price to correct to the Reaction Fibo Buy Zone 4230 - 422x.
Long Entry: Upon confirmation (H1/M30/M15 reversal candles) at the BUY Zones, confidently activate the Long (BUY) entry.
Targets (TP): Aim for the successive SELL Zones: 428x, 431x, and the ultimate target at 4356 - 4360.
⚠️ Risk Warning
Risk Management: Always place a safe Stop Loss (SL) below the nearest active BUY ZONE. Monitor trade talks closely as they could trigger sharp volatility.
Wishing all FranCi$$_FiboMatrix traders a disciplined and victorious week!

Fibo BUY Zone Mandatory for Trend Continuation.🎯 Macro Summary & Bias: The Bulls Are Unstoppable!
Gold is the most sought-after asset as XAU/USD aims directly for the $4,300 mark and further.
Primary Catalyst: Financial markets remain cautious amidst the ongoing US government shutdown.
Driving Force: Widespread USD weakness—fueled by the funding battle in the US government—strengthens the bullish case for Gold.
Record Strength: XAU/USD is maintaining positive upward momentum despite extreme overbought conditions.
Technical Focus: In this continuous Bull market, FIBO is the paramount tool for identifying the critical pullback points to initiate BUY entries.
📊 In-Depth Technical Analysis (H1): Pinpointing the FIBO Reaction Levels
Our core strategy remains BUY ON DIPS at the most precise Fibo levels, leveraging the strong Parabolic structure.
1. Strategic BUY Zone (FIBO BUY REACT ZONE):
This is the most crucial Fibo support zone where we anticipate a high-probability pullback:
4,321.332 The REACTION FIBO BUY ZONE 0.5.
This is the most vital retracement point to catch the next growth wave.
2. Sell/Take-Profit Targets (FIBO SELL TARGETS):
These are the Fibo extension targets where the Longs are aiming:
TP Target 1 (Extension) 4,436.179 The REACTION FIBO SELL ZONE 1.5 - 1.618. The next immediate target for the rally.
TP Target 2 (Deep Extension) 4,538.394 The REACTION FIBO SELL ZONE 2.5 - 2.618. The long-term target if momentum remains unchecked.
📈 TODAY'S ACTION PLAN
Primary Action (Prioritize BUY): Patiently wait for the price to correct to the REACTION FIBO BUY ZONE 0.5 at 4,321.332.
Upon confirmation (H1/M30/M15 reversal candles), confidently activate the Long (BUY) entry.
Targets (TP): Aim for TP Target 1 (4,436.179) and further to TP Target 2 (4,538.394).
⚠️ Risk Warning
Risk Warning: Given the extreme overbought conditions, always place a safe Stop Loss (SL) below the Fibo BUY ZONE and maintain stringent risk management!
Wishing all FranCi$$_FiboMatrix traders a disciplined and victorious day!

GOLD AT ATH! $4,200 BATTLE – Which Fibo Zone Fires First?Gold is fiercely battling the $4,200 mark after hitting a new All-Time High near $4,220. Bulls are pausing, but macro risks (geopolitics, trade war warnings) keep the trend Long. Our focus: Sniping the Reaction Zones.
🎯 THE FIBO ACTION ZONES (H1/M30)
1. STRATEGIC BUY ZONE (Optimal Long Entry):
Zone 1: 4162 - 4158 (The crucial Fibo Retest/0.618 support).
Zone 2: 4144 - 4140 (Deeper strong support).
Action: Wait for the pullback into 4162 - 4158 and execute a BUY upon bullish confirmation.
2. SELL/TP ZONES (Profit Taking & Resistance):
TP Target 1: 4208 - 4212 (Immediate Fibo Resistance).
TP Target 2: 4225 - 4250 (Fibo Extension 1.5 - 1.618).
Action: Look for SCALP SELL opportunities or take profits (TP) here if price rejects these levels.
📈 TODAY'S MOVE: Patience for the 416x retest. Join the Long trend aggressively only after a solid bounce confirmation!
⚠️ Risk Management: Keep SL tight below your chosen BUY Zone. Discipline over FOMO!

GOLD CRASH ALERT: +60 PRICES DUMP! Waiting for the Ultimate Fibo React BUY Zone.
FranCi$$_FiboMatrix Emergency Action Plan
Gold just suffered a brutal 60-point plunge from 416x to 411x, triggered by mounting geopolitical tensions. The market is volatile, and deep correction is highly likely. We must trade smart, not emotionally.
🎯 EMERGENCY ACTION ZONES (H1/M30)
Avoid chasing! We only trade when price hits our calculated FIBO REACTION ZONES.
1. SCALP SELL RETRACEMENT:
Zone 1 (High): Watch the 407x area (4,077.605).
Zone 2 (Key Fibo Resistance): The 405x area (4,048.493).
Action: If price bounces back into either zone, look for strong bearish rejection to execute a SCALP SELL.
2. CRITICAL BUY REACT ZONE (The Lifeline):
Zone: We are waiting for the AD's updated FIBO REACTION zones that conform to the new deep trend.
Action: DO NOT BUY BLINDLY. Only enter a Long when the price reaches these deeper support levels and gives a strong, confirmed BUY REACT signal.
⚠️ Immediate Focus: OBSERVE & WAIT. The AD will provide continuous updates. Manage risk strictly—this volatility demands discipline!

Sniping the Next BUY Zone for Maximum Gains.The sentiment is clear: Bulls are running the show, preparing for potentially an eighth consecutive weekly gain. Our strategy is simple—wait for the intelligent retest to join the momentum.
🎯 THE TARGET ZONES (M30/H1)
We're focusing on the two most crucial zones derived from Fibo React Logic:
1. PRIME BUY ENTRY (The Sweet Spot):
Zone: 4018 - 4014 (Our key Fibo Retest Zone).
Action: Wait for Gold to pull back to this area. Execute a BUY (Long) only upon confirmed M30/H1 candle rejection (e.g., Bullish Engulfing/Pin Bar).
2. TAKE PROFIT TARGET (The Next Peak):
Zone: 4094 - 4098 (Fibo Extension/SELL React Zone).
Action: This is the primary TP for our Long entries, representing the next major target for the buyers.
📈 TRADING SCENARIO
Strategy: Patience is key. Let the market retrace to 4018 - 4014. Once confirmation hits, ride the wave up to 4094 - 4098.
🚨 Risk Alert:
Be disciplined with your Stop Loss. Maintain strict risk management, especially if the price fails to hold the 4018 - 4014 zone.
Let's trade with precision today!

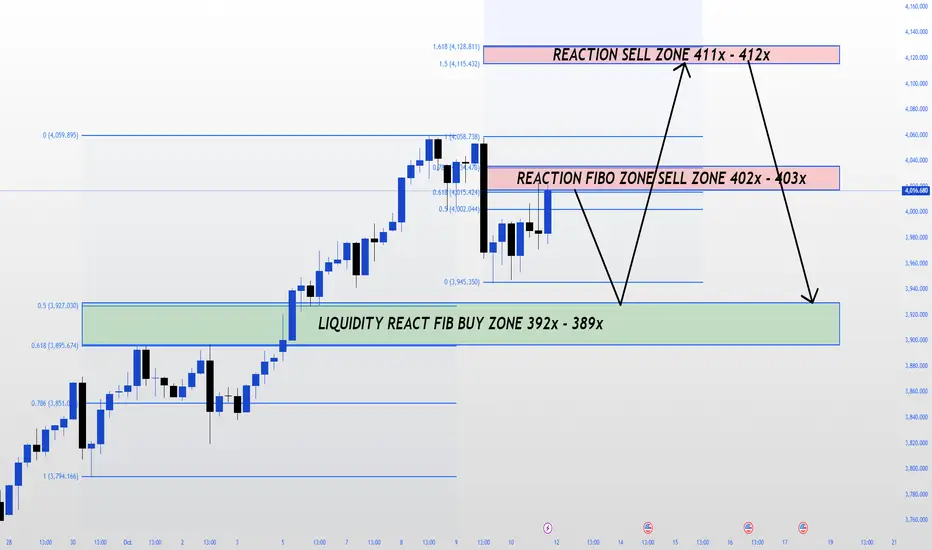
$4,000 RECLAIMED! Targeting Fibo Extremes on H4.The big picture is clear: Gold has strongly pushed past the $4,000 mark, driven by major safe-haven demand amidst US-China tensions. Buyers are pushing for an eighth straight weekly gain!
But where are the high-probability zones?
🔑 THE FRANCI$$_FIBOMATRIX PLAN (H4)
We're keying in on two critical Fibo Reaction Zones for the perfect entry:
1. SELL ZONE (Correction/Reversal Focus):
Zone 1 (FIBO): 402x - 403x (4,025.424 - 4,032.844). Action: Look for H1/H4 candle rejection here to initiate a corrective short trade.
Zone 2 (Extension): 411x - 412x (4,115.422 - 4,128.811). Action: The ultimate target if momentum holds; watch this for the major supply zone.
2. BUY ZONE (Trend Continuation):
The Sweet Spot: 392x - 389x (3,907.030 - 3,895.674). This is our key Liquidity React Fibo Buy Zone. Action: Wait for the deep pullback here, confirm with bullish signals, and join the main trend with a target back to the 402x/411x range.
🚨 Critical Risk Alert:
A decisive weekly close below $3,962 signals a high risk of deep correction towards $3,900. Manage your Longs tightly below this level!
GOLD: The Dollar Blinks! Time to 'Pay' at the 0.618 Fibo (4018) The Macro Play: USD Retreat Sets the Stage for Gold's Counter-Attack
The precious metal is catching a bid as the US Dollar softens after hitting its recent highs. The fundamental backdrop is keeping Gold buoyant:
Fed Pivot Narrative: Despite the hawkish undertones in the last FOMC meeting minutes, the market's conviction in two potential Fed rate cuts by year-end remains a powerful tailwind, making non-yielding Gold more attractive.
Geopolitical Fog: While the short-term truce news caused a minor retreat, the overarching safe-haven demand driven by global tensions and the looming US government funding crisis provides critical floor support.
Bottom Line: Gold is navigating a choppy consolidation phase. Short-term pressure exists, but the Long-Term Macro Thesis favors a cautious recovery.
📊 The MatrixFibo PTKT: SCALP Zones Are Active!
Price action shows clear reaction points within the recent sharp move lower. Our plan is to Trade the Reactions at these high-probability confluence zones.
1️⃣ The Aggressive SELL Zone (SELL SCALP Setup)
We are looking for the market to exhaust its short-term recovery rally at major resistance levels.
Primary SELL ZONE: 3997 - 4000 (0.5 Fibo Level):
This area is critical psychological resistance and the 50% retracement of the latest impulse down.
PLAN: Await a failed breakout or clear bearish rejection signal (Pinbar, Bearish Engulfing) at 3997 - 4000.
TARGET: The move should aim to clear the lows, heading straight for 3915 - 3910.
The Ultimate SELL Reversal: 4014 - 4018 (0.618 Fibo Downtrend Zone):
This is the REACTION FIBO 0.618 DOWNTREND H1 ZONE. This level is our strongest strategic SELL point if the bounce extends deeper.
2️⃣ The Key BUY Zone (BUY SCALP Setup)
We treat this area as the final line of defense for the current uptrend structure.
Key Support & BUY SCALP REACT ZONE: 3915 - 3910:
This zone is a Major Confluence point: Key Support, the 0.786 Fibo, and the Uptrend Channel Bottom.
PLAN: Look for strong buying pressure to emerge as price tests 3915 - 3910. Requires a solid Bullish Price Action Confirmation.
TARGET: A successful bounce targets the liquidity back at 3997 - 4000.
🛑 FranCis MatrixFibo Risk Policy
Volatility Alert: Expect large swings around US data and Fed commentary. NEVER TRADE WITHOUT A HARD STOP LOSS (SL) on SCALPS.
Strategy Focus: The market is range-bound. Stick to a Two-Sided Scalping Plan defined by the identified price levels.
Discipline: Only enter trades at or with clear confirmation from the React Zones.

GOLD UPDATE – Bulls Defend $4,000 Ahead of Powell’s SpeechGold continues to hold firm above the key $4,000 psychological level, even after a sharp correction from the all-time high near $4,059. The market’s focus now shifts to Fed Chair Jerome Powell’s speech, which could set the tone for the next directional move.
Despite the recent dip, the overall structure remains bullish, and the FiboMatrix setup still signals that buyers are not out of the game yet.
Technical Structure (H1 – FiboMatrix View)
Support Zone (BUY Setup):
4010 – 4012 → Retest of breakout trendline + Fibo 0.618 reaction zone.
Strong intraday base where liquidity may reload for another bullish leg.
Reaction Buy Zone:
402x → Potential confirmation area if price reacts positively.
Resistance Zone (ATH):
4060 → Previous intraday top, acting as the first major barrier before retesting 408x.
SELL Reaction Zone:
4084 – 4086 → Fibo 1.5 – 1.618 expansion zone, potential scalp short zone with tight stop above 4090.
🎯 Trading Plan (Francis Strategy)
✅ BUY Setup:
Entry: 4010 – 402x (wait for confirmation).
TP1: 4060
TP2: 4084
SL: Below 3996
⚠️ SELL Setup (Short-term scalp):
Entry: 4084 – 4086 (if rejection forms).
Target: 4040 → 4020
SL: Above 4096
🔑 Francis Outlook
Gold’s short-term correction looks more like a controlled retracement than a trend reversal.
As long as the price holds above the $4,000 handle, the bullish bias stays intact.
👉 Expect potential consolidation before Powell’s remarks, followed by a sharp reaction depending on the tone of his speech.
A clean breakout above 4060 – 4086 will open the path toward $4,100+ and new ATH targets.
🚀 Trend Bias: Bullish above 4010 – Buy the Dip, Sell only at Fibo extremes with confirmation.

GOLD XAU/USD – Intraday Plan | Bulls Targeting 4,000$Gold has once again proven its safe-haven dominance, pushing close to 3,980$ during the Asian session. Despite USD fluctuations and global market risk-on vibes, buyers remain firmly in control. The psychological milestone of 4,000$ is now directly in focus.
🔎 Technical Snapshot (M30)
Trend remains bullish, supported by the Fibo channel.
Dip-buying pressure continues to dominate intraday price action.
Sellers will only gain short-term control near the 3988 – 4000$ resistance zone.
🔑 Key Trading Levels
BUY Zone (Fibo 0.618): 395x → Ideal intraday demand.
Support Zone: 393x → Must hold for bullish structure.
Immediate Resistance: 397x → Current ATH zone.
SELL Reaction Zone: 3988 – 4000$ → Potential short scalp.
Major Resistance: 4000 – 4006$ → Strong psychological wall.
📌 Trading Plan (FranCi$$ Style)
✅ BUY on Dips
Entry: 395x – 393x
Targets: 3975 → 3988 → 4000$
Stop Loss: Below 392x
⚡ SELL Scalp
Entry: 3988 – 4000$
Targets: 3970 → 3950$
Stop Loss: Above 4015$
🎯 Final Take
Gold’s path remains upward, but the 4000$ barrier is where bulls meet the biggest challenge. Smart traders will look to buy dips for continuation and use scalp sells only at strong rejection zones.
🔥 Stay tuned with FranCi$$ for realtime intraday updates – precision signals, scalping setups, and golden opportunities!

Fibonacci Tool: Why It’s NOT a Trading StrategyMost traders wrongly treat Fibonacci as a standalone strategy—it’s just a support tool, not a secret pattern for auto profits. Discover how real pros use it for bias, not blind buys, and avoid the retail trap

Gold Outlook: Eyeing $4,000 – Fibo Expansion Zones in PlayGold continues to benefit from safe-haven demand as political risks in Washington and mixed U.S. data keep investors cautious. The metal is trading inside a clear bullish channel, with Fibonacci projections suggesting further upside before any major correction.
📊 Technical Deep Dive – H4 Structure
🔹 Fibonacci Confluence
The current rally respects 0.618 retracement at $3,820 and 0.786 retracement near $3,872, confirming algorithmic order flow.
Next expansion points are sitting at Fibo 1.5 – 1.618 ($3,995 – $4,003), a major liquidity target where reactions are likely.
🔹 Liquidity Pockets
$3,820 – $3,828: Historical demand block + Fibo 0.618, strong buy reaction zone.
$3,860 – $3,872: Active reaction layer, intraday support if retested.
$3,995 – $4,003: Key sell reaction zone, a liquidity grab area before possible retracement.
🔹 Candle & Flow
Breakout candles show strong momentum, pushing price toward untested liquidity.
However, multiple tests of $3,895 signal distribution pressure ahead of the $4,000 test.
🎯 Trade Playbook
🟢 Bullish Setup (Main Play)
Entry: $3,860 – $3,872
Targets: $3,895 → $3,995 → $4,003
Stop: Below $3,850
🔵 Deep Buy Setup (Aggressive)
Entry: $3,820 – $3,828
Targets: $3,872 → $3,895
Stop: Below $3,808
🔴 Countertrend Short (Scalp)
Entry: $3,995 – $4,003
Targets: $3,970 → $3,950
Stop: Above $4,010
⚡ Key Insights
Watch for a $4,000 liquidity sweep – could trigger either breakout continuation or sharp pullback.
If $3,860 support fails, deeper correction into $3,820 is expected before next rally.
H4 close above $3,895 strengthens bullish bias toward $4,003+.
📌 Question for traders: Will Gold break $4,000 and run, or is this a setup for a liquidity trap before correction? Share your view 👇

Gold Trading Plan | Limited Downside, Key Fibo Zones in Play🌍 Market Context
Gold is facing renewed selling pressure after yesterday’s bounce from the $3,820 area.
Risk-on sentiment and fresh USD buying are weighing on XAU/USD.
However, expectations of Fed rate cuts later this year and geopolitical tensions remain supportive, limiting deeper downside moves.
📊 Technical Analysis – Fibo Matrix Setup
🔴 SELL Reaction Zones
386x – 388x (Fibo retracement 0.5 – 0.618 + 0.786 confluence)
→ Intraday SELL scalp zone with strong rejection probability.
3881 – 3892 (Fibo 1.5 – 1.618 downtrend extension)
→ Key SELL liquidity zone for deeper rejection.
🟢 BUY Support Zones
3820 – 3819 (short-term recovery base) → Initial intraday support.
3795 – 3793 (Fibo 1.5 – 1.618 recovery zone) → Major liquidity pocket, ideal for BUY setups if tested.
🎯 Trading Scenarios
1️⃣ SELL Setup
Entry: 386x – 388x (watch rejection candlesticks).
Target: 3820 → 3795.
Stop Loss: Above 3892.
2️⃣ BUY Setup
Entry: 3795 – 3793 with bullish confirmation.
Target: 3860 → 3880.
Stop Loss: Below 3785.
⚡ Key Notes
USD momentum is crucial – if dollar strength continues, Gold may retest 379x zones.
Fed’s rate cut outlook and geopolitical headlines remain the “floor” for Gold.
Stick to clear Fibo reaction zones for best risk-to-reward setups.
💬 Community Insight:
Do you expect Gold to hold 3820 before bouncing, or will we see a flush into 379x liquidity?
Drop your setups below 👇
