XAUUSD Daily Plan – Gold’s Pullback Before the Next Leg Higher📊 Market Overview
Gold has pulled back from its fresh record highs but the move looks more like healthy accumulation than a reversal. The 3,800 zone has acted as a strong support, absorbing selling pressure and keeping the broader bullish trend intact. Immediate rebounds confirm that buyers are still in control, preparing for the next breakout.
📍 Key Levels to Watch
🔴 SELL Reaction Zone
3,871 – 3,872 → First resistance level, possible short-term rejection.
3,915 – 3,920 (Fibo Liquidity Zone) → Stronger sell wall where profit-taking may appear.
🟢 BUY Zones
3,808 – 3,810 (Fibo 0.786 Support) → Important reaction zone for intraday buy setups.
3,747 – 3,752 (Fibo Liquidity Buy Zone) → Deep correction level, strong long-term demand area.
🎯 Trading Scenarios
1️⃣ Bullish Continuation Setup
Entry: Buy near 3,808 – 3,810 on bullish candlestick confirmation.
Targets: 3,871 → 3,900+
Stop: Below 3,795
2️⃣ Deep Pullback Opportunity
Entry: 3,747 – 3,752 if price flushes lower.
Targets: 3,808 → 3,871
Stop: Below 3,735
3️⃣ Countertrend SELL Setup
Entry: 3,915 – 3,920 only with strong rejection.
Targets: 3,871 → 3,808
Stop: Above 3,928
⚡ Trading Notes
Gold remains in a strong bullish channel – selling should only be tactical and short-term.
Watch US political headlines and end-of-month flows, as they could trigger volatility.
Stick to defined Fibo zones for best risk-to-reward setups.
💬 Community Discussion
Do you think Gold will test 3,900+ this week or will we see a deeper correction first? Share your charts and ideas below 👇
Fibonnacci

XAUUSD – Gold Daily Plan | Sharp Drop, What’s Next?Gold printed a sudden 70+ point drop from 388x to 380x, leaving traders questioning:
– Was this a big player manipulation?
– Or simply institutional profit taking?
Key reaction zones will define if Gold holds above 3800 or dives deeper.
📍 Critical Levels
🔴 SELL Reaction Zone
387x → Strong resistance where sellers may step in.
🟢 BUY Zones
3780 (Retest Breakout + Trendline) → First demand zone.
375x (Fibo Support Zone) → Strong liquidity pocket, potential reversal.
🎯 Trading Scenarios
1️⃣ SELL Idea
Entry: 387x
Targets: 3800 → 3780
SL: Above 3888
2️⃣ BUY Idea
Entry: 3780 – 375x
Targets: 3838 → 387x
SL: Below 3745
⚡ Trading Notes
High volatility expected near 3800 psychological mark.
Stick to zone trading – avoid mid-range traps.
Monitor USD strength; any spike could pressure XAU further.
💬 Discussion
Do you think Gold will break below 3800 or bounce back to test 387x? Drop your views 👇

Gold Bulls in Control: Buy Zones Lined Up for the Breakout!📊 Market Context
Gold is trading near record highs around $3,850, heading toward its best month in 14 years. With Q3 2025 and September closing, gold has surged nearly 12% this month, driven by rising safe-haven demand amid the looming U.S. government shutdown and weaker USD sentiment.
The bullish structure remains intact, and dips continue to attract aggressive buyers.
📍 Key Trading Levels
🟢 BUY Zones
3846 – 3843 → Intraday BUY scalp zone
SL: 3836
TP: 1R → 2R → 3R → 4R (hold longer if above 389x)
3818 – 3816 → Deeper reaction BUY zone
SL: 3810
TP: 1R → 2R → 3R → 4R (limit orders can be set for extended swing positions)
🔴 SELL Reaction Zone
Around 387x → Expect heavy profit-taking and short-term pullbacks.
🎯 Trade Plan
Prioritize BUY setups only; gold remains in strong bullish momentum.
Use the 384x zone for scalps and 381x zone for deeper limit buys.
Trail stops once price breaks 389x, opening room for 3920+ targets.
⚡ Trading Notes
Volatility may spike with U.S. political risks – manage positions carefully.
Avoid chasing highs; wait for structured retracements to BUY zones.
Stick to R/R discipline; market rewards patience in strong trends.
💬 Community Insight
Do you think gold will smash through 3920+ this week, or will we get another retracement first? Drop your setups and let’s compare strategies 👇

XAUUSD – Gold Bulls Eye New Highs | Francis FiboMatrix Plan📊 Market Outlook
Gold keeps climbing with momentum, now approaching the 3,800$ zone. The market is fuelled by expectations of more Fed rate cuts and rising demand for safe-haven assets as global uncertainties stay elevated.
Silver is also breaking higher, heading toward its historic $50 target, confirming the broader strength in precious metals.
📍 Trading Levels
✅ BUY Zone: 3782 – 3780
🛑 Stop Loss: 3772
🎯 Take Profits:
TP1 → 3800
TP2 → 3829
TP3 → 3848
TP4 → 3885+ (long-term hold if 377x holds support)
⚡ Trading Plan
Only look for BUY setups on dips – no shorting in this phase.
Keep position sizing balanced; trail stops once price moves past 3829.
Bias remains bullish as long as gold holds above 377x support.
💡 Francis Note
This is not just a trade – it’s part of the bigger wave. Play the retracements smart, respect risk, and let the trend do the heavy lifting.
💬 Your View?
Is gold ready to break beyond 3,885 → 3,900, or will we get a quick pullback first? Drop your charts and setups below 👇

XAUUSD – FIBO MATRIX Trading Plan | Key Levels for TodayMarket Snapshot
Gold is attracting steady buying interest as dovish Fed expectations keep the USD capped near 3-week highs.
At the same time, geopolitical tensions and tariff concerns add to safe-haven demand.
Focus now shifts to US PCE inflation data, which could trigger the next big move.
📍 Important Price Zones (M30)
🔴 SELL Reaction Zones
3767 – 377x → Major rejection area (Fibo 0.786).
3810 – 3817 → Strong SELL zone (Fibo 1.5 – 1.618).
🟢 BUY Support Zones
3725 → First support zone.
3690 – 3695 → Deep pullback support (Fibo confluence).
🎯 Trading Ideas
1️⃣ SELL Setup
Entry: 3767 – 377x (if rejection signal shows).
Targets: 3750 → 3725.
SL: Above 3778.
2️⃣ BUY Setup
Entry: 3725 with bullish confirmation.
Targets: 3760 → 377x.
SL: Below 3715.
3️⃣ Deep BUY Opportunity
Entry: 3690 – 3695 zone.
Targets: 3725 → 3760.
SL: Below 3685.
⚡ Trading Insights
Respect the Fibo reaction levels for clean entries.
Risk range: 6–8 USD to avoid stop hunts.
Book profits in steps: 1R → 2R → 3R for strong RR balance.
💬 Community Talk
Do you see gold breaking above 3770 first, or dropping to 3725/3695 before bouncing back? Share your chart view 👇

XAUUSD – Gold Trading Plan: Fresh Record Highs & Fibo Zone React📊 Market Context
Gold regained strong bullish momentum on Monday, surging to a new record high above 3,720 USD/oz. The Fed’s dovish outlook, signaling the possibility of two additional rate cuts this year, continues to support non-yielding assets like gold. At the same time, geopolitical risks remain a tailwind for safe-haven demand.
🔢 Technical Analysis (H2)
Immediate Resistance / SELL Zones:
3,818.769 – Key reaction zone where sellers may defend aggressively.
3,754.890 – Secondary SELL zone reaction area for short-term pullbacks.
Mid-Level Support / BUY Zone:
3,694.521 – First key area to watch for dips and potential buy reactions.
3,660.130 – Stronger support level if price pulls back deeper.
Major BUY Zone Reaction:
3,583.663 – Critical confluence of structure and Fibonacci support, a potential bounce zone if a major correction unfolds.
📈 Suggested Trading Scenarios
1️⃣ Bullish Continuation Setup
BUY: Look for pullbacks to 3,694–3,660 with bullish candlestick confirmation.
Targets: 3,754 → 3,818, leave partial position open if momentum breaks higher.
Stop Loss: Below 3,645 for safer positioning.
2️⃣ Countertrend SELL Setup
SELL: Enter short at 3,754–3,818 zones only with strong rejection signals.
Targets: 3,694 → 3,660, trail stops aggressively to lock profits.
3️⃣ Deep Correction Opportunity
BUY: If price flushes to 3,583–3,585, consider scaling into longs.
Targets: 3,660 → 3,754, aligning with the broader uptrend.
⚠ Key Trading Notes
Expect increased volatility with Fed guidance and ongoing geopolitical risks.
Use smaller position sizes near resistance zones and employ stop-loss discipline.
Avoid mid-range entries; focus on well-defined zones for optimal risk-to-reward setups.
💬 Community Discussion
📊 Will gold sustain its rally toward 3,818 or see a deep pullback before another leg higher? Share your charts and insights below so we can compare strategies!

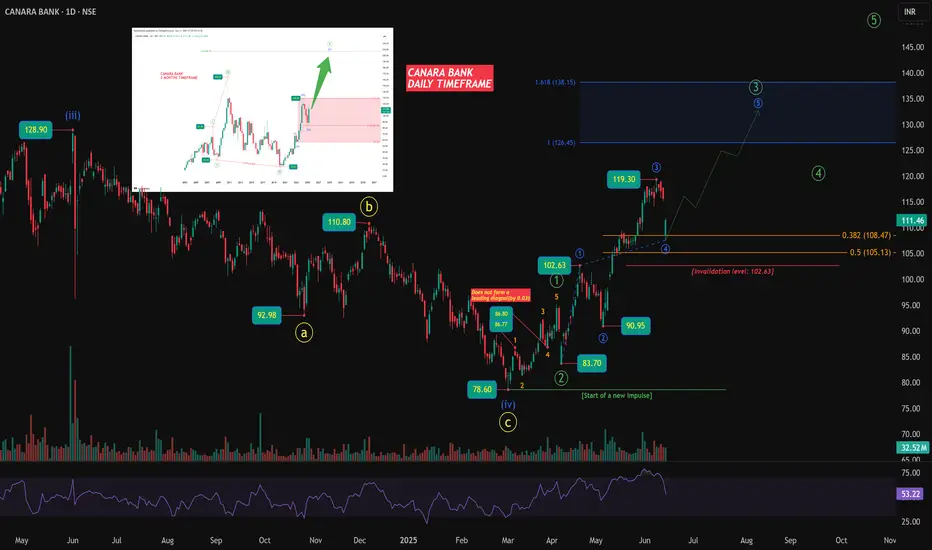
A Rally Born in Silence: The Canara Bank SetupCanara Bank – Multi-Timeframe Impulse Reloaded
On the 3-month timeframe, Canara Bank is staging what looks like a textbook long-term Elliott Wave impulse. With Wave (IV) bottoming out around ₹15.15 and a roaring rally taking us into Wave (V), the broader structure suggests that this could be the start of a generational uptrend, aiming toward the 2.618 extension near ₹206.
Dropping down to the daily chart, things get even more compelling. The move off the March 2025 lows at ₹78.60 is showing all the signs of a fresh impulsive structure. That low aligns precisely with the higher-degree Wave (IV), suggesting the beginning of Wave (V) is already underway. What’s particularly interesting is how the current rally is unfolding — the green Wave 3, which started from ₹83.70, appears to be extending. It has already subdivided into a clean internal five-wave structure, with blue subwaves 1 through 4 in place and blue wave 5 in progress.
This kind of extended third wave is not only typical but often the most powerful part of the move, carrying the strongest momentum. The current wave is aiming toward the 1.618 projection zone around ₹138, which would be a fitting cap for an extended third. Once this fifth subwave of green 3 completes, a corrective green Wave 4 would be due, likely shallow given the strength of the third wave, followed by one final push in green 5.
On the risk side, the structure remains intact as long as price holds above ₹102.63 — the invalidation level for the current count. A break below would suggest the impulse failed and could force a reassessment of the bias. Until then, both the short-term and long-term wave counts remain firmly aligned to the upside, with momentum backing the structure on multiple timeframes.
Chart will be updated as price action evolves.
Disclaimer: This analysis is for educational purposes only and does not constitute investment advice. Please do your own research (DYOR) before making any trading decisions.
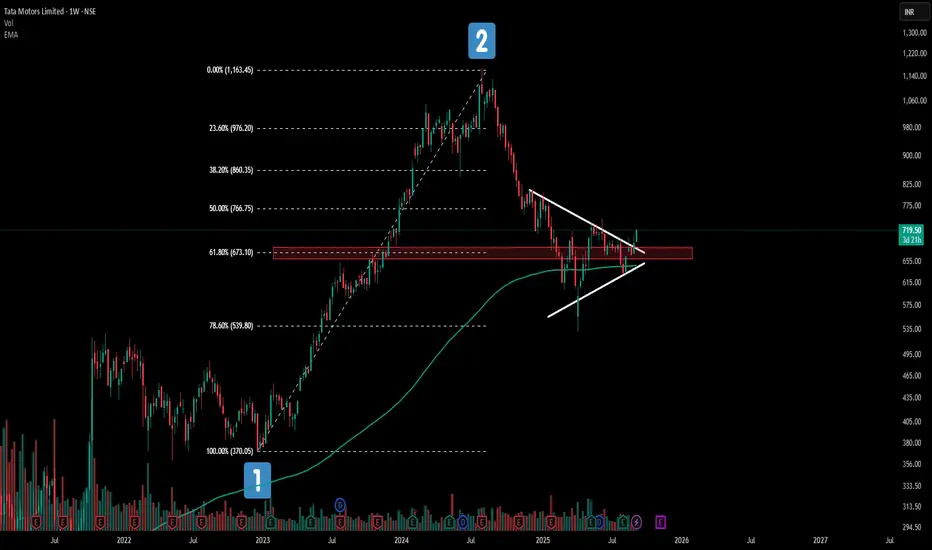
This Tata Motors Pattern Could Change Everything!Tata Motors weekly chart is painting a fascinating picture right now!
📊 Price action is dancing around the 61.8% Fibonacci retracement - a golden ratio traders love to watch.
🎯What makes this even more intriguing? The 200 EMA is playing perfect host to this consolidation party
✨While a symmetrical triangle pattern quietly takes shape. It's like watching three technical forces align in one.
Keeping it simple .
⚠️ This analysis is for educational purposes only and should not be considered as financial advice. Trading and investing in stocks involves substantial risk of loss. Please conduct your own research and consult with a qualified financial advisor before making any investment decisions
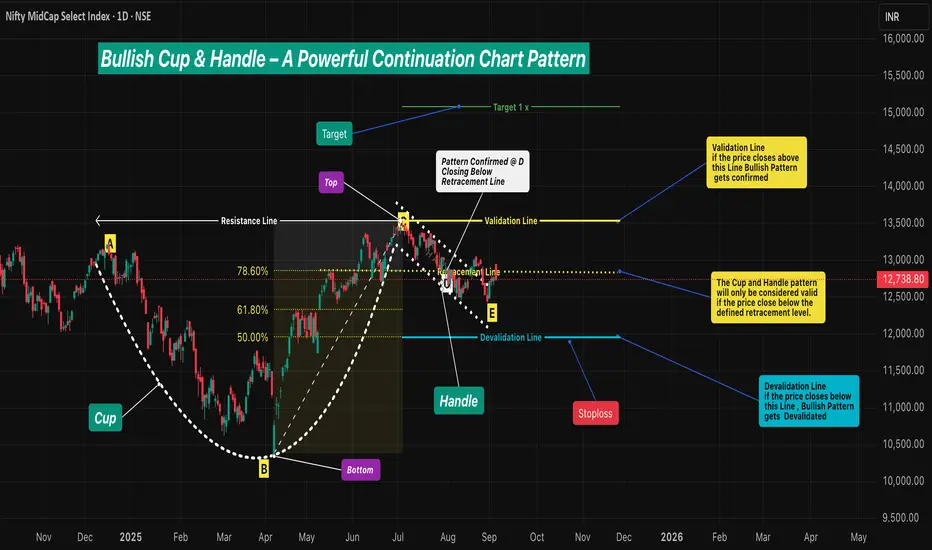
Bullish Cup & Handle – A Powerful Continuation Chart Pattern🔹 Intro / Overview
☕ The Cup and Handle is a 📈 bullish continuation pattern often studied in technical analysis.
⚔️ It forms when there is a fight between bulls 🐂 and bears 🐻 — the Cup develops as both remain strong.
📉 During the Handle, sellers 🛑 temporarily gain strength.
📈 But when price closes above the Validation Line, buyers regain control 💪 and bullish momentum dominates.
____________________________________________________________
📖 How to Identify
✅ Validation → The pattern is valid if price closes above the Validation Line.
❌ Devalidation → The pattern is invalid if price closes below the Devalidation Line(before Validation).
📉 Retracement Rule →The pattern is only confirmed if the price closes below the Retracement Line during the Handle formation.
This ensures a proper pullback forms before breakout .
____________________________________________________________
📖 Key Points of Pattern
✅ A valid Cup requires the retracement condition — confirmation occurs only if price closes below the Retracement Line .
⚖️ Balanced Highs → Point A (left peak) and Point C (right peak) should be relatively close in price, ensuring a proper Cup shape 🍵.
🔒 The Handle must not break the structural integrity of the Cup.(No Close Below Devalidation Lines)
____________________________________________________________
🎯 Trading Plan (Educational Only)
📌 Entry → Considered only after confirmation when price closes above the Validation Line.
🛡️ Stop-Loss (SL) → After validation, the Devalidation Line may act as an SL.
🎯 Target (TP) →
First Target → 1R (equal to the risk defined by Entry–SL distance).
Remaining Lots → Trail using ATR, Fibonacci levels, Box Trailing, or structure-based stops.
____________________________________________________________
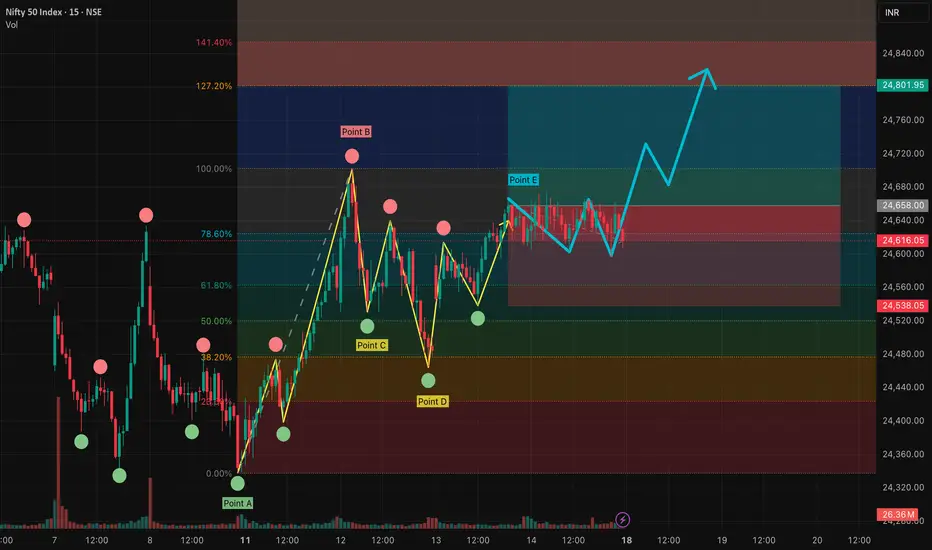
📊 Chart Explanation
🍵 The Cup forms with a rounded base Point B and two balanced tops: Point A (left peak) & Point C (right peak) - The marginal price difference should be small to ensure a reliable Cup.
📈 The Retracement Line ( Point D ) confirms the pattern only if price closes below the Fibonacci Level of 78.60% and above the 50.00% .
📉 The Handle develops as price pulls back, with Point E marking the Handle low. and Good Handle of Cup is Formed (this low should not go below 50.00% Level )
📏 The Fibonacci retracement levels are drawn from Point B (Cup base) to Point C (right peak). These levels provide a reference framework to observe Retracement (minimum 78.60%) , Validation (100.00%) , and Devalidation (50.00%) areas for educational study of the structure.
____________________________________________________________
👀 Observations
✨ Works best after a strong uptrend 🚀 or at major support–resistance zones 🧱.
⚖️ A balanced Cup (Top Right ≈ Top Left) improves reliability.
📏 Handle Formation
The Handle should be shorter than the Cup depth — and should also be longer than the required minimum depth for proper structure.
If the Handle is too deep, it weakens the setup — and also if it is too short, the formation loses reliability.
____________________________________________________________
❗ Why It Matters
🔍 Shows the market battle between buyers and sellers.
💪 Highlights how buyers regain dominance after retracement validation.
⚖️ Balanced structure + strict rules = better filtering of weak setups.
📝 Provides clarity on entry, SL, and TP with a structured framework.
____________________________________________________________
🎯 Conclusion
The Cup and Handle pattern, when validated through Fibonacci retracement rules 📉, balanced highs ⚖️, and proper Handle structure 🔒, offers a disciplined framework for studying bullish continuation setups.
🔥 Patterns don’t predict. Rules protect.
____________________________________________________________
⚠️ Disclaimer
📘 For educational purposes only.
🙅 Not SEBI registered.
❌ Not a buy/sell recommendation.
🧠 Purely a learning resource.
📊 Not Financial Advice.
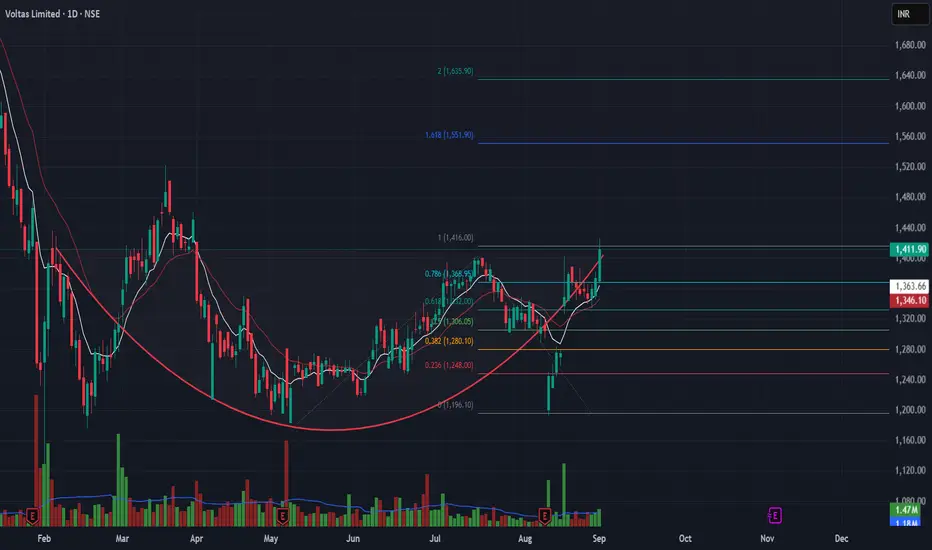
Voltas Ready for a Breakout from Rounding bottom
resistance zone ₹1,416–1,420.
Breakout above 1420 = target ₹1,550 → ₹1,635.
Support: ₹1,360.
⚡ Consumer durables joining the sector rotation trend."
voltas tested ₹1,416 Fib level but faced rejection. RSI remains strong (65+), MACD supportive, indicating trend is still intact. Needs breakout above ₹1,420 for confirmation.
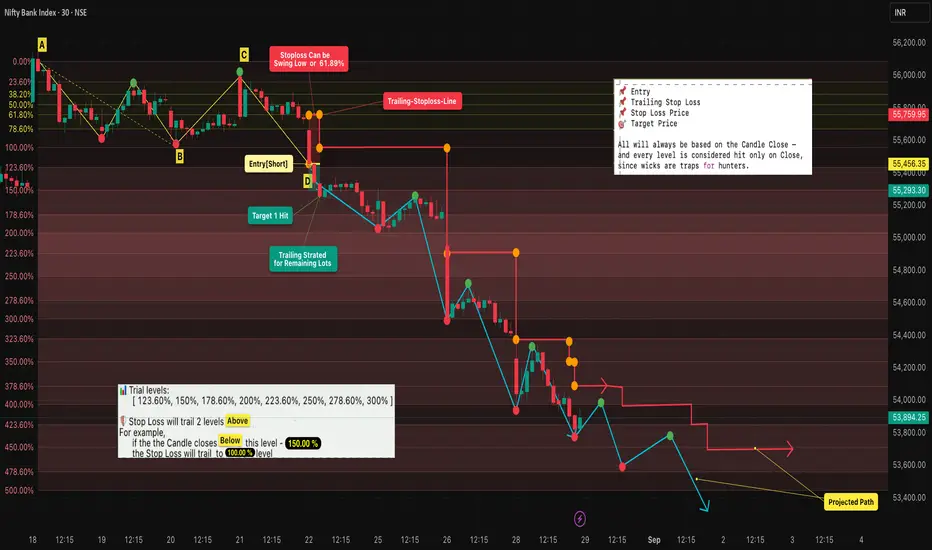
Fibonacci Trailing : Lock Profits & Ride Trends [BANKNIFTY]🔹 Intro / Overview
Managing trades after entry is just as critical as spotting the entry itself.
In this idea, we apply Fibonacci retracements with a trailing stop system to capture profits while staying disciplined.
A well-structured trailing plan helps traders:
✅ Lock in gains early
🛡️ Protect capital against reversals
📊 Stay rule-based instead of emotional
📈 In this case study, BANKNIFTY aligned well with Fibonacci retracement levels , showcasing how these concepts can work in practice as an educational example.
---
📖 Concept
- A swing High (A) to Low (B) defines our Fibonacci retracement zones.
- Retracements (C) test Fibonacci levels but don’t confirm entry until structure is validated.
- Entry (D) occurs only after a successive close confirms the short trade.
- Stop Loss (SL) is placed at the 61.8% retracement (closer and more protective than the far swing).
- Trailing: SL trails forward only , two Fib levels behind price. It manages the remaining position after booking partial profits.
---
📊 Chart Explanation (Step-by-Step)
1️⃣ Swing Definition
📍 A = Swing High
📍 B = Swing Low
2️⃣ Retracement Testing
- C → first retracement (no confirmation) - Here there's a retracement but due to the candle closes below the 38.20% level so devalidation doesn't occured.
3️⃣ Entry Point
✅ At D, successive closes confirm → short entry taken
4️⃣ Stop Loss (SL)
📉 Set at 61.8% retracement for tighter risk management
5️⃣ Targets & Trailing
🎯 Target 1 hit → exit one lot, secure partial profits
🔄 Remaining lots managed with trailing system:
• SL adjusted only forward , never backward
• SL trails as price moves down:
• 150% → SL to 100%
• 178.6% → SL to 123.6%
• 200% → SL to 150%, etc.
6️⃣ Projected Path
🔍 Blue/red paths illustrate how price could move while trailing locks in gains
---
🔍 Observations
📌 Entry validated on structure → reduces false signals
🎯 Booking partial profits builds confidence and ensures realized gains
🔄 Trailing maximizes potential while staying safe
📊 Fib-based progression keeps decisions mechanical, not emotional
---
✨ Why It Matters
✔ Turns static Fibonacci into a dynamic strategy
✔ Prevents giving back profits when trends reverse
✔ Adds confidence and discipline in trade management
✔ Teaches how to scale out smartly
---
✅ Conclusion
Fibonacci retracement alone gives levels — but combining it with a trailing stop system transforms it into a complete trade plan.
By booking partial profits and trailing the rest:
🛡️ You protect capital
🚀 You ride trends longer
🤝 You trade with discipline instead of emotion
---
⚠️ Disclaimer
For educational purposes only · Not SEBI registered · Not a buy/sell recommendation · No investment advice — purely a learning resource
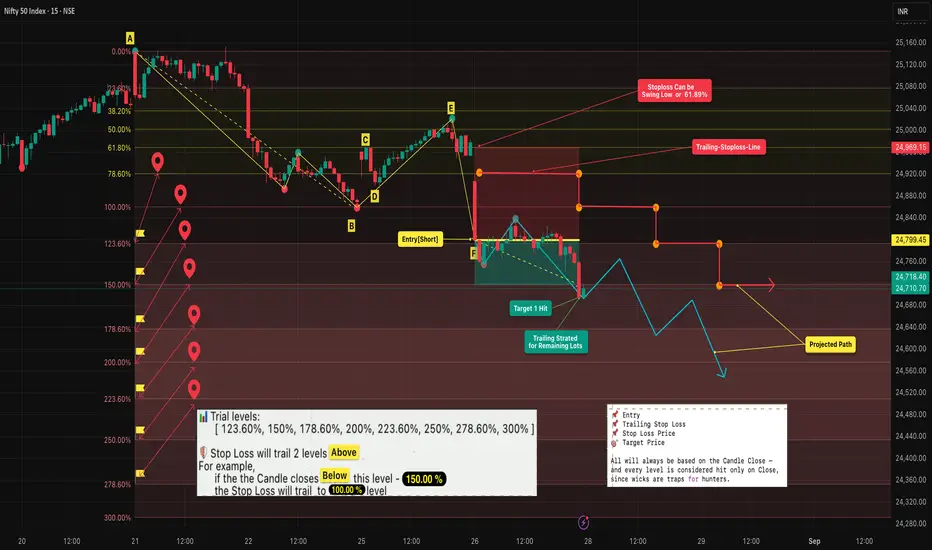
Fibonacci Retracement Trailing : Lock Profits & Ride Trends🔹 Intro / Overview
Managing trades after entry is just as critical as spotting the entry itself.
In this idea, we apply Fibonacci retracements with a trailing stop system to capture profits while staying disciplined.
A well-structured trailing plan helps traders:
✅ Lock in gains early
🛡️ Protect capital against reversals
📊 Stay rule-based instead of emotional
---
📖 Concept
- A swing High (A) to Low (B) defines our Fibonacci retracement zones.
- Retracements (C, E) test Fibonacci levels but don’t confirm entry until structure is validated.
- Entry (F) occurs only after a successive close confirms the short trade.
- Stop Loss (SL) is placed at the 61.8% retracement (closer and more protective than the far swing).
- Trailing: SL trails forward only , two Fib levels behind price. It manages the remaining position after booking partial profits.
---
📊 Chart Explanation (Step-by-Step)
1️⃣ Swing Definition
📍 A = Swing High
📍 B = Swing Low
2️⃣ Retracement Testing
- C → first retracement (no confirmation)
- D → invalid as no proper close
- E → deeper retracement, still no entry
3️⃣ Entry Point
✅ At F, successive closes confirm → short entry taken
4️⃣ Stop Loss (SL)
📉 Set at 61.8% retracement for tighter risk management
5️⃣ Targets & Trailing
🎯 Target 1 hit → exit one lot, secure partial profits
🔄 Remaining lots managed with trailing system:
• SL adjusted only forward , never backward
• SL trails as price moves down:
• 150% → SL to 100%
• 178.6% → SL to 123.6%
• 200% → SL to 150%, etc.
6️⃣ Projected Path
🔍 Blue/red paths illustrate how price could move while trailing locks in gains
---
🔍 Observations
📌 Entry validated on structure → reduces false signals
🎯 Booking partial profits builds confidence and ensures realized gains
🔄 Trailing maximizes potential while staying safe
📊 Fib-based progression keeps decisions mechanical, not emotional
---
✨ Why It Matters
✔ Turns static Fibonacci into a dynamic strategy
✔ Prevents giving back profits when trends reverse
✔ Adds confidence and discipline in trade management
✔ Teaches how to scale out smartly
---
✅ Conclusion
Fibonacci retracement alone gives levels — but combining it with a trailing stop system transforms it into a complete trade plan.
By booking partial profits and trailing the rest:
🛡️ You protect capital
🚀 You ride trends longer
🤝 You trade with discipline instead of emotion
---
⚠️ Disclaimer
For educational purposes only · Not SEBI registered · Not a buy/sell recommendation · No investment advice — purely a learning resource
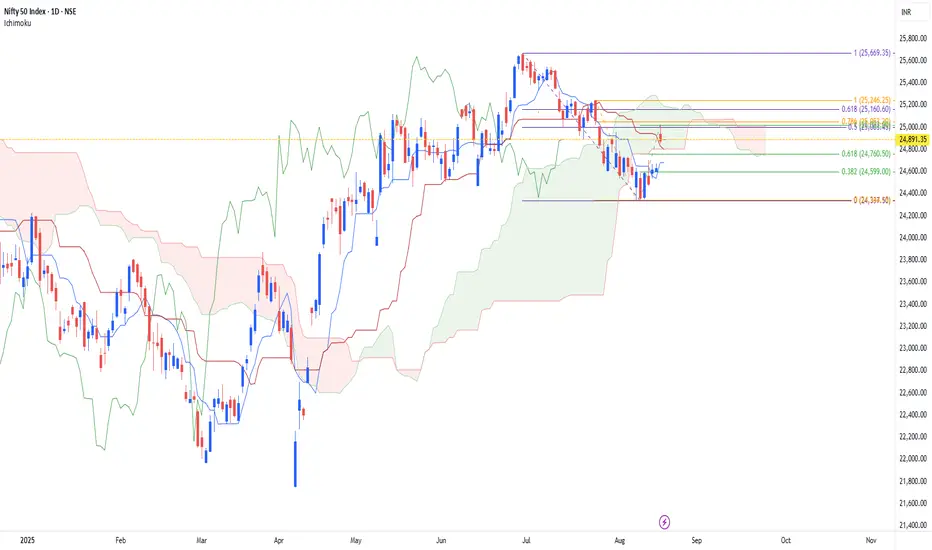
Nifty Short Entry Based on TRIPLE CROWN Theory
combining specific Fibo Retracement level, identified areas that can be used to go short in NIFTY
range to go short is - 25160 to 25000, which got triggered yesterday,
let us go for short till yesterday's high is not breached
target will be 24760 and 24600 and then 24340
stop can be placed 25000
this trade is purely based on entry when the price falls in TCZ (The Triple Crown Zone), which is price zone based on FIBO RETRACEMENT LEVELS IN A SPECIFIC ORDER
note :-
more then entering the trade
it will be more interesting to understand this theory and its impact if price stays in TCS zone today and how it reacts here on
stay tuned
have a good day to all
Fibonacci Retracement Explained: Smarter Entries & Exit Zones🔹 Intro / Overview
Fibonacci retracement highlights potential support and resistance zones during pullbacks. By mapping ratios between swing highs and lows, traders can structure trades, plan entries, and manage risk — not predict the market.
📖 How to Use
1️⃣ Identify Swing Points – Draw from recent swing low ➝ swing high (or reverse for downtrend)
2️⃣ Watch Key Levels – 23.6%, 38.2%, 50%, 61.8%, 78.6%
3️⃣ Confirm with Price Action – Candle closes above/below key levels = stronger signal
4️⃣ Plan Stops & Targets – Use Fibonacci zones or swing points
5️⃣ Enhance Reliability – Combine with trendlines, moving averages, or candlestick patterns
📊 Chart Explanation (Step-by-Step)
The chart demonstrates a possible long setup using Fibonacci retracement:
Point A (Swing Low) : Starting point of the retracement
Point B (Swing High) : Endpoint establishing Fibonacci ratios
Point C (Chart Confirmation) : Swing low confirming levels are relevant
Point D (Potential Invalidation) : Price dips near 38.2%–61.8%; closes below could invalidate
Point E (Entry Zone) : Successive closes above 78.6% confirm entry
🔍 Observations
Price respected multiple Fibonacci zones (38.2%, 50%, 61.8%)
Swing highs/lows defined the structure
Yellow path = past trend movement
Blue path = potential reaction for illustration only
📌 Trade Management
Stops : Just beyond Fibonacci zones or swing points
Targets : Next Fibonacci level or previous swing high/low
Reliability increases when combined with other confirmations
✨ Key Takeaways
✔ Fibonacci is a guide, not a prediction
✔ Candle closes near levels strengthen entries
✔ Stops & targets can flex with Fibonacci or swing structure
✔ Always use confluence for decision-making
✅ Conclusion
Fibonacci retracement is a visual framework to time entries and exits with discipline. Combine it with other tools for stronger setups.
⚠️ Disclaimer: For educational purposes only. Not financial advice.
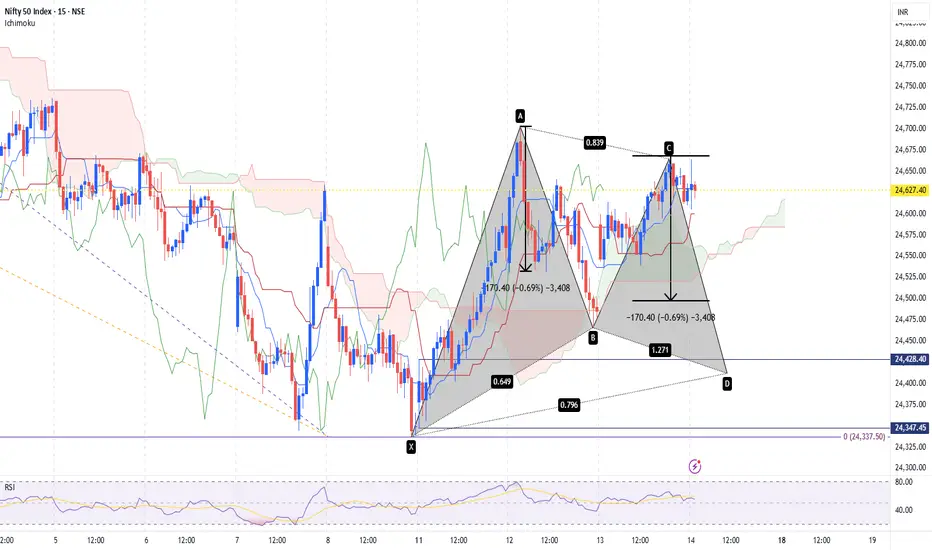
Nifty Viewusing Two Step Fibo strategy, gartley in other words
combining with symmetric price concept
eyeing for 2 target levels
1 - 24500
2 - 24400
lets wait n watch price action
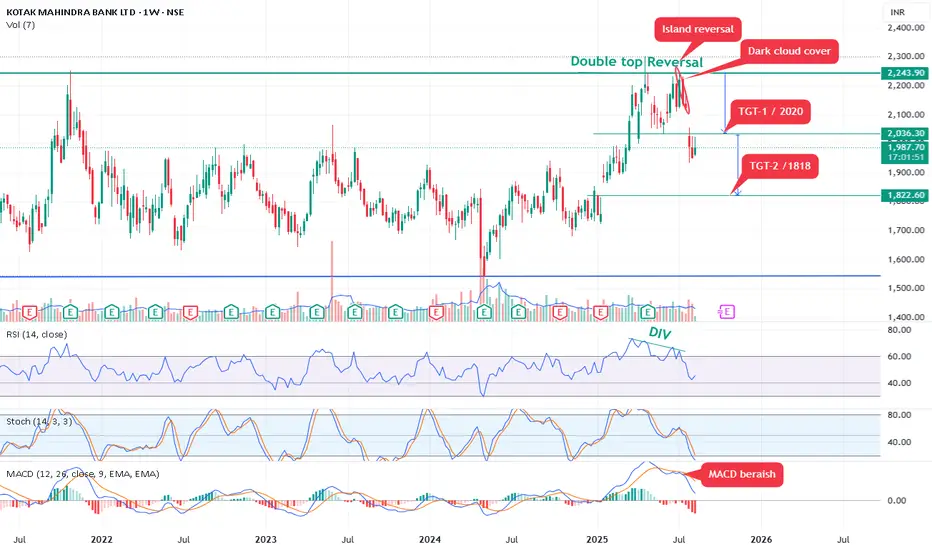
Kotak Mahindra bank form double top Reversal pattern.Kotak Mahindra bank form double top Reversal pattern.
Bearish View (Short Opportunity): The pattern suggests shorting on any rally back up to ₹2,020 (potential resistance or retest of the neckline/breakout level).
As per pattern is may test 1818 soon target -2.
Risk-reward ratio: Approximately 1:2-3, assuming disciplined stops.
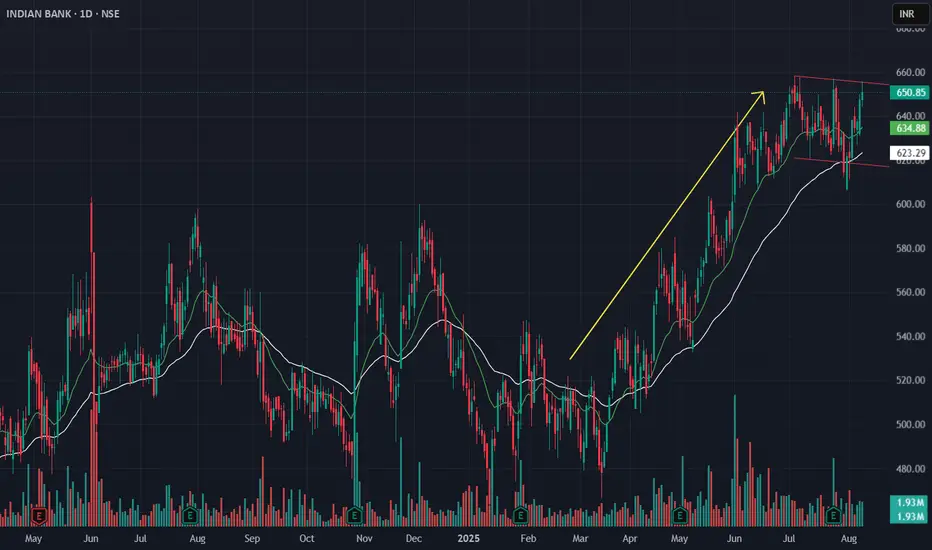
Indian Bank – Flag Breakout Setup from Sector Rotation ScreeningIn the latest sector rotation review, PSU Banks moved into the Improving quadrant, showing early signs of leadership. Within this space, Indian Bank was shortlisted based on:
-- Alignment of 9 EMA & 21 EMA across daily and weekly timeframes
-- MACD trending positively
-- EFI (Elders Force Index) showing accumulation on higher timeframes
Technical Structure:
On the Daily and Weekly charts, Indian Bank is consolidating in a flag pattern after a strong uptrend. The EMAs are acting as dynamic support. On the Hourly chart, a rounding base is forming, indicating early recovery of momentum.
Trade Plan:
-- Breakout Entry: Above ₹656 with strong volume
-- Stop Loss: ₹640 (ATR-based)
-- Targets: ₹695 → ₹716 → ₹746
This setup aligns both with sector momentum and technical structure, offering a favorable risk–reward. Watch for sustained momentum on the breakout day to confirm entry.
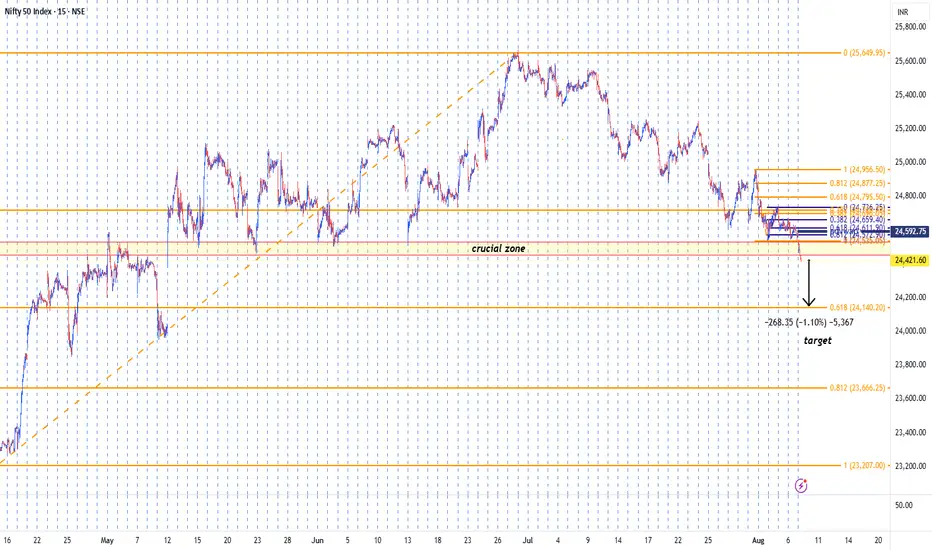
Nifty targetbased on crucial zone break + fibo extention theory
marked target in above chart
#nifty #sankhyainvestment #niftytarget
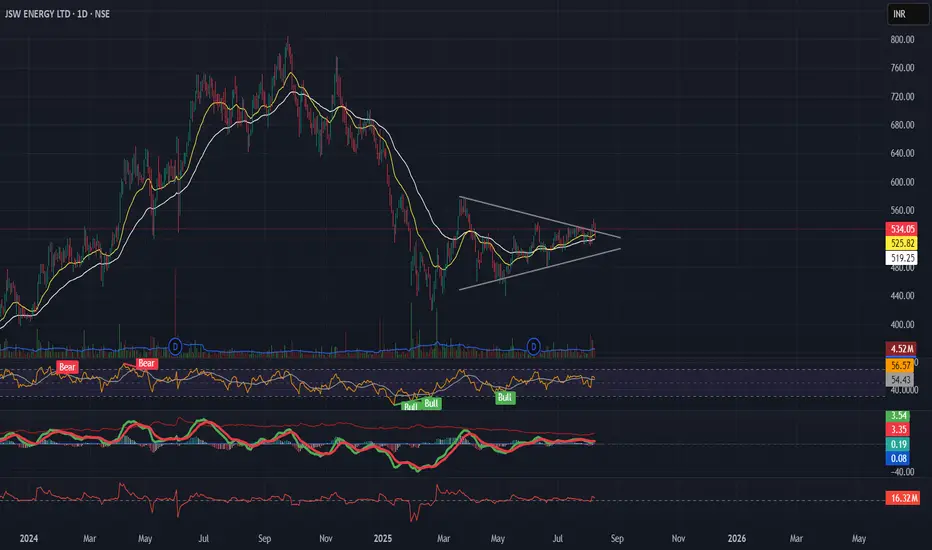
JSWENERGY | Symmetrical Triangle Breakout in Progress?Description:
JSW Energy is forming a symmetrical triangle on the daily chart after a downtrend — resembling a potential bearish pennant, but price structure, sloping EMAs, rising momentum, and positive EFI hint at bullish strength.
📌 Breakout Level: ₹534
📉 Stoploss: ₹519 (ATR-based)
🎯 Targets: ₹563 → ₹597 → ₹694 (as per Fib projections)
🧭 Macro Context:
- Infra & Energy sectors improving
- Govt push for renewables
- Dollar weakening, risk-on tone aiding sentiment
Structure, volume, and macro are aligned — tracking this breakout closely.
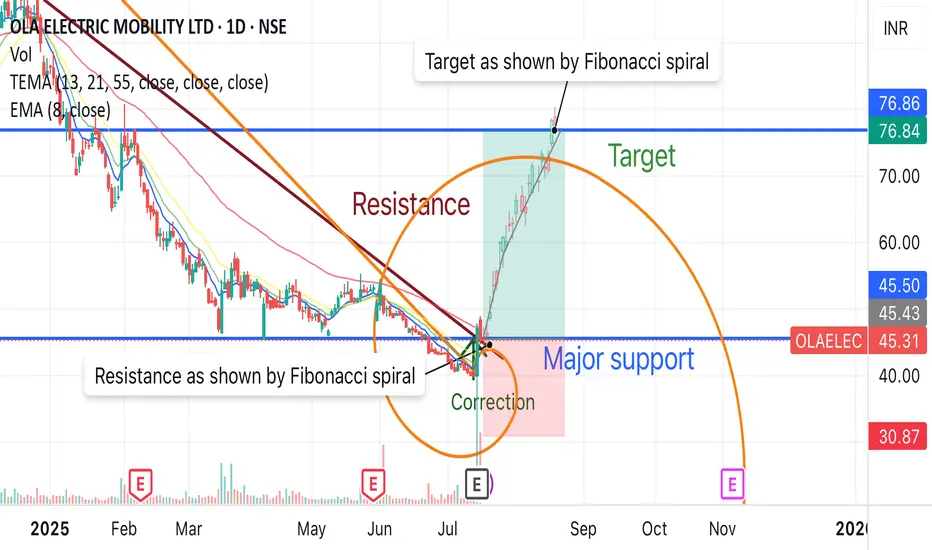
Ola Electric breakout with 65% of upside potential by FibonacciOla electric mobility is going to give 65% of upside with Fibonacci spiral and resistance breakout with high volume.
Buy around - 45 to 47
Target - 76
Duration - 2-3 months
#SAIL#SAIL has corrected about 40% from recent swing high and currently trading near 61.8% retracement zone + weekly 200 ema and parallel channel support confluence zone. On weekly tf, it is probably trying to make a double bottom.
Historidally, when it gave a breakdown below weekly 200 ema and unable to sustain above it, it continued to underperform for almost 8-10 years but now it is probably trying to take support around it.
Also, RSI is making HLs off late, which is probably a good sign.
In terms of R:R, this is currently a good bet on long side.
As usual, DYOR and this isn't a Buy or Sell reco - but just an educational purpose post

HYUNDAI | Channel breakout ahead - Looks good for 30%HYUNDAI | Channel breakout ahead - Looks good for 30%
CMP : 1861
SL : 1700
Expecting breakout in this channel,
Has good support to take measured risk - small stoploss
The previous swing high is also works as Fib support

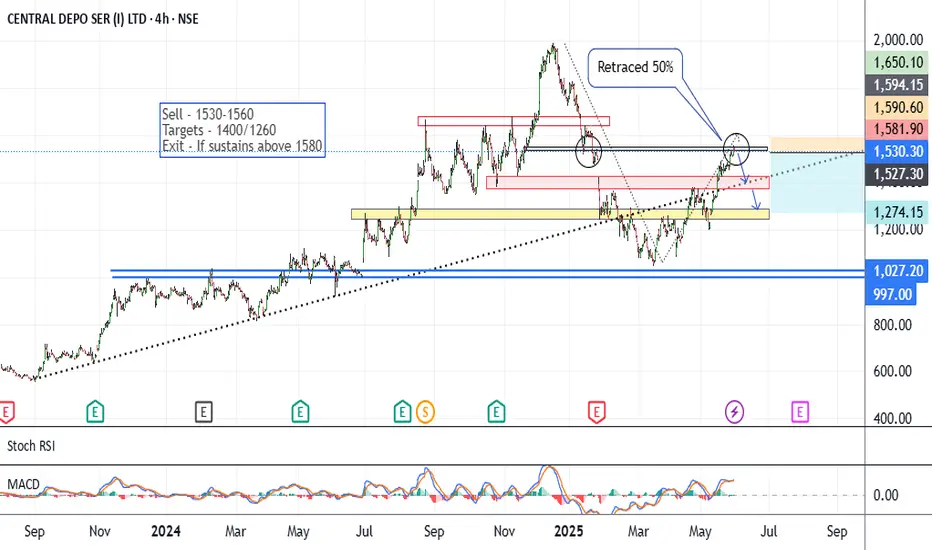
CDSL - Short SetupCMP around 1530 on 01.06.25
The chart is almost self-explanatory. Since March 25, the price has risen by around 50%. This time trading on a likely resistance area.
If price rejects these levels of 1530-1560, it may go into a correction ahead.
Lower targets may be 1400/1260.
The setup weakens if it sustains above 1580 levels.
One should keep the position size according to the risk management.
All these illustrations are provided for learning and sharing purposes only; they do not constitute buy or sell advice. Please do your research before taking any position.
All the best.