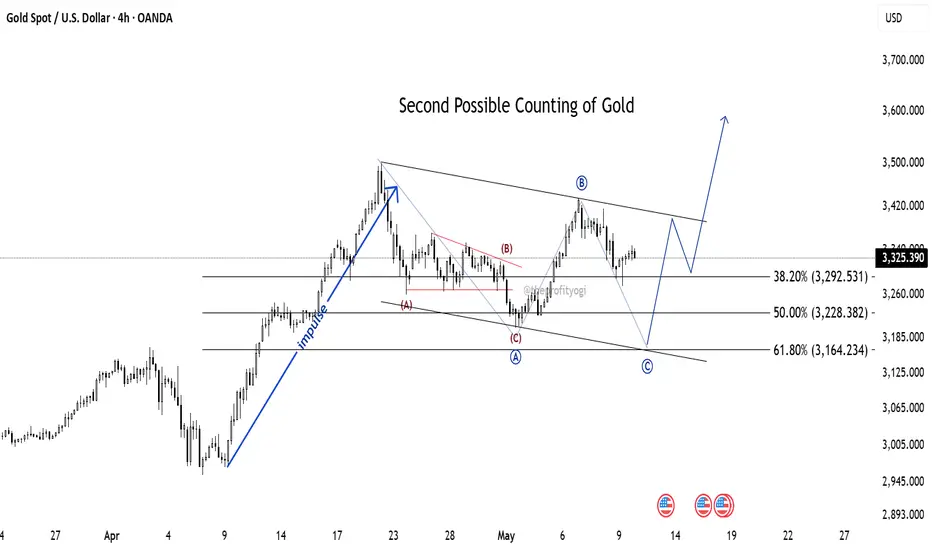
Another Possible Elliott Wave counting of GoldCounting 2:
Here, after an impulse, a Zig-zag correction is formed (marked in red ABC)
Here, I have assumed that this is just point (A) of further correction (in blue colour).
Then the price has gone to form wave (B), and currently the market is in wave (C).
This correction will complete near 61.8% (near 3164 level). And from here, a new impulse will start.
This analysis is based on Elliott Wave theory and Fibonacci study.
This analysis is for educational purposes only.
Fibonnacci
Big Money is Moving In—This Chart Screams BREAKOUT!A deep technical revisit on PREMEXPLN reveals a textbook example of structure, confluence, and timing:
✅ Previous Cup & Handle Breakout Zone (Yellow)
The stock gave a massive breakout in mid-2023 from a well-formed Cup and Handle base.
This zone, once a strong resistance, now acts as a long-term structural support (highlighted in yellow).
✅ Fibonacci Retracement from ATH to CMP
A Fibonacci retracement from the all-time high of ₹906.4 to current levels shows a 61.8% retracement near ₹399, aligning perfectly with the current bounce zone.
✅ Red-to-Green Flip Zone
The stock previously struggled around ₹420–₹480 (red resistance block), but now this zone is flipping into support with price reclaiming it—textbook polarity flip.
✅ WTF Counter-Trendline Breakout
A clean weekly CT breakout is visible with strong bullish conviction.
The breakout candle engulfs the previous sell-off wick, signaling wick fill + rejection absorption—a bullish candle combination.
The breakout is supported by a noticeable volume spike (7.78M).

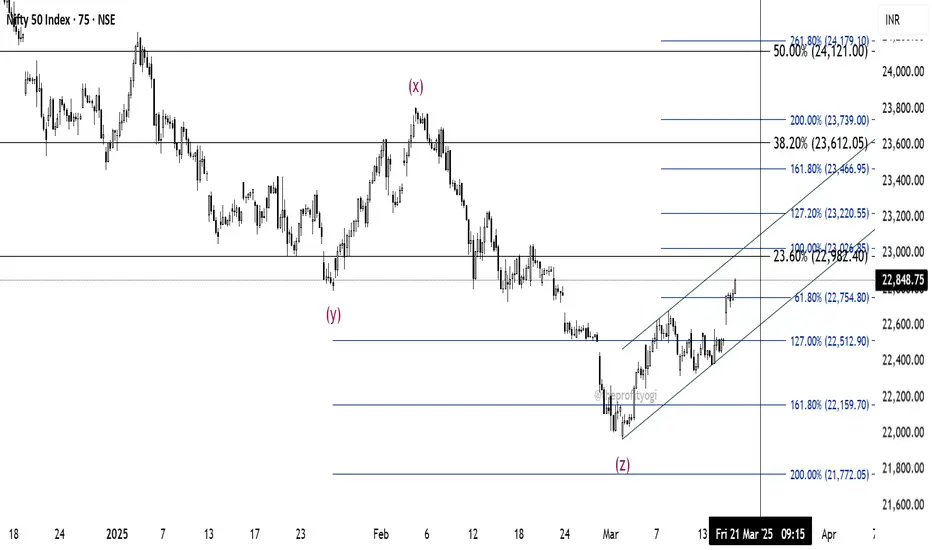
NIFTY: What's next?Nifty is moving as per our previous prediction posted on 5th March.
After making a low of 21964.60, which is the completion of wave Z, the price is moving upwards.
If this move is impulsive, the price must reach 100% level (23026.85) by 21st March.
At this level, there is a cluster of Fib retracement level of 23.6%
Further targets will be 127%, and 161.8% levels.
This analysis is based on Elliott Wave theory and Fibonacci.
This is not any buying recommendation.
For educational purposes only.
Is it a reversal in NIFTY?If we observe the daily chart of NIFTY, a pattern like Morning Star can be seen near the 161.8% retracement level. Also, as per our previous study, the recent fall was wave (Z).
The minimum target for it is 38.2% extension (which is a failure wave (Z) because most of the time, it is seen that wave (Z) is a failure or truncated).
So, we can have a risky buying opportunity here with a small stop-loss below the recent low. Or, if one wants to play safe, he may have his stop bellow 61.8% (21662) level.
The near target will be the bottom of wave (Y), i.e., 22786.90
This analysis is based on the Elliott wave theory and Fibonacci.
This is not any buying recommendations.
This analysis is for educational purposes only.

BANKNIFTY: Elliott Wave AnalysisBANKNIFTY counting using Elliott Wave theory is done from 13th January.
We can see FLART- ZIGZAG- ZIGZAG CORRECTION marked in the chart.
The top made on 6th February is marked as wave (W) because it has 3 moves in it.
The fall after that was sharp and fast. This is the characteristic of wave (X).
Now, according to my analysis price is standing on wave (B) of wave (Y).
and as per previous observations, wave (Y) always crosses the top of wave (W), so we can expect it to go up to 100% extension.
This not any buying or selling recommendation.
This analysis is based on Elliott Wave theory and Fibonacci.
For educational purpose only.

Price action analysis that will give you edge over othersI daily make educational content videos for swing / positional trading

Balkrishna Industries (BALKRISIND) Monthly Chart AnalysisThe technical setup combines Fibonacci retracements, trendlines, and moving averages to reveal key insights into future price action.
The following analysis covers key support and resistance levels, bullish and bearish scenarios, and potential trade opportunities.
Trend Overview :
The stock is in a long-term uptrend, supported by a rising trendline that has acted as a strong base.
Recent corrections indicate a healthy retracement within this uptrend.
Fibonacci Retracement Levels :
The Fibonacci retracement is drawn from a major swing low to swing high.
Key levels:
23.6% at 3,096.30.
38.2% at 2,966.30 (currently breached).
50% at 2,785.30 (tested as support).
61.8% at 2,605.30 (a critical level for buyers).
78.6% at 2,466.30 (final support zone).
Support Zones :
Primary Support: 50% retracement at 2,785.30 coinciding with EMA-21 (~2,661.59).
Secondary Support: 61.8% retracement at 2,605.30 aligned with a consolidation zone.
The long-term trendline also intersects around these levels, adding confluence.
Resistance Zones :
Immediate Resistance: 23.6% retracement at 3,096.30.
Strong Resistance: Previous swing high near 3,374.30.
Psychological resistance at 3,500.
Exponential Moving Averages (EMAs):
EMA-9 at 2,850.54 is currently supporting the price.
EMA-21 at 2,661.59 aligns with the 50% Fibonacci level, acting as a critical support zone.
The EMAs are in a bullish crossover, indicating long-term strength despite short-term corrections.
Volume Analysis :
Monthly volumes are consistent, with higher volumes during bullish candles, signaling strong institutional interest.
The recent pullback has seen declining volumes, suggesting a lack of aggressive selling.
Bullish Scenario :
If the price holds above the 50% retracement (2,785.30) and regains 3,096.30, the uptrend could resume.
Breakout above 3,374.30 may lead to new all-time highs, targeting 3,826.20 as per the Fibonacci extension.
Bearish Scenario :
A breakdown below the 61.8% retracement (2,605.30) and the long-term trendline could invalidate the uptrend.
Further downside could target the 78.6% retracement at 2,466.30 and psychological support at 2,400.
Trade Plan
For Bulls :
Entry: Near 2,785.30 (50% retracement) with confirmation of reversal signals.
Target 1: 3,096.30 (23.6% retracement).
Target 2: 3,374.30 (previous high).
Target 3: 3,826.20 (Fibonacci extension).
Stop Loss: Below 2,605.30 (61.8% retracement).
For Bears :
Entry: On breakdown below 2,605.30 with strong bearish momentum.
Target 1: 2,466.30 (78.6% retracement).
Target 2: 2,400 (psychological level).
Stop Loss: Above 2,785.30.

NIFTY PREDICTIONS.... BEARISH OUTLOOK FOR DECEMBER 2024. I'll try explaining my Nifty chart analysis through Elliot waves.
Nifty, again, is likely correcting in a 5-wave pattern. After reaching an ATH of 24274, Nifty's downside waves/correction started towards the end of September.
Wave (1) moved in a 5-wave pattern and ended around 24700, as marked in the chart.
Wave (2) had a zig-zag pattern and ended around 25200.
Wave (3) also had a 5-wave pattern, falling 1.23 times wave 1 to end around 23300 levels.
Wave (4)- Nifty is currently in this wave, which is probably in a zig-zag pattern. Wave (4), as usual, notoriously has violent moves on either side, giving challenges to traders.
Probable levels of termination of wave (4) are 24800 {0.5 of waves (1-3)}and 25150 {0.618 of waves (1-3).
Wave (5) - Assuming wave (4) termination around 25150, we can expect a big correction in Nifty to 22700 levels. This wave (5) alone can cause approximately 10% fall in Nifty.
Remember,
THE MARKET IS ALWAYS RIGHT.
Trade with appropriate stoploss.

Good buying opportunity in HDFCAMCWave 4 is almost finished in HDFCAMC.
We can see that a Flat Correction is getting over here.
Wave C of this Flat Correction is near 127%, where a 50% retracement level of the previous impulse is also present.
This creates a good buying cluster. The stop loss for this trade will be 61.8% (marked in red). As wave 4 will never reach this level, we can assume that this is a pretty valid level at which to put our stop.
This analysis is based on Elliott wave theory and Fibonacci.
This analysis is for educational purposes only.
Please always do your own research before you take any trade.

BLUEDART - A must watch long term portfolio stock!MONTHLY TF VIEW:
Price Observations:
1. Good Volume support
2. Price structure is bullish
3. Reclaiming 9 years BO level
4. Bouncing from Monthly swing 50% fib level.
5. Bouncing from the Weekly Demand zone
6. Earnings are showing good growth as well.
Trade Plan:
1. Entry can be planned above 7900 with 15% Sl
2. Targets can be huge 14000 I'm expecting not immediately but eventually will reach there. Since it is a portfolio pick. For swing trade 9000 & 10000 can be considered as the TP levels
- Stay tuned for further insights, updates and trade safely!
- If you liked the analysis, don't forget to leave a comment and boost the post. Happy trading!
Disclaimer: This is NOT a buy/sell recommendation. This post is meant for learning purposes only. Please, do your due diligence before investing.
Thanks & Regards,
Anubrata Ray

PI INDUSTRIES good to buy?The daily chart of PI INDUSTRIES shows that the stock is in wave 4 of an impulse.
Wave 3 is a terminal impulse in this case as it is less than 161.8% (see fib extension in green).
And as per the rule, wave 4 of any terminal impulse can overlap with wave 1. Also, wave 4 can retrace to 50%.
We have done detailed counting, and we can see that the price is near 50% of the fib retracement of the impulse.
At this level, we can see wave C of wave 4 is standing at 127% extension. It is possible that the price can fall a little further up to 161.8% extension. (See fib extension in blue).
The conclusion is that an aggressive trader can enter between the zone of 50% (see in black) fib retracement and 161.8% (see in blue) fib extension.
For conservative entry, one can wait for the price to break and sustain above 38.2% (see in black).
The stoploss for both entries will be below 61.8% (see in red). This is quite logical because wave 4 will never close below 61.8%
Meaning, the 61.8% level is an invalidation point for all this counting and the price will fall further if it breaks 61.8%
This analysis is based on Elliott wave theory and Fibonacci.
This analysis is for educational purposes only.
This is not any buying recommendation. Please always do your research before taking any trade.

COCHIN SHIPYARD analysisCOCHIN SHIPYARD is forming wave of Zig-zag pattern.
We can see the previous fall has 5 waves within it forming wave of Zig-zag.
According to the rule, wave will go a minimum 23.6% and a maximum of 50%.
Anyone in the buying side in COCHIN SHIPYARD, should exit at these levels, as the price will fall again to form wave of Zig-zag.
Trend changes above 61.8% level.
This analysis is based on Elliott Wave theory and Fibonacci.
This analysis is for educational purposes only.
This not buying recommendations. Please always do your research before you take any trade.

Classic Double Correction PatternThis is a classic example of Double correction (Double three) in HDFCLIFE.
Marked in the first box, we can see Flat Correction where wave B is retraced to the 81% level. We are fulfilling the minimum requirement (61.8%) of wave B. Here in wave C, we see three waves. This is the first hint of an upcoming complex correction. The whole wave is marked as W here.
In the second box, there is a perfect Zig-zag pattern. Wave B is retraced to 50% here. Also, we can see three waves in wave C, which gives us wave Y.
These two waves are connected by wave X which is retraced to 111%.
This is the best example of Double correction.
This analysis is for educational purposes only.
This analysis is based on Elliott Wave theory and Fibonacci analysis.

Banknifty View 22Nov FridayBanknifty dropeed to 49900 below as analysed in previous idea.
Now expecting still more drop.
Case red: as shown in chart can reverse max till 550-80 and go to 49900-49500 today
If it sustains above 50700 we will recount and update analys

What's happening in ITC?ITC daily chart: After completion of Normal or Trending Impulse, the price falls.
We can see clearly that the first leg of this fall looks like an impulse (shown by red 1-2-3-4-5), which is wave A of Zig-zag.
Then price retraced to 38.2% forming wave B.
Currently, wave C is developing in ITC. The minimum fall for this is 61.8% extension, which is near the 459 level.
Remember that this is a minimum fall for any Zig-zag pattern.
If the price breaks 459 and starts trading below it, the target of 100%, which is near 438.85, will be achieved. (This also fulfills the Rule of Equality).
This analysis is based on Elliott Wave theory and Fibonacci.
This analysis is for educational purposes only.

Further fall pending in NiftyAs the 127% level is broken in NIFTY, it shows that wave B of Zig-zag has completed near 38.2% and now wave C of Zig-zag is forming. This fall will go minimum up to 24255.

BANKNIFTY Down side pattern confirm.Bank nifty confirm LL and LH pattern, Any bounce near to 51300-51880 would be good shorting opportunity for target 49000-48800 level.

BTC looks BullishBitcoin is back in the uptrend crossing multiple Fib resistance. Latest $63,200 is a support now. RSI shows price cooling off, hence, there is ahuge chance we going to cross the FWB:65K in the next attempt in the nect 24-48 hours. Not just the 20 Moving Average but the trend line is also a support now. However MACD is showing a bit of bear movement but that is also fading off. With a little bit of jump MACD will come to support the price rise.

Where is Nifty 50 Headed Next? Is the journey coming to an end? Date: 3rd July 2024
Nifty Elliot Wave Analysis - Daily Time Frame
General Trend:
Since March 2023, Nifty 50 has surged in a remarkable uptrend, skyrocketing from around 17,000 to an impressive 24,300—a spectacular leap of 7,300 points. So, has Nifty 50 reached its limit? Is the journey coming to an end?
Here is our previous analysis, which we posted on June 18th, and we are still using the same wave count.
Ichimoku Cloud:
Applying the Ichimoku cloud to the chart, we see that Nifty 50 is trending above the Monthly, Weekly, Daily, and Hourly clouds. This suggests that Nifty 50 still has more ground to cover. No sign of reversal yet in Ichimoku and Price action.
Elliott Wave Analysis:
Applying Elliott wave analysis to the entire leg of Nifty 50’s journey from March 2023 suggests that we are currently in subwave 3 of Wave 5.
The Wave 5th has already completed its minimum target at 127% (23,898) and is now looking to hit 161.8% (24,600). If this is surpassed, we could see 25,000+ which corresponds to the 200% Fibonacci ratio.
The Nifty trend will change only if the daily candle closes below 23,898.
Disclaimer:
We are not SEBI registered. The content presented here is based on personal opinions. Conduct your own research and consult with a qualified financial advisor before making any investment decisions.

HFCL - Minimum 20% quick momentum can be expected!HFCL - A Tech sector stock pick
Observations:
1. Price structure is bullish
2. Support from fib zone
3. Good Volume build-up
4. EMAs & RSI are indicating strength and momentum on the upside
5. Prices are rejecting on the downside (rejection candle on WTF) depicts buyers are dominant.
- Stay updated for further insights and trade safely!-
- If you liked the analysis, don't forget to leave a comment and boost the post. Happy trading!
Disclaimer: This is NOT a buy/sell recommendation. This post is meant for learning purposes only. Please, do your due diligence before investing.
Thanks & Regards,
Anubrata Ray

The Big Correction in Bank Nifty? Short at 52575 with 53100 SLTime: 10:22 AM, 26th June 2024
Bank Nifty Current Market Price: 52,585
Stop Loss 53100
Targets: 47843, 44,897, 44,444 and 40135
We shared our view on Bank Nifty (BN) in yesterday's post. A few people asked us to share the complete wave count in BN in detail with trendlines.
Bank Nifty has completed its degree (2020-2024 wave). It has to go down for Degree 2, which can be a time-wise correction or a price-wise correction. There is a high chance of a time-wise correction, which might take a lot of time. Therefore, option selling with an edge is the safest option, or shorting futures with a call option hedge.
1. It has hit the Fibonacci levels we predicted a few days ago at 52,500 and made a high of 52,734.
2. The price has hit trendlines and given a fake breakout of a few previous trendlines.
3. Proper Selling Angle with few breakouts in weekly and monthly time frame.
Disclaimer: We are not SEBI registered. The content presented here is based on our personal opinions. Conduct your own research and consult with a qualified financial advisor before making any investment decisions

GUJARAT GAS - Strong bullish BO: Expecting 30% ROI!Overview & Observations :
1. Moving up from the 50% Fibonacci support level.
2. Volume Confirmation: Good volume on the breakout candle.
3. Price structure indicating upward momentum. Forminh HL-HH
4. Good rejection candle in W tf means, buyers are strong and dominant.
5. The RRR (Risk:Reward Ratio) is favourable.
6. Steady earnings growth, with good quarterly results potentially triggering a strong move.
Trade Plan:
- Entry: At CMP around 600
- Stop Loss: 10-15% below the entry on closing basis.
- Target: Aiming for a 50% upside potential and TP
- Stay updated for further insights and trade safely!
- If you liked the analysis, don't forget to leave a comment and boost the post. Happy trading!
Disclaimer: This is NOT a buy/sell recommendation. This post is meant for learning purposes only. Please, do your due diligence before investing.
Thanks & Regards,
Anubrata Ray

BankNifty Support & Resistance Levels for 14.05.2024BankNifty found substantial support within the second support zone highlighted in the previous post, triggering a remarkable rally of over 800 points from the day's low. The near support zone remains unchanged, spanning from 46870 to 47015, with a further support level observed at 46547, a significant Fibonacci level at 61.8%. On the resistance front, the nearest zone for BankNifty is expected between 48051 and 48146, while a more distant resistance zone lies at 48222 to 48457.
