Fibonacci Retracement Trailing : Lock Profits & Ride Trends🔹 Intro / Overview
Managing trades after entry is just as critical as spotting the entry itself.
In this idea, we apply Fibonacci retracements with a trailing stop system to capture profits while staying disciplined.
A well-structured trailing plan helps traders:
✅ Lock in gains early
🛡️ Protect capital against reversals
📊 Stay rule-based instead of emotional
---
📖 Concept
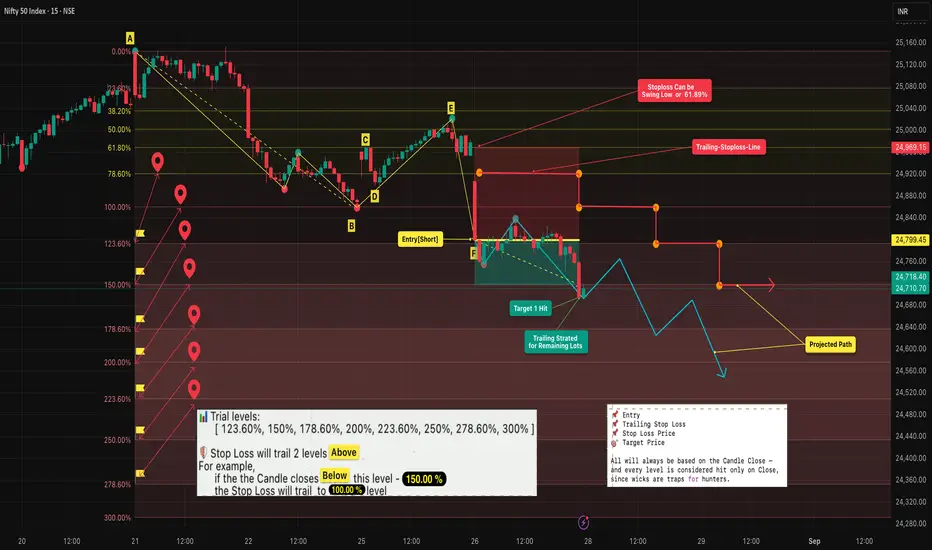
- A swing High (A) to Low (B) defines our Fibonacci retracement zones.
- Retracements (C, E) test Fibonacci levels but don’t confirm entry until structure is validated.
- Entry (F) occurs only after a successive close confirms the short trade.
- Stop Loss (SL) is placed at the 61.8% retracement (closer and more protective than the far swing).
- Trailing: SL trails forward only , two Fib levels behind price. It manages the remaining position after booking partial profits.
---
📊 Chart Explanation (Step-by-Step)
1️⃣ Swing Definition
📍 A = Swing High
📍 B = Swing Low
2️⃣ Retracement Testing
- C → first retracement (no confirmation)
- D → invalid as no proper close
- E → deeper retracement, still no entry
3️⃣ Entry Point
✅ At F, successive closes confirm → short entry taken
4️⃣ Stop Loss (SL)
📉 Set at 61.8% retracement for tighter risk management
5️⃣ Targets & Trailing
🎯 Target 1 hit → exit one lot, secure partial profits
🔄 Remaining lots managed with trailing system:
• SL adjusted only forward , never backward
• SL trails as price moves down:
• 150% → SL to 100%
• 178.6% → SL to 123.6%
• 200% → SL to 150%, etc.
6️⃣ Projected Path
🔍 Blue/red paths illustrate how price could move while trailing locks in gains
---
🔍 Observations
📌 Entry validated on structure → reduces false signals
🎯 Booking partial profits builds confidence and ensures realized gains
🔄 Trailing maximizes potential while staying safe
📊 Fib-based progression keeps decisions mechanical, not emotional
---
✨ Why It Matters
✔ Turns static Fibonacci into a dynamic strategy
✔ Prevents giving back profits when trends reverse
✔ Adds confidence and discipline in trade management
✔ Teaches how to scale out smartly
---
✅ Conclusion
Fibonacci retracement alone gives levels — but combining it with a trailing stop system transforms it into a complete trade plan.
By booking partial profits and trailing the rest:
🛡️ You protect capital
🚀 You ride trends longer
🤝 You trade with discipline instead of emotion
---
⚠️ Disclaimer
For educational purposes only · Not SEBI registered · Not a buy/sell recommendation · No investment advice — purely a learning resource
Fibretracement
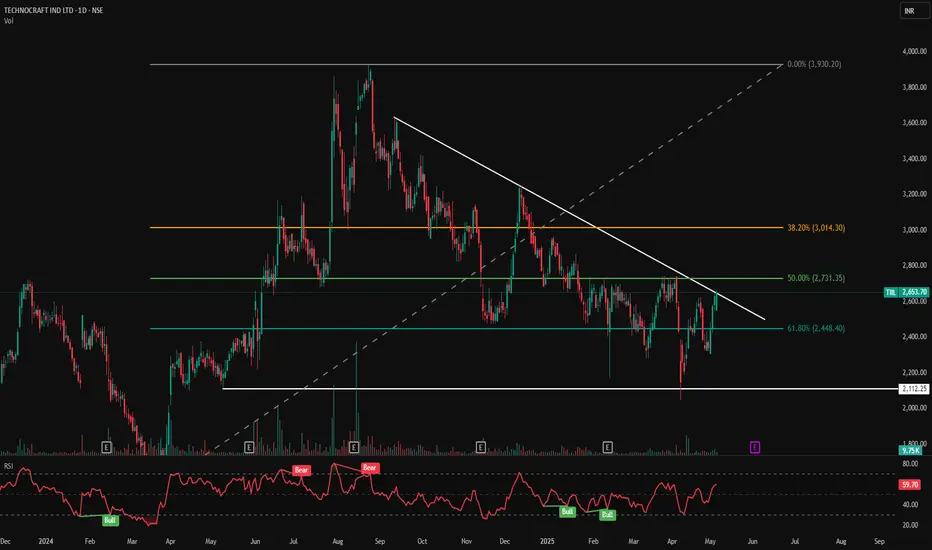
TILL - Descending Trendline Breakout Watch📊 TIIL – Descending Trendline Breakout Watch | Key Fib Retest in Play
🕰️ Timeframe: 1D | 🧭 Pattern: Descending Triangle | 🎯 Fibonacci Reversal Setup
📈 Technical Analysis Summary:
TIIL is currently approaching a major trendline resistance, drawn from its all-time high. After a long downtrend, the stock is now testing the 50% Fibonacci retracement level at ₹2,731.35 with rising momentum.
The price is hovering near a breakout zone and consolidating just below resistance, hinting at potential bullish continuation. A successful breakout can open gates to much higher levels, especially toward the 38.2% Fib zone and beyond.
🔍 Chart Highlights:
⚪ Descending Trendline: Key multi-month resistance line
🟢 Current Price Action: Holding above 61.8% Fib (₹2,448.40) and pushing toward 50% zone (₹2,731.35)
🔵 Base Support: ₹2,112.25 (previous structure low)
📈 Volume: Gradual build-up near resistance zone
🔴 RSI (14): Currently at 59.70 – neutral-to-bullish, showing higher lows
📍 Bullish RSI Icons: Highlighted near recent bottoms, indicating accumulation zones
📌 Support & Resistance Levels:
Type Level (₹)
🔼 Resistance 1 2,731.35 (Fib 50%)
🔼 Resistance 2 3,014.30 (Fib 38.2%)
🔻 Support 1 2,448.40 (Fib 61.8%)
🔻 Support 2 2,112.25 (Major horizontal support)
🧭 Trading Setup Overview:
✅ Bias: Bullish if price breaks and closes above trendline and ₹2,731
💡 Entry Watch: Break and hold above ₹2,731.35 with volume
🛑 Invalidation: Close below ₹2,448.40 (61.8% Fib)
🎯 Upside Targets: ₹3,014 → ₹3,500+ (based on structure)
💬 Conclusion:
TIIL is at a critical juncture with a high-probability trendline breakout setup in play. The Fibonacci confluence, improving RSI, and rising volume indicate a bullish bias. Watch for a strong breakout candle above ₹2,731 for potential positional opportunities.
⚠️ Disclaimer: This chart is shared for educational purposes. Kindly consult your financial advisor before making any trading decisions.
🔔 Follow @PriceAction_Pulse for more high-probability swing setups and technical chart breakdowns!
📌 Save & share if TIIL is on your breakout watchlist!
Trade Idea: $NSE:RELIANCE for Next WeekHello, Traders! 👋
#RELIANCE is shaping up as an interesting watch for the coming week:
📈 Technical Overview:
🔹 Weekly Retracement Level: Trading near the golden zone, a key area for potential reversal.
🔹 Daily Supply Zone Confluence: Overlapping supply zone could act as a critical resistance.
🔹 1-Hour Liquidity Sweep: Potential for a liquidity grab before resuming an upward move.
💡 Plan of Action:
Keep a close eye on price action around these levels. A confirmed breakout or rejection could set the direction for the next move.
⚠️ Disclaimer:
🔹 This analysis reflects my personal views and is not a recommendation to buy or sell.
🔹 Please conduct your own research or consult a professional before trading.
What’s your outlook on #RELIANCE for next week? Let’s discuss! 🚀
#StockAnalysis #TradingView #TechnicalAnalysis #MomentumStocks #RELIANCE

RAILTEL - AS PER FIB RETRACEMENT, CORRECTION WAVE MIGHT BE OVERHi,
This idea is about Railtel Corporation of India Ltd
ABOUT THE COMPANY
RailTel was incorporated in 2000, with the objective of creating nationwide broadband and VPN services, telecom, and multimedia network, to modernize the train control operation and safety system of Indian Railways. It is a "Miniratna" PSE of the Government of India. At present, RailTel's network passes through around 6,000 stations across the country, covering all major commercial centers
TECHINCALS
As per the price action, the first impulse wave took the price all the way from 337 to 615. THen the correction wave commenced which pulled back the price from 615 to 440 levels. The price point as per fib retracement is at the point of 50-61% which as per Elliot Wave theory should be the correction wave
Next impulsive wave could start if the price aloses above 475 with volume support
FUNDAMENTALS
Market Cap
₹ 15,066 Cr.
Current Price
₹ 469
High / Low
₹ 618 / 163
Stock P/E
56.4
Book Value
₹ 56.9
Dividend Yield
0.61 %
ROCE
20.2 %
ROE
15.2 %
Face Value
₹ 10.0
Equity capital
₹ 321 Cr.
No. Eq. Shares
32.1
EPS
₹ 7.99
Promoter holding
72.8 %
Change in Prom Hold
0.00 %
Chg in Prom Hold 3Yr
0.00 %
Pledged percentage
0.00 %
Market Cap to Sales
5.67
Sales growth
29.8 %
PEG Ratio
3.81
EVEBITDA
27.9
Quick ratio
1.16
Trade receivables
₹ 1,268 Cr.
Sales
₹ 2,658 Cr.
Debt to equity
0.02
Price to book value
8.25
Free Cash Flow
₹ 347 Cr.
CMP / FCF
75.8
Thanks,
Stock-n-Shine

FACT-A multibagger stock bouncing from golden ratio!FACT has shown an amazing rally post breakout of 200 levels.
Stock has shown an healthy retracement upto 38.2% and now showing signs of reversal.
Risky traders can keep this in watchlist as stock is in mad bull run and can show quick moves.
Please like and follow if you love my analysis.

Tata Motors - Mid Term (Now down then UP)Hi Friends,
Tata Motors is in up move from a couple of weeks.
The move is expected to continue after a brief retracement. Retracement levels are marked with Fib retracement.
A zone around 452 can be a potential reversal zone.
2 daily closings below 61.8% fib marking will confirm the trend change.

BIRLASOFT - LONG TERM - HARMONIC Bullish Bat Harmonic completed on daily TF.
Potential Targets marked based on Fib retracement.
Security is still in the bearish zone, trading below 20 EMA.

SBI towards crucial support zones SBI the largest public sector bank is forming a head & shoulder pattern on weekly charts along with a breach of neckline support from where early breakout occurred. given that ads negative trend strength is rising , If the momentum support at psi 40 breaches along with a confluence support breach of bottom trendline from 2020, then it could be retesting the previous swing low at 500 & if could not find help there could be heading to swing low near fib retracement 38 neat 450.

Crudeoil possible to re-test and reverseA Harmonic chart is presented as per the current price action for Study purpose.
A reverse is happened already from the reverse point, D and it may re-test.
$67.71 is another strong support.
It can see that the today inventory outcome is not in favor to the price and it may test $67.71
Note: Information given here for study purpose only.

RUPA & CO LTD: Positive outlookNSE:RUPA shows strong buy indicated by PSAR, MACD & Fisher crossover .
Target 1: 531.55
Target 2: 547.30
Stop Loss: 508.35
𝑫𝒊𝒔𝒄𝒍𝒂𝒊𝒎𝒆𝒓:
The analysis is only for illustration purposes only. Please consult your financial advisor, agent, broker before acting on any information. We may or may not have positions in the stock and our actions may be contrary to the one mentioned here. This analysis may or may not be updated. We would not be responsible for the profit/loss resulting from this analysis.

NSE:MANAPPURAM Why entry 5.85 ?? fib retracement !!NSE:MANAPPURAM
#NSE:MANAPPURAM 155 CE entry given @ 5.85 today.
to know why, check out the level mentioned on chart !!
0.618 - fib retracement.
Still if anyone not clear with the entry level, do ping me personally, no issues !!

SRT Finance : AnalysisNSE:SRTRANSFIN has been consolidating in a wide range since starting of February with good volume support at lower levels. The possibility of breaking out is good as it is testing previous highs multiple times and holding levels near its previous highs.
In addition to all this, it is having Volume support exactly at golden fib retracement levels and previous BOS levels. Even though nifty and bank nifty is falling with good volume SRT holding its higher levels is a good sign.
Soon we can see a good breakout in the SRT finance after buyers accumulation at higher levels. The possibility of following the mentioned path is good. Let's hope for the best what's coming next.
PS: Trade is looking promising then also never underestimate market it has a tendency to shock you to your very core, always risk what you can afford to lose and follow RR ratio, and Trade with your head in place. As always NO analysis is 100% effective all the time.
PPS : I'll you guys as soon as possible.

DLF TRADE SETUP FOR TOMORROWAs you can see in the chart, DLF made Fibonacci Retracement correction has already done.
.
Now stock is testing 428 level, its a strong resistance once the stock goes above 428.
.
You can buy this trade for the target of 440.
.
What's your view on this comment below in the box.


#ETHUSD .... Broader market trend analysis .. #buythedipAre you buying ETH dip today??
Do you even think it is a dip or according to you ETH is going to zero soon?
Whatever your perspective is let me know in the comments #buythedip #ethusd

Nifty Might Retrace Back to 13977 LevelNifty Might Retrace Back to 13977 Level following a Double Top neckline breakdown.

LT - Upar Jaane ka Raasta 2.0
Buy above 970 (Day High) for 980 (50% Fib Retracement level), 988, 1000 & 10 point TSL after that till 1055.
Sell below 953 for 945, 940 (Long term Value Price), 930.
Refer the linked LT idea on more details on LT Price Action & Fib Retracement
Disclaimer:
These are NOT trading advice!
The intention is to gather feedback on them, so please drop in a comment if you find areas of improvement.
& If the idea makes sense to you - like it & share comments :)

NTPC - Consolidation at SupportGo long above 86.3 for 88. Refer linked idea for Fib Retracement levels

Adani Ports - Fib Retracement Looks good to me to Go long above 328.8 (High of the day) for 332, 335, 338, 340 with SL at 325/327 based on Target and Time Frame.
Disclaimer:
Being an Engineer + MBA Finance, I bet on my Strong Fundamentals & analytical skills! But I am new to technical analysis & trading (3 months now). Every weekend,I study some new trading concepts and publish analysis & take trades on them. There are NOT trading advice!
The intention is to gather feedback on them, so please drop in a comment if you find areas of improvement.
& If the idea makes sense to you - please do Like to give me confidence to take trades on them.

Cholafin - Evening Star + Fib retracement Short below 211 for 207, 205, 203, 201 with SL at 214.5
Risk averse may want to enter below 207.

phi (0.618), Golden Ratio(Spiral), Fibonacci ratio, NIFTY.We created a parallel channel by looking at market pivots that have lines (a), (b),....(e). If look at this chart and drawing minutely, then you will found that where are maximum points(dots). That is called gravitation to attract the price value. In the future, while the pullback price tries to test this line in the coming days.
Fibonacci ratio, Many traders know this , but few know how to apply it .
three market ranges (1,2,3) which range defines
the 50 percent division at 6926.8.
Let's check the shortest range (3):
Look at "a" and "b"
another range (2)
Look at "c" and "d" .
Let's check the whole picture.
The range of applied for the fib. retracement if perfect known after applying everything above and confirmed.
I am going to remove everything and just keep a 50% division of range.
Now check out this both range of "a" and "b" marked.

HDFCLIFE 4H BULLISH GARTLEY !!BUY IN THE RANGE OF 540-544 ONLY !!
SL AND TARGETS ARE GIVEN ON THE CHART !!

