Sbicards looks bullish?!!!yes!!!
Sbicards has been travelling inside a expanding channel pattern making successive highs and higher highs and lows and higher lows.
In daily time frame too stock is seen bullish
View changes to bearish on making the lower low(sl level- 829.65)
better to enter after 15 min Volume breakout out as shown
Nothing much more to explain as everything seems clear on looking @ chart!!!
Just my view...not a tip nor advice!!!!
Thank you,
mmjimm
Financials

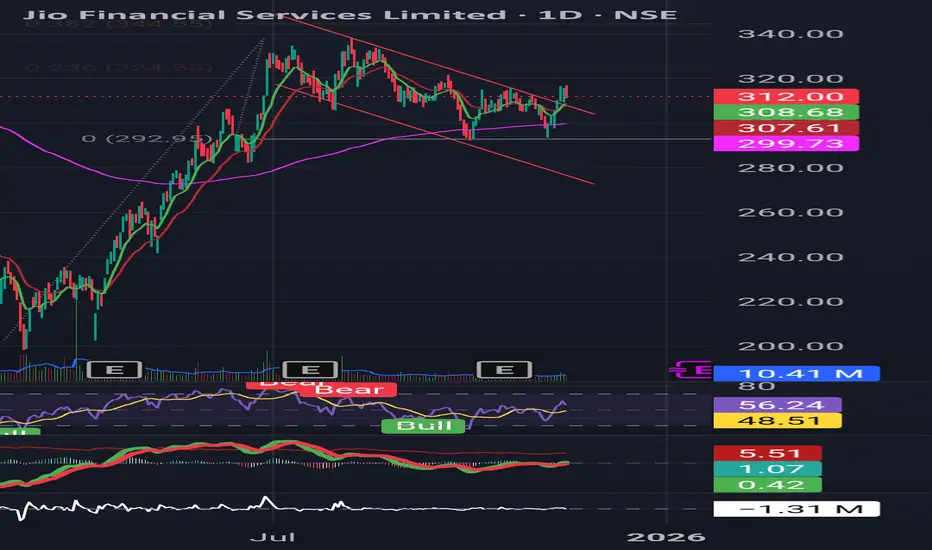
Jio Financial – Breakout Base Forming | Momentum Rebuilding
Structure
Price forming a clean ascending triangle with horizontal resistance near ₹285–289.
Higher lows forming consistently → accumulation behaviour visible.
Trend & Momentum
Trading above 21 EMA and 200 EMA, trend supportive.
RSI holding above 55, bull-range intact.
MACD flattening & attempting a positive crossover.
Volume
Contraction during consolidation → typical pre-breakout behaviour.
Key Levels
Breakout Trigger: Close above ₹289
Supports: ₹270 → ₹263
Invalidation: Close below ₹263
Bias
Bullish above breakout zone
Monitoring for volume expansion and strong close.
Exploring Financial Market Types1. Money Market
The money market is a segment of the financial market that deals with short-term borrowing and lending of funds, usually with maturities of one year or less. It is primarily used by corporations, financial institutions, and governments to manage short-term liquidity needs.
Key Instruments in the Money Market:
Treasury Bills (T-Bills): Short-term debt instruments issued by governments to raise funds. They are considered risk-free and highly liquid.
Commercial Papers (CPs): Unsecured promissory notes issued by corporations to meet short-term funding needs. They generally have maturities ranging from a few days to nine months.
Certificates of Deposit (CDs): Time deposits issued by banks that pay a fixed interest upon maturity.
Repurchase Agreements (Repos): Short-term borrowing agreements where securities are sold and later repurchased at a predetermined price.
Functions:
Liquidity Management: Provides short-term funds to banks, corporations, and governments.
Efficient Allocation: Facilitates smooth functioning of the banking system.
Monetary Policy Transmission: Central banks use the money market to implement monetary policy through instruments like repos and T-bills.
The money market is characterized by low risk and relatively lower returns compared to long-term markets. Its efficiency ensures that the economy maintains liquidity and stability.
2. Capital Market
Capital markets deal with long-term funds, generally with maturities exceeding one year. They are crucial for economic growth as they enable corporations and governments to raise funds for investments in infrastructure, expansion, and other productive activities. Capital markets are broadly divided into primary markets and secondary markets.
a. Primary Market:
Also known as the new issue market, it is where new securities are issued and sold to investors.
Initial Public Offerings (IPOs): Companies raise equity by offering shares to the public for the first time.
Bond Issuance: Governments and corporations raise debt funds by issuing bonds.
b. Secondary Market:
Once securities are issued in the primary market, they are traded in the secondary market. Examples include stock exchanges like the New York Stock Exchange (NYSE), NASDAQ, and Bombay Stock Exchange (BSE).
Functions of Capital Markets:
Capital Formation: Enables businesses to raise funds for long-term growth.
Investment Opportunities: Provides a platform for individuals and institutions to invest their savings in productive assets.
Price Discovery: Helps determine the market value of securities through supply-demand dynamics.
Liquidity: Secondary markets allow investors to buy and sell securities easily, ensuring liquidity.
Participants in Capital Markets:
Retail investors
Institutional investors (mutual funds, pension funds)
Investment banks and brokers
Regulatory authorities (SEBI, SEC)
Capital markets are more volatile than money markets but offer higher potential returns due to the long-term nature of investments.
3. Derivative Markets
Derivative markets are financial markets where instruments derived from underlying assets are traded. The underlying assets can include stocks, bonds, currencies, commodities, or market indices. Common derivatives include futures, options, forwards, and swaps.
Purpose of Derivatives:
Hedging: Investors use derivatives to manage or mitigate risk associated with price fluctuations.
Speculation: Traders aim to profit from price movements in the underlying asset.
Arbitrage: Derivatives allow traders to exploit price differences across markets.
Types of Derivative Instruments:
Futures: Contracts obligating the purchase or sale of an asset at a predetermined price on a specific future date.
Options: Contracts that give the buyer the right, but not the obligation, to buy or sell an asset at a set price within a certain period.
Forwards: Customized contracts between two parties to buy or sell an asset at a specified future date and price.
Swaps: Agreements to exchange cash flows or other financial instruments between parties.
Derivative markets play a vital role in financial risk management but are complex and may involve significant leverage, making them riskier than money or capital markets.
4. Foreign Exchange Market (Forex)
The foreign exchange market, or Forex, is where currencies are bought and sold. It is the largest financial market globally, with trillions of dollars traded daily. Forex facilitates international trade, investment, and tourism by providing liquidity in different currencies.
Key Features:
Decentralized Market: Operates 24/7 without a central exchange.
Participants: Banks, corporations, central banks, hedge funds, and retail traders.
Major Instruments: Spot transactions, forwards, futures, and options in currencies.
Functions:
Currency Conversion: Enables businesses to transact internationally.
Hedging Exchange Rate Risk: Companies can hedge against fluctuations in currency values.
Speculation: Traders profit from currency movements.
Global Liquidity: Supports global trade and investment flows.
The Forex market is highly liquid and volatile, influenced by macroeconomic factors, geopolitical events, and central bank policies.
5. Commodity Markets
Commodity markets are where raw materials and primary products are traded. These markets include energy, metals, and agricultural commodities. Trading can occur through physical markets or financial instruments such as futures and options.
Types of Commodities:
Agricultural Products: Wheat, rice, coffee, sugar.
Metals: Gold, silver, copper, platinum.
Energy: Crude oil, natural gas, coal.
Functions of Commodity Markets:
Price Discovery: Determines the fair market value of commodities through supply and demand.
Risk Management: Producers and consumers hedge against price volatility.
Investment Opportunities: Investors diversify portfolios by including commodities.
Economic Indicator: Commodity prices reflect economic trends and inflation expectations.
Commodity markets can be highly volatile due to weather conditions, geopolitical events, and global demand-supply dynamics.
6. Other Financial Market Segments
In addition to the major market types, several specialized financial markets exist:
Insurance Market: Provides risk management solutions against unforeseen events.
Pension Funds Market: Manages retirement savings and invests in long-term securities.
Credit Market: Focuses on lending and borrowing of debt instruments.
Venture Capital and Private Equity Markets: Provides funding to startups and private companies.
These specialized markets complement traditional markets by addressing specific financial needs and enhancing overall market efficiency.
Conclusion
Financial markets are diverse, dynamic, and interconnected. They are crucial for economic growth, providing platforms for capital formation, liquidity, risk management, and investment. Each market type—money, capital, derivatives, forex, and commodities—serves unique functions and caters to different investor needs. Participants range from retail investors to multinational corporations and central banks, collectively shaping the global financial ecosystem. Understanding these markets enables investors, policymakers, and businesses to make informed decisions, manage risks effectively, and optimize returns. As the world becomes increasingly globalized and technologically driven, financial markets continue to evolve, creating new opportunities and challenges in the pursuit of economic growth and financial stability.
Introduction and Types of Financial Markets1. Introduction to Financial Markets
A financial market is a marketplace where buyers and sellers engage in trading financial assets such as stocks, bonds, currencies, and derivatives. These markets play a crucial role in the financial system by ensuring the allocation of resources, facilitating liquidity, and enabling price discovery.
1.1 Definition
Financial markets can be defined as structured systems through which financial instruments are issued, bought, sold, or exchanged. These instruments represent claims on real assets or future income and include equities, debt instruments, currencies, and derivatives.
Key definitions:
Investopedia: "A financial market is any marketplace where trading of securities occurs, including the stock market, bond market, forex market, and derivatives markets."
Mishkin and Eakins: "Financial markets are markets where funds are transferred from savers to borrowers."
1.2 Importance of Financial Markets
Financial markets serve as a backbone for economic growth. Some of their major functions include:
Capital Formation: Financial markets channel funds from savers to investors, facilitating business expansion and economic development.
Liquidity: Investors can quickly buy or sell financial instruments, ensuring access to cash when needed.
Price Discovery: Financial markets determine the price of assets based on supply and demand dynamics.
Risk Management: Markets offer instruments such as derivatives to hedge against price fluctuations.
Efficiency: Efficient markets ensure optimal allocation of resources, reducing the cost of capital for businesses.
Economic Indicator: The performance of financial markets often reflects the health of an economy.
2. Key Functions of Financial Markets
Financial markets are not just for trading—they perform several vital functions that sustain the economy:
Mobilization of Savings: They attract individual and institutional savings and channel them into productive investments.
Facilitating Transactions: They enable the smooth transfer of funds between buyers and sellers.
Reducing Transaction Costs: Standardized processes reduce the cost of trading and make markets efficient.
Providing Marketability: Investors can sell securities quickly in liquid markets without significant losses.
Credit Availability: Financial markets provide mechanisms for borrowing and lending funds for various purposes.
Investment Opportunities: They provide diverse options for investing based on risk-return preferences.
Regulation and Stability: Well-regulated financial markets ensure transparency, fairness, and stability.
3. Classification of Financial Markets
Financial markets can be classified based on different criteria, such as the type of instrument traded, maturity period, and mode of trading. Broadly, they are divided into money markets and capital markets.
3.1 Money Market
The money market deals with short-term debt instruments that typically mature within one year. It is essential for managing liquidity in the economy.
Characteristics:
Short-term instruments
Low risk and low returns
High liquidity
Participants include commercial banks, corporations, and governments
Major Instruments in Money Market:
Treasury Bills (T-Bills): Government-issued short-term securities with maturities ranging from 91 to 364 days.
Commercial Paper (CP): Unsecured, short-term promissory notes issued by corporations to meet working capital needs.
Certificates of Deposit (CDs): Time deposits offered by banks, tradable in secondary markets.
Repurchase Agreements (Repos): Short-term borrowing using securities as collateral.
Significance: Money markets allow governments, banks, and corporations to efficiently manage short-term funding requirements.
3.2 Capital Market
The capital market deals with long-term securities with maturities beyond one year. It is divided into the primary market and the secondary market.
3.2.1 Primary Market
The primary market is where new securities are issued for the first time. It is crucial for capital formation.
Initial Public Offering (IPO): Companies raise funds from the public by issuing shares.
Follow-on Public Offer (FPO): Additional shares are issued by a company after an IPO.
Private Placements: Securities are sold directly to a limited number of institutional investors.
Rights Issue: Existing shareholders are offered new shares proportionate to their holdings.
Significance: The primary market provides the initial funding for companies, helping them expand operations and invest in growth.
3.2.2 Secondary Market
The secondary market is where previously issued securities are traded between investors.
Stock Exchanges: Organized platforms like NYSE, NASDAQ, and NSE facilitate trading of equities.
Over-the-Counter (OTC) Market: Securities are traded directly between parties without a centralized exchange.
Significance: Secondary markets provide liquidity, enabling investors to buy or sell securities easily, while also helping in price discovery.
4. Types of Financial Markets Based on Instruments
Apart from the money and capital market distinction, financial markets can also be classified based on instruments:
4.1 Stock Market (Equity Market)
Deals in company shares.
Provides investors ownership in corporations.
Helps companies raise equity capital for growth.
Examples: NYSE, NASDAQ, BSE, NSE.
4.2 Bond Market (Debt Market)
Deals in bonds and debentures issued by governments and corporations.
Investors lend money and receive periodic interest.
Less risky than equities but offer fixed returns.
Examples: Government bond markets, corporate bond markets.
4.3 Foreign Exchange Market (Forex)
Involves the trading of currencies.
Ensures liquidity for international trade and investment.
Influenced by macroeconomic factors like inflation, interest rates, and geopolitical events.
Participants: Central banks, commercial banks, multinational corporations, and retail traders.
4.4 Derivatives Market
Deals in contracts whose value is derived from underlying assets like stocks, bonds, currencies, or commodities.
Includes futures, options, swaps, and forwards.
Used for hedging risk and speculation.
Significance: Derivatives help investors manage financial risk efficiently.
4.5 Commodity Market
Trades raw materials like gold, silver, oil, and agricultural products.
Includes spot markets (immediate delivery) and futures markets (delivery at a future date).
Provides a platform for price discovery and risk management.
4.6 Cryptocurrency Market
Emerging digital asset market trading cryptocurrencies like Bitcoin, Ethereum, and stablecoins.
Operates 24/7 globally, often outside traditional financial systems.
High risk but offers significant opportunities for diversification and speculative trading.
5. Classification Based on Trading Mechanism
Financial markets can also be divided based on how trading occurs:
Organized/Exchange-Traded Markets: Regulated platforms with standardized contracts, like stock exchanges.
Over-the-Counter (OTC) Markets: Decentralized trading between two parties, e.g., Forex OTC markets.
Electronic/Online Markets: Internet-based platforms facilitating global trading with high efficiency and low costs.
6. Participants in Financial Markets
Financial markets include a wide range of participants who perform specific functions:
Investors: Individuals and institutions seeking returns.
Issuers: Companies and governments raising funds.
Intermediaries: Banks, brokers, and investment firms facilitating transactions.
Regulators: Authorities like SEBI, SEC, and RBI ensuring transparency and protecting investors.
Speculators: Traders aiming to profit from price fluctuations.
Hedgers: Participants managing risk using derivatives or other financial instruments.
7. Modern Trends in Financial Markets
Globalization: Markets are increasingly interconnected, enabling cross-border capital flows.
Technological Advancements: High-frequency trading, blockchain, and AI-driven analytics are transforming trading.
Sustainable Finance: ESG and green bonds are gaining importance.
Cryptocurrencies & Digital Assets: Digital currencies are expanding market opportunities.
Fintech Innovations: Mobile trading platforms and robo-advisors are democratizing access to markets.
8. Conclusion
Financial markets are the lifeblood of modern economies, facilitating the flow of capital, promoting investment, and enabling risk management. From money markets dealing with short-term debt instruments to capital markets providing long-term funding, each segment has a distinct role in economic development.
The evolution of financial markets—from traditional equity and debt instruments to sophisticated derivatives and digital assets—highlights their adaptability and centrality to global financial stability. Understanding these markets is essential for investors, policymakers, and businesses seeking to navigate the complex financial landscape efficiently.

Behavioral Finance and Trader Psychology:Introduction
The traditional models of finance and economics often assume that individuals are rational decision-makers, consistently acting in their best interests to maximize utility. However, real-world financial behavior frequently deviates from these assumptions. Behavioral finance and trader psychology delve into the psychological influences and biases that affect financial decision-making, challenging the notion of rational actors in the market.
Behavioral Finance: An Overview
Definition and Emergence
Behavioral finance is a subfield of behavioral economics that examines how psychological factors influence financial behaviors and market outcomes. It emerged in the late 1970s as a response to the Efficient Market Hypothesis (EMH), which posits that asset prices reflect all available information and thus always trade at their fair value. Behavioral finance contends that cognitive biases and emotional factors lead to market anomalies and inefficiencies.
Key Concepts in Behavioral Finance
Cognitive Biases: These are systematic patterns of deviation from norm or rationality in judgment, whereby inferences about other people and situations may be drawn in an illogical fashion. Common cognitive biases include:
Confirmation Bias: The tendency to search for, interpret, favor, and recall information in a way that confirms one's preexisting beliefs or hypotheses.
Anchoring Bias: The reliance on the first piece of information encountered (the "anchor") when making decisions.
Overconfidence Bias: The tendency to overestimate one's own abilities, knowledge, or control over events.
Availability Bias: The tendency to overestimate the likelihood of events based on their availability in memory.
Emotional Biases: These biases arise from emotions and feelings that influence decision-making. Examples include:
Loss Aversion: The tendency to prefer avoiding losses rather than acquiring equivalent gains; it's better to not lose $5 than to find $5.
Regret Aversion: The reluctance to make decisions due to the fear of making a wrong choice and the potential for future regret.
Herd Behavior: The tendency to mimic the actions (rational or irrational) of a larger group, often leading to asset bubbles or crashes.
Market Implications
Behavioral finance explains various market phenomena that traditional theories struggle with, such as asset bubbles, market crashes, and anomalies like the January effect or momentum. It suggests that markets are not always efficient and that prices can deviate from their intrinsic values due to collective psychological factors.
Trader Psychology: The Emotional Landscape of Trading
Definition and Importance
Trader psychology refers to the emotional and mental state of a trader, which significantly impacts their trading decisions and performance. Understanding trader psychology is crucial because emotions like fear, greed, and hope can lead to impulsive decisions, overtrading, or holding onto losing positions longer than rational analysis would suggest.
Common Psychological Challenges
Fear and Greed: These are the two primary emotions that drive market behavior. Fear can lead to panic selling during downturns, while greed can result in chasing after high-risk, high-reward opportunities during bull markets.
Overtrading: Driven by the desire to make profits or recover losses, traders may engage in excessive trading, leading to higher transaction costs and potential losses.
Loss Aversion: Traders may hold onto losing positions longer than advisable, hoping the market will turn in their favor, due to the psychological pain associated with realizing a loss.
Confirmation Bias: Traders may seek information that confirms their existing beliefs about a trade, ignoring contradictory evidence, which can lead to poor decision-making.
Strategies for Managing Trader Psychology
Developing a Trading Plan: Having a clear plan with defined entry and exit points can help mitigate emotional decision-making.
Risk Management: Setting stop-loss orders and position sizes can prevent significant losses and reduce emotional stress.
Mindfulness and Emotional Awareness: Practicing mindfulness can help traders recognize emotional reactions and prevent them from influencing trading decisions.
Continuous Learning: Educating oneself about psychological biases and their impact on trading can lead to more rational decision-making.
Integrating Behavioral Finance and Trader Psychology
The integration of behavioral finance and trader psychology offers a comprehensive understanding of financial decision-making. While behavioral finance provides a framework for understanding how biases and emotions affect market outcomes, trader psychology focuses on the individual trader's mental and emotional state. Together, they highlight the importance of psychological factors in financial markets and the need for strategies to mitigate their negative effects.
Conclusion
Behavioral finance and trader psychology underscore the complexity of financial markets and the significant role of human behavior in shaping market outcomes. By acknowledging and understanding the psychological factors that influence decision-making, investors and traders can develop strategies to make more informed and rational financial decisions. This holistic approach not only enhances individual performance but also contributes to the overall efficiency and stability of financial markets.
Long bet in West Coast Paper Mills.Financial highlights.
Over the past five years, the company has achieved an impressive compound annual growth rate (CAGR) of 33.9% in terms of its profit.
Company has a good return on capital employed (ROCE) of 61.5 %.
Stock has negligible debt to equity of 0.09. /list
Technicals.
Currently price is at somewhere between support and resistance level of the trend line, some position can be made either it gives a breakout, or it comes back to support.
My commentary
West Coast Paper Mills Ltd is one of the oldest and the largest producers of paper for printing, writing, and packaging in India.
Paper consumption expenditure is expected to double from $1.5 trillion in 2020 to $3 trillion by 2030.(Source: The Hindu).
We can long on this, if it falls as it is more likely to happen, more quantity can be added.
This is only for an educational purpose, Don't take it as a trade calls. I am not a Sebi registered

What are ratios to analyse any banking stocksHAPPY REPUBLIC DAY 🇮🇳
Today we will study ratios for analysing any banking/ non- banking stock.
Key Ratios are -
1. Net Interest Margin (NIM)
2. Provision Non Performing Assets (PNPA)
3. Loan to Assets Ratio
4. Return on Assets Ratio (ROA)
5. Capital Adequacy Ratio
6. Gross NPA
7. Net NPA
8. CASA Ratio
9. Cost to Income ratio
---------------------------------------------------------------------
1. Net Interest Margin (NIM)
1. Net Interest Margin = ( Investment Income –
Interest Expenses ) / Average Earning Assets.
2. Positive Net Interest Margin shows that bank is earning more money in the form of interest than its cost of funding investments.
3. There are several factors that affect bank NIM. One of the most significant is interest rates. When interest rates are high, banks are able to earn more from loans and investments, which increases their NIM. When interest rates low, banks earning will loans and investments decrease, which lead lower NIM.
4. In summary, Net Interest Margin is important measure of bank's profitability and its ability to generate income from its existing assets. NIM is affected by interest rates and competition. Banks with a high NIM are generally considered strong financial position and better to grow and invest in new opportunities.
Let's look at example
Bank in India has total assets of ₹1,00,000 crore consist of loans and investments. The bank has total deposits of ₹80,000 crore and it pays interest rate of 4% on savings accounts and 6% on Fix Deposit The bank total interest income for the period is ₹2,400 crore which is earned by loans and investments. The bank total interest expense for period is ₹1,600 crore, which is paid to depositors.
To check the NIM we take the bank net interest income (NII) of ₹800 crore (₹2,400 crore in interest income - ₹1,600 crore interest expense) and divide by the bank average earning assets of ₹90,000 crore (average of total assets and total deposits).
NIM = NII / Average Earning Assets
NIM = ₹800 crore / ₹90,000 crore
NIM = 0.89%
Bank NIM is 0.89% every ₹100 of assets the bank is earning ₹0.89 of net interest income. This NIM is a measure of the bank efficiency in generating income from assets and can be used to compare it with other banks and over time.
NIM in India will be lower than developed countries due to lower lending rates and high competition among bank.
-=-=-=-=
2. Provision Non Performing Assets (PNPA)
1. An asset, including a leased asset, becomes non performing when it ceases to generate income for the bank.
2. Provision for Non Performing Assets (NPA). The amount keep aside by bank, to cover it's potential losses from loans and other credit related assets that have been non performing.These provisions are made when a bank expects that some of its borrowers will default on their loans, and the bank needs to set aside funds to cover the potential loss.
3. In summary, Provision for Non Performing Assets (NPA) Banks are required to make provisions for NPA on a regular basis, quarterly basis, amount of provisions is disclosed in the financial statements. Provision for NPA is an important measure of a bank's financial health, Help bank to absorb the impact of loan defaults and manage credit risk.
Provisions for NPA is closely watched by investors, analysts, and regulators, it helps them to assess the bank's credit risk.
Let's look at example
Bank total loans of ₹50,000 crore. ₹2,000 crore classified Non performing Assets (NPA) borrowers defaulted their payments more than 90 days. Bank required to set aside certain percentage of the NPA loans as PNPA as per the Reserve Bank of India's guidelines. The current PNPA provisioning ratio is 15%.
To get PNPA we multiply the NPA loans of ₹2,000 crore with the PNPA provisioning ratio of 15%.
PNPA = NPA loans x PNPA provisioning ratio
PNPA = INR 2,000 crore x 15%
PNPA = INR 300 crore
-=-=-=-=
3. Loan to Assets Ratio
1. Loan to Assets ratio can help investors obtain complete analysis of bank's operations. Banks that have relatively higher Loan to Assets ratio banks with lower levels of Loan to Assets ratios derive a relatively larger portion of their total incomes from more diversified, noninterest earning sources, such as asset management or trading. Banks with lower Loan to Assets ratios may fare better when interest rates are low or credit is tight.
2. In summary, Loan to Asset ratio is financial metric compares bank total loans to total assets. It's used to measure bank leverage assess the level of risk associated with lending activities. Higher Loan to Assets ratio indicates that a bank is more heavily reliant on lending and is more leveraged and risky, while a lower ratio indicates that the bank is less risky.
Let's look at example
Bank has total assets ₹1,00,000 crore, total loans ₹70,000 crore. to get Loan to Assets Ratio we divide the total loans by the total assets.
Loan to Asset Ratio = Total Loans / Total Assets
Loan to Asset Ratio = ₹70,000 crore / ₹1,00,000 crore. Loan to Asset Ratio = 0.7.
Bank's Loan to Assets Ratio is 0.7 / 70% (0.7*100) bank assets in form of loans. A higher Ratio indicates that bank is heavily invested in lending activities, which can be sign of more aggressive lending strategy. it's also increases the risk of default. Than higher risk of NPA. Banks required to maintain minimum level of Capital Adequacy Ratio as per the Reserve Bank of India's (RBI) guidelines.
-=-=-=-=
4. Return on Assets Ratio (ROA)
1. Return on Assets = Net Income / Total Assets
2. The higher ratio means assets are well managed and low ratio means resources didn't used effectively compared to the industry and competitors.
3. In summary, ROA is financial ratio measures profitability of company in relation to total assets. It is calculated by dividing the company's
net income by its total assets. This ratio is useful to compare the performance of company with its peers in the same industry. It is an important metric used to evaluate a company's overall efficiency and performance but it's important to keep in mind that high ROA not necessarily mean that company have strong financial position.
Let's look at example
Bank has total assets of ₹100 billion and net income of ₹5 billion. To get ROA we divide the net income by total assets.
ROA = Net Income / Total Assets
ROA = ₹5 billion / ₹100 billion
ROA = 0.05 or 5%.
Bank ROA is 5% For every ₹100 billion of assets, the bank generates ₹5 billion of net income. Higher ROA show that bank is profitable and efficient in utilizing assets. It's important to note this ratio is sensitive to the size of the bank It's better to compare the ROA of a bank with other banks of similar size.
-=-=-=-=
5. Capital Adequacy Ratio
1. The Capital Adequacy Ratio helps make sure banks have enough capital to protect depositors money.
2. Banks are required to maintain a certain level of Capital Adequacy Ratio as per the regulations set by central bank to ensure that they have sufficient capital to meet the potential losses and continue their operations even in adverse situations.
3. It helps maintain the stability of the financial system by ensuring that banks can withstand in unexpected situation.
Let's look at example
In India, the Reserve Bank of India (RBI) sets the minimum Capital Adequacy Ratio for banks at 9%. which means that they must hold capital worth at least 9% of their total risk-weighted assets.
Bank in India with total assets of ₹100 billion and risk-weighted assets of ₹80 billion must maintain minimum capital of ₹7.2 billion (9% of ₹80 billion) to meet the Capital Adequacy Ratio requirement set by the RBI.
It's important to note that, the Banks with a higher Capital Adequacy Ratio are considered to have a better ability to absorb unexpected losses.
-=-=-=-=
6. Gross NPA
1. Gross Non Performing Assets (GNPA) is refer to the total value of loans or advances that have been classified as Non Performing Assets. These are loans or advances the borrower has defaulted on repayment or interest for certain time. loan is classified as an NPA if the borrower has not made any payment for period of 90 days or more.
2. A high ratio of GNPA to total loans indicates a higher level of credit risk and potentially weaker financial condition for the bank.
Let's look at example
Bank has total loans of ₹100 billion and ₹20 billion are classified Non Performing Assets (NPA). The bank Gross Non Performing Assets (GNPA) would be INR 20 billion.
we see the ratio of GNPA to total loans we get 0.2 (₹20 billion / ₹100 billion). This ratio of 20% indicates that 20% of the bank loans are classified as NPA. This high ratio may indicate the bank is facing high level of credit risk it could be cause for concern.
It's important to note that Gross NPA ratio is used in conjunction with other financial indicators to understand overall financial health of bank and single indicator may not enough to make a conclusion.
-=-=-=-=
7. Net NPA
1. Any financial security owned by a bank is considered an asset. The interest we pay on loans is the primary source of income for banks these loans are classified as assets for bank's.
when borrowers can't repay the amount these assets are classified as Non Performing Assets (NPA) because they are not generating any income for the bank's.
2.If loan provided by bank is overdue more than 90 days from the borrower end comes under NPA. If loan amount is unpaid more than 1 year from due date then it's a doubtful debt and if it’s unpaid more than 3 years then loss of an asset or default account.
Net Non-Performing Asset = Gross NPA – Provisions.
Gross NPA = Total Gross NPA/Total Loans given.
Impact of NPA
Due to higher NPA rates, banks will suffer significant revenue losses that will potentially affect their brand image. insufficient funds, banks will have to increase the interest rates on loans to maintain their profit margin.
Let's look at example
Bank has total loans of ₹100 billion and ₹20 billion are classified as Non Performing Assets (NPA). The bank is required to make provisions for ₹10 billion against these NPA. The bank Gross Non-Performing Assets (GNPA) would be ₹20 billion and Net Non Performing Assets (Net NPA) would be ₹10 billion (₹20 billion - ₹10 billion).
If we see the ratio of Net NPA to total loans we get 0.1 (INR 10 billion / INR 100 billion). This ratio of 10% indicates that 10% of the bank's loans classified as NPA after making necessary provisioning. This ratio gives a clearer picture of bank's financial health than just Gross NPA ratio as it takes into account the provisions made against NPA.
-=-=-=-=
8. CASA Ratio
1. CASA (Current Account and Saving Account) it is measure the proportion of bank deposits that are in the form of current and savings accounts.
2. The ratio is calculated by dividing the total value of current and savings account deposits by the total deposits. It is typically expressed as percentage. Higher CASA ratio indicates that bank have larger proportion of stable deposits. This is because banks can use these deposits to fund their lending activities at a lower cost which improves bank's net interest margin.
Let's look at example
Bank has total deposits of ₹200 billion and ₹150 billion in form of current and savings accounts. The bank CASA ratio would be 75%.
This ratio indicates that three fourth of the bank deposits are in the form of current and savings accounts which are considered the stable form of deposits. This high ratio is considered positive sign. Stable deposits can used to fund lending activities lower cost.
High CASA ratio the bank will have access to cheaper funding which will improve it's net interest margin. This means that the bank will be able to offer loans at a lower rate of interest. which will make it more competitive in the market and attract more customers. And bank will also have more stable funding which will make it less vulnerable to market fluctuations and interest rate changes.
Asset quality, capital adequacy play important roles in assessing a bank's overall financial condition.
-=-=-=-=
9. Cost to Income ratio
1. Cost to Income Ratio (CIR) measure company efficiency by comparing it's operating expenses to it's revenue. calculated by dividing the total operating expenses by the total revenue and expressed in percentage.
2. Lower (CIR) indicates that company more efficient in managing expenses and able to generate more income for every unit of expenses. while higher (CIR) indicates that company less efficient in managing it's expenses and is generating less income for every unit of expenses.
Let's look at example
Bank A with a high CIR.
Bank has total operating expenses of ₹10 billion and total revenue of ₹15 billion. The bank's CIR is 67% (₹10 billion / ₹15 billion). High CIR indicates that the bank is not very efficient in managing its expenses and is generating less income for every unit of expenses. The bank may need to review its cost structure and implement measures to reduce expenses in order to increase its efficiency and profitability.
Bank B with a low CIR:
A bank has total operating expenses of ₹5 billion and total revenue of ₹15 billion. The bank CIR is 33% (₹5 billion / ₹15 billion). This low CIR indicates that the bank is efficient in managing its expenses and is able to generate more income for every unit of expenses. The bank able to invest in growth opportunities and increase profitability.
I hope you found this helpful.
Please like and comment.
Keep Learning,
Thank you for reading!

GUJRAT GAS LTD - TRIANGLENSE:GUJGASLTD
Gujgas has been consolidating in a tight range on a daily timeframe and formed a triangle.
it has a resistance of 528 if it breaks and closes above it on day TF then will enter above 530.
Cmp - 516
my stop - 497
take profit marked on the chart and that's a good resistance too if it breaks then it can trigger a further move up.
Always trade with stop loss to avoid big drawdowns.
keep learning,
happy trading.

CFTC COT Plots - Financials / Legacy / DisaggregatedCFTC publishes on a weekly basis COT reports in 3 formats - Legacy, Disaggregated, Financials.
www.cftc.gov
Big financial / commodity / currency traders keep a watch on this data on a weekly basis. All futures traders should also track this data.
To make it easy to consume, I created 3 indicators to consume this information in a simple way
Financials
Disaggregated
Legacy
Here are some screenshots with examples
Commodities
Currencies
Enjoy the indicators :-)

All you need to know about Caplin Point | Technical, FinancialI daily make educational content videos on financial markets

Ultimate Investing Ideas | Financial and Technical | TechMI daily make educational videos on Financial Markets
The above video contains some Financial Terms and Price action study only

Bajaj Finserv Chart Analysis !!📈 Bajaj Finserv Ltd. 📉
This Stock Broke out from a resistance zone of 16500-16750 which was tested several times and today managed to close above it.
Bias - Long
Target - 18378, 19078
SL - 16100
RR- 1:2
All Important Supports and Resistances are drawn in chart. All levels are on closing basis.
Please have a look and revert back if you need some more study on it.
Disclaimer : Consult Your Financial Advisor Before Taking Any Decision On This Analysis.


BRITANIAprice rejected from AOI & gaved very good rejection. May be it will go back for liquidity grab what do you think about this ?

GUJ GAS SHORT TERM HARMONIC SWING IDEA gujgas ltd swing idea
trade Reason -
1- Bullish Harmonic Pattern
2- trend-line support
3- strong consolidation with high volume
4- fake-out tendency
buy on cmP : 610 TO 640
stop loss at maximum - 584
targets expected - 660,658,699,759,783,+++
Note - before investing pls consider your maximum Risk Aptitude and holding tendency and always trail your sl on cost - to - cost

NIACL The Undervalued One✔️NIACL The Undervalued One✔️
buy @cmp
add @141-45 range
sl below 140
bo above 182
risky players can enter @140-150 range,other can wait for bo.
and
💎Ride The Trend Until The Weight Of Evidence Proves That It Has Been Reversed💎
#skyscraper
#study


Nifty Level For Tomorrow ( Price Action Analysis)If Tomorrow Market open flat and go sideways taking support at 166335 then go long for 50-80 Points or if this level breaks then go short for 100-120 Points
Or
If Market Open big gap up below 16580 then faces resistance then go short or breaks this level then go long for 80-90 points
Or
If Market open Gap down above 16336 taking support then go long with a small risk ratio and if level breaks go shorts
Nifty Resistance :- 16600 -16800
Nifty Supports :- 16350 -16160
All advice is for educational purposes concern your financial advisor.

INDOCO REMEDIES - Medium Term StudyChart Structure:
- Broken out All-Time High (of 2015), pulled back, consolidated a bit, and now ready to go up.
- Price in an uptrend since July 2020.
Volume:
- High volume deliveries this week. Up to 12.41 lac shares were delivered yesterday, whereas average deliveries are 1.23 lacs.
- Yesterday saw the highest delivery of shares in recent times.
Relative Strength:
- Stock become RS+ on 19th April and continuously outperforming Nifty as well as Midcap since then.
- Spread chart breakout happened yesterday.
Financial Highlights:
- Net Revenues saw 29.3% jump in QoQ & 43% YoY.
- PAT increased by 59% QoQ & 130% YoY.
- Co. is continuously increasing its revenues & profits at a medium pace, which tells us the financial health of the company is sound.
- Indoco's Defensive & Enterprises EPS are also been positive throughout the years, which tells us that the company is able to sustain itself without taking any more debts & they are able to monetize their current expenditures for next few years.
About Indoco:
About Indoco Remedies Limited:
Indoco Remedies Ltd., headquartered in Mumbai, is a fully integrated, research-oriented pharma Company with a presence in 55 countries. Indoco, a USD 166 million Company, employs over 6000 people including more than 300 skilled scientists.
The Company has 9 manufacturing facilities, 6 of which are for FDFs and 3 for APIs, supported by a state-of-the-art R&D Centre and a CRO facility. The facilities have been approved by most of the Regulatory Authorities including USFDA and UK-MHRA. Indoco develops and manufactures a wide range of pharmaceutical products for the Indian and international markets. It generates more than 70 million prescriptions annually from over 3,00,000 doctors belonging to various specialties. Indoco has 9 domestic marketing divisions with a strong brand portfolio in various therapeutic segments. Indoco has tie-ups with large generic companies across the globe.


HDFC BANK ( LONG )here we are having a look at HDFC bank as you can see in the photo itself we can clearly see the stock has given breakout from a downward channel and that's a good sign for bulls as we come to the end of June the next month would be playing an important role for this stock since INDEX nifty has already made a new all-time high we are expecting bank nifty to be in the same range or pace since HDFC bank is heavyweight of bank nifty still room to move there are some important levels to look out the stock has tested the zone of 1520 multiple times and it is having high chances of breaking that level in coming days
one can take entry after the breakout of 1520 with STOPLOSS of 55-60 points with the target of 1640 level and the stock is showing some strong long build-up so we can expect bullish move in the coming days
DO FOLLOW YOUR RISK TO REWARD RATIO
Disclaimer- I am not SEBI registered advisor. All views shared are for educational purposes and should not be considered advice of any nature. Learn and Earn.

6000 on Bajaj Finance - Trade Review well, I posted It when it was on the supportive trendline, then again on ATH zones, now 6000 :)
💲💲 FOLLOW me @Averoy_Apoorv_Analysis and get these free analysis :) 💲💲
🔰 {Some info}
➼My name is Apoorv and I am a 2nd year Engineering student, I want to pursue trading as my career, and thus whatsoever setups or trades I potentially see on my charting platform, I post it here and share them with you all.
➼I hope you will love my simple analysis style.
➼Feel free to suggest your view on this as learning is earning here :)
➼I take my trades on my Zerodha account :)
➼These charts are my and only my work, my thought process, just from an educational point of view and no calls.
<<<<<>>>>>

MUTHOOTFIN | Wedge breakout inside triangle pattern - 10%MUTHOOTFIN | Wedge breakout inside triangle pattern - 10%
CMP : 1205 (Dip : 1150)
SL : 1110
Target : 1330
1:3 risk reward setup
