SRF LTD - Long Range Breakout ?Simple Chart - Long Consolidation ( Flag Pattern ). Targets could be higher as well but taking it one by one due to overall market volatility.
Fundamentally :
The company has declared Negative results for the last 7 consecutive quarters
PAT(9M) At Rs 724.72 cr has Grown at -20.67 %
INTEREST(9M) At Rs 286.57 cr has Grown at 21.09 %
ROCE(HY) Lowest at 10.25
However looking at the chart, something has changed fundamentally which is why there is demand coming in from big players.
Specialty Chemical Outlook:-
Anticipate good Agro Demand in Q4 with significant improvement over Q3
Fluorochem Outlook:-
Q4 to perform significantly better ; Supported by higher HFC Volumes.
Packaging Film Outlook:-
Demand -Supply imbalance to continue but will soften.
FLAG

GOLD Triangle BreakoutGold has given a breakout from Triangle Pattern on 1D timeframe. It had been consolidating since November 2024.

EXELFlag formation on monthly chart
use retracement to enter fresh with a perspective of 2-3yrs. consider 19 as your stop loss

Bluestar Cup and handle pattern breakout AC theme, data centre theme, bluestar new star again in bull trend
could possibly be again rally from these levels more upside visible.
strong company strong sector growth strong management and clean chart structure
targets in chart

BALUFORGE - Is it time for the Surge? Technically, this is a continuation consolidation. Usually Wave 3 which is about to start is considered to be the longest. So fingers crossed🤞.
Balu Forge Industries Limited is a leading Indian company that manufactures crankshafts and other forged components for various industries. The company was founded in 1989 and has since expanded its operations to become a preferred supplier of crankshafts to OEMs in India and around the world.
The forging industry plays a crucial role in supporting various sectors, including:
Automotive: Forging is used to manufacture critical components such as crankshafts, gears, and axles.
Aerospace: Forging is used to manufacture lightweight, high-strength components for aircraft and spacecraft.
Energy: Forging is used to manufacture components for wind turbines, hydroelectric power plants, and nuclear power plants.
Construction: Forging is used to manufacture components for heavy machinery, such as excavators and bulldozers.
Balu Forge caters to these sectors by manufacturing a range of forged components, including crankshafts, gears, axles, and other critical components.
In terms of market position in India, Balu Forge is a leading player in the forging industry, with a strong presence in the automotive and aerospace sectors. The company has a market capitalization of around ₹8,962 crore.

GICRE Triangle Breakout 1DGICRE attempting to breakout from a triangle pattern on 1D timeframe. It is also forming a flag pattern on 1W timeframe. Enter after bullish confirmation.

EUR-AUD | 4h | Swing Trading hello traders, i have prepared FX:EURAUD analysis for you. i have set my entry level, stop level and target level on the chart. all i ask from you is to support me with your likes. thank you to everyone who likes it.

Dhruv Consultancy ServicesI see an ascending Flag Patten and a good breakout.
I also expect a retest after may be another good weekly green candle.
Stoploss here can be kept as per your risk appetite.
Having said that I sort of trust this breakout. There are less chances for this to be a fake out.

Gold-> Buyer Back Yet?After suffering significant losses last week, gold has regained its recovery momentum and is trading positively above $2,600 on Monday. The fundamental backdrop supports this recovery. Key resistance levels at $2,518 and $2,628 now divide the market into two distinct zones.
Meanwhile, market participants are awaiting moves from several Fed officials this week to gain further insights into the U.S. interest rate trajectory.
The most likely scenario at the moment is a slight recovery in gold prices following the recent steep sell-off, with expectations for gold to climb higher after several reversals in the USD.
In the medium term, bulls need to reassess U.S. policy planning in December, as the Fed is expected to hold rates steady in January. This has not been fully priced into the market, so any adjustments could pose challenges for gold.
Technically, since the market opened, prices have climbed considerably, increasing the likelihood of resistance capping further upward movement. A false breakout at $2,589 and subsequent consolidation below this zone would strengthen selling pressure. However, there is potential for a retest of $2,618 (Order Block).
Similarly, a failed breakout could trigger selling momentum. But if the fundamentals align strongly in favor of gold, the market may have a chance to shift the local trend from the $2,618 zone.

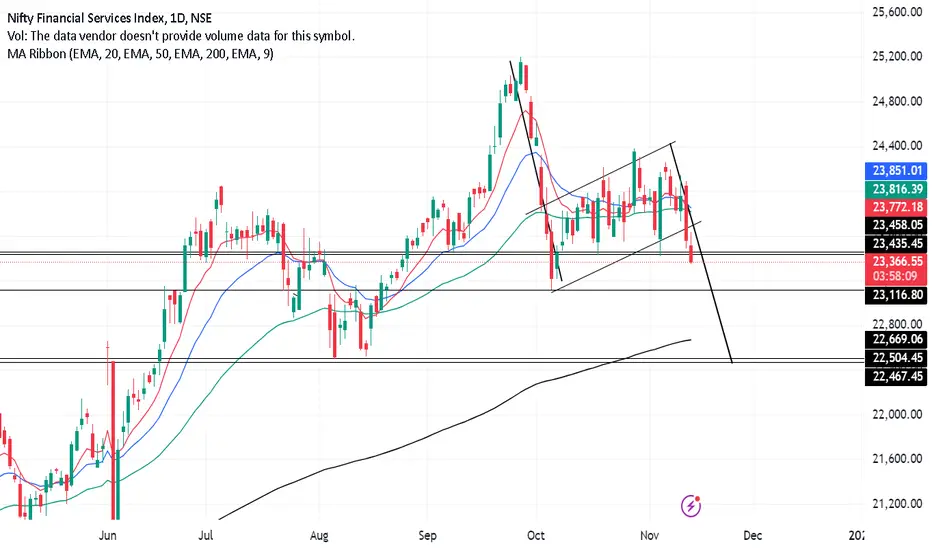
FINNIFTY FALL is on the way. chart has given clear breakdown of the bearish flag pattern in fin nifty.
Quarter numbers of major comps are weak, Inflation is rerouting and now CASA will again go down, sips at peak and retailers will buy this dip.
NBFC and BANKS will suffer more now.

Bitcoin Strategy: Cup & Handle, Flag Pole, Parallel ChannelIf you're aiming to maximize gains using multiple setups across different timeframes, this strategy combines three powerful patterns: the Weekly Cup & Handle, Flag Pole, and Daily Parallel Channel. Here’s how to execute this structured approach for optimal entry, exit, and profit potential.
Weekly Cup & Handle
Timeframe: November 15, 2021 – October 14, 2024
Breakout: Achieved on October 14, 2024
Target: 82,000 (same as the Flag Pole)
The breakout from this long-term Cup & Handle pattern suggests strong bullish momentum and a solid foundation for long-term gains. This setup aligns with the target and stop-loss criteria from the Flag Pole pattern for a consistent strategy.
Weekly Flag Pole Pattern
Timeframe: October 16, 2023 – March 11, 2024
Target: 1 lakh
Stop Loss (SL): 66,000 (below the last swing low)
The weekly Flag Pole pattern reinforces the Cup & Handle trend, providing a shorter-term opportunity within the larger uptrend. Enter in tranches to capture initial momentum and add on pullbacks.
Daily Parallel Channel
Timeframe: March 5, 2024 – October 18, 2024
Breakout: October 18, 2024 (retest completed)
The breakout and retest of the daily Parallel Channel on October 18 offer a shorter-term entry point. Targeting 1 lakh on this setup aligns with the long-term patterns, with Target 1 at 82,000 and Target 2 at 1 lakh.
Execution Strategy
Enter in Tranches: Start your position now and add on each pullback.
Confirm Pullbacks: Look for a reversal on the daily candlestick pattern after each pullback.
Manage Risk: Keep the SL at 66,000, set below the last swing low, to protect your capital.
Summary of Targets
Target 1: 82,000 (aligned with Cup & Handle and Flag Pole)
Target 2: 1 lakh (Parallel Channel breakout)
By combining these setups, you capture both long-term and short-term price movements, maximizing your potential for profit while managing risk effectively.

Morepen Lab - Bullish Flag and Fibonacci RetracementMorepen Lab has formed a bullish flag pattern, and today it has successfully broken out.
The price has retested the Fibonacci level at 38, where it formed a bullish piercing pattern, signaling potential upside momentum.
Price take support of 50 period EMA.
Additionally, this level coincides with a significant demand zone on the chart, suggesting strong buying interest. Keep an eye on this stock for further upward movement

KOTHARI PETROCHEM MAKING A FLAG AND POLE.KOTHARI PETROCHEM is making a Flag and Pole formation. Wait for breakout to enter.

Welspun Living Going to do Well with FUN Welspun Living
Looks good in PARABOLIC UPTREND PATTERN
On Retracing, getting ready for RALLY.
Expected Targets marked in CHART

Buy @kfintech buy today 23/09/2024 target 15% bullish flag pattern for med and breakout done long-term consolidated stock weekly consolidated now ready for bullish signal


Wipro bullish flag patternWipro flag pattern on buy side 15 mins. Expect stock to go on up side upto 532 levels. It might happen in few days time. There is a chance for stock reversal but again it goes up

GOLD: Bullish - FLAG detected + Breakout of the range.GOLD: Bullish - FLAG detected + Breakout of the range.
1- A "Head Shoulders" has been detected and we did a perfect Take profit ( TP1) at 2 395$.
2- When we break a range the Take profit should be the Height of the range.
Then the TP2 is expected around 2 518$.
3- Plus we can also consider that the range is like a flag and then the TP3 ( green arrow) is expevted around 3 030$
The red horizontals are retracements regarding ICHIMOKU levels .
However a retracement Fibonacci gives a target lower around 2 100$.
Be careful

TATA ELXSI Triangle BreakoutTata Elxsi has given a Triangle Breakout on 1D timeframe yesterday with a high volumes. It is apparently retesting its resistance.
It has also formed a Flag pattern on 1W timeframe and attempting to give a breakout on 1W chart.

Flag pattern on daily basisLupin can continue its move upward once break 1455.
On chart we can observer Flag pattern.
Strong Bullish move expected.
Vision: short term

Tata Motors - Follow Up Flag PatternTata motors has created a good flag pattern, the height of the pole is 500 points,
Today - 25th July it has given a breakout from the pattern.
Tata motors will hit 1500++ levels due to Flag pattern breakout out.

Alembic Pharma-Possible continuation of trade!Pharma stocks have shown great bull run in past 6 months.
I had shared idea of APL around 550 levels.
Currently, stock is looking strong for continuation of rally post breakout.
Happy trading.
Please follow me if you like my analysis!
