EXIDEIND | Flag breakout - Trying to capture 30-40%EXIDEIND | Flag breakout - Trying to capture 30-40%
CMP : 185
SL : 165
Target : 220, 240
FLAG

a chart to follow this month1. flag and pole on weekly
2. borderline retracement 25 %
3. breakout will trigger low cheat entry
4. structure of uptrend is intact

#POLYMED #SHORTTERM #SWING #NSEFlag Pattern on Weekly time Frame.
Breakout was witnessed and it was followed up by a retest which is always a good sign.
An Inverted Head and Shoulder Pattern can also be seen with the right shoulder in progress marching towards the neckline.
MACD structure also looks very positive.

VARDHMAN STEEL is SPECIAL !Market Cap 1,111 Cr.
Promoter holding 60.8 %
Pledged 0%
Dividend Yield 1.25 %
Intrinsic Value 483
Stock P/E 10.4
Industry P/E 18.2
Debt to equity 0.26
ROCE 25.7 %
ROE 19.8 %
OPM 9.74 %
EBIDT growth 3Years 42.9 %
Free Cash Flow 24.2 Cr.
EPS 26.4 vs EPS last year 24.8 vs EPS preceding year 10.9
Vardhman Special Steels is engaged in manufacturing of Billets, Steel bars & Rods and Bright Bars of various categories of special and alloy steels since 1973 which caters to sectors such as Engineering, Automotive, Tractor, Bearing and Allied Industries.
The Co is amongst India’s Leading Steel Bar Producers for Automotive Applications.
The Co. has the capacity to manufacture 2 lakh TPA of steel billets and also 2 lakh TPA of steel rolled products. It has received approval from the Ministry of Environment for expanding its rolled-products capacity from 2 lakh TPA to 2.80 lakh TPA. The Co. invested Rs. 35 crore in capital expenditure in its unit. The most important among them was the modifications made to the Continuous Casting Machine (CCM) which has increased its melting capacity from 2 lakh TPA to 2.60 lakh TPA
The Co. sold 1.7 lakh tonnes in FY22 against 1.5 lakh tonnes in FY21.
The Co. has strong relations with 200+ customers like Toyota, Hero Moto Corp, Caterpillar, Hino Motors, Maruti, Bajaj, and Hyundai, among others. Its top 5 clients contribute about 30% of total revenue and about 70-75% of the contribution coming from passenger vehicles and two-wheelers.The Co also caters to international customers and has a presence in countries like Thailand, Taiwan, Turkey, Russia, Germany and Spain.In FY22, 5% of total sales came from exports.

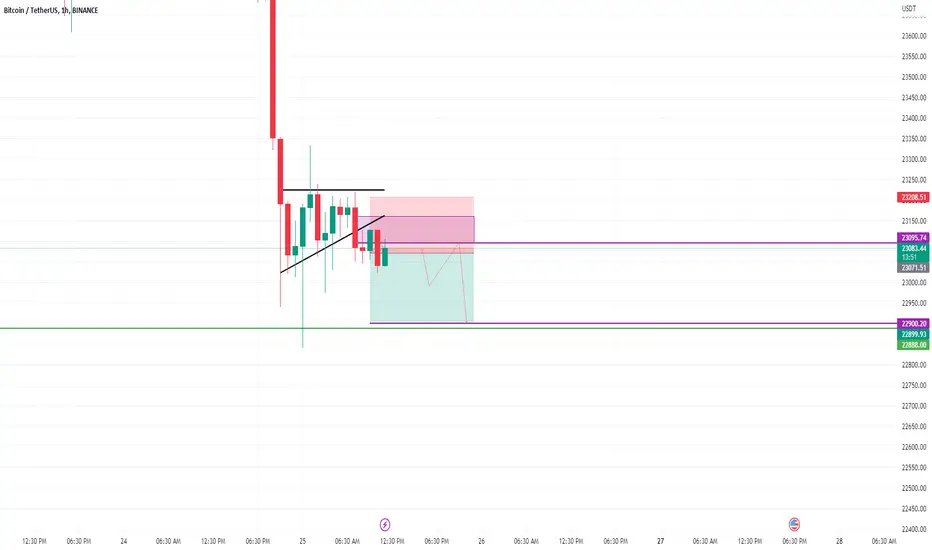
BTCUST SHORT TRADE1.btcusdt has break its suuport
2.breakbearish flag pattren
3.good seeling volumes
4.target level given below
!!!!!!!!goood luck...!!!!!
VTL | Flag in 4H time frame - potential for 10% short termVTL | Flag in 4H time frame - potential for 10% short term
CMP : 319 (Dip : 310)
SL : 300
Target : 355
1:3+ risk reward setup
Weekly chart shows are strong reversal aswell.

intraday, swing, short term; min 70% returns, manapuram fin, head and shoulders + flag pattern is formed
midcap and smallcap stocks are going to boom
intraday opportunity is less, but for two to three days of holding is good
for long term investment
.
.
.
.
.reffer my old analysis attached below

Mana coin-Downside flag breakoutMana coin is making a flag pattern in 4h timeframe.The flag once broke out earlier,now it is retesting from the trendline and can fall downside to the next support.If high volume bear candles form on the chart,then a short trade can be initiated downside.Supports are marked there on the chart.

intraday sbin Flag and Pole patternavoid first 15min breakout
wait for 15 min candle closing
targets are marked
if the breakout comes after 10:00 am then the probability of winning will be more.
follow risk management
do your own analysis
do workout
do meditation
start reading books

M_M Great Opportunity - Long With Flag Pattern.M_M - Flag Pattern - Looks like a Great Opportunity.
With SL 1280, we can aim for 1700 target from current price..
Note: I'm not a SEBI registered & This is not a recommendation , this is only for education purpose, please do your own analysis before taking trade.

Flag and pole pattern in LambodharaPlease see in this stock it has formed pole and flag pattern which is one of the bullish pattern and the stock is now expected to make an upmove of the height of the pole which is approx 70 points from 170. So this stock is expected to move towards 240 now.

Nifty Flag PatternNifty Broken Daily Time frame Broken Triangle,
Gap Up opening today
Forming Flag Pattern in Lower time frame

BHARAT WIRE ROPES1) Minor downtrend breakout with good weekly close.
2) Next target would be 130 and 148.
3) If it sustain above 115 in daily it will move up to the targets.

Banknifty India FlagBanknifty Flag Pattern
Buy above 42600 but after
26 January 2023
Independent Day
Note: I am not SEBI registered. It's only Education Purpose.

FLAG AND POLE (ARIES)Price gives breakout of flag patterns on weekly timeframe but candle is too big to enter.
We can enter on alittle correction on 4H timeframe.
CMP : 206
Target 1 : 237
Target 2 : 293
This is not a buy or sell call, this analysis is shared for educational purpose.

Chennai Petro CP Wedge and Flag BreakoutChennai Petro CP breaks out on 1D timeframe. It has given a Double Pattern breakout from Falling Wedge and Flag patterns. Target & Stop Loss are explained on Chart. Be wary of upcoming earnings. Do Trail your Stop Loss and follow proper Risk Management.


NIFTY FIFTY - FLAG PATTREN 15 Min TF showing a flag pattren is being formed .
Lets wait to form it properly ......
~~for confirmation go to 3/5 min TF and identify the Highs and Lows

RBA - daily cmp 111Long trendline + flag pattern at trendline resistance.
Stock has corrected 60 odd% from highs
On breakout with volumes, this stock can give a good upmove till 126-136-148 levels. Furthermore, targets of 168 and 185 also can be achieved.
SL can be breakdown of flag pattern or any weekly closing below 90.

Why Grasim can blast a brief anaysis!!NSE:GRASIM is looking Good to enter if you want to invest in Nifty Infra for the upcoming weeks.
Even though volatility in the market has started to increase. It is stable and holding its levels Positively.
With every Swing in it, volatility is reducing & it can give huge returns in a shorter period.
One Can take Stop loss near the zone of 1760 (Tight SL) and 1700 as a (Loose SL)
Trade horizon can vary on movement of the stock, (Ideally 3-6 months)
I'll keep you updated here so make sure to follow for updates. and you can ask questions in the comments.
Follow for Such Ideas

Grasim Flag Pattern 1 hour Flag Pattern observed in Grasim 1 hour TF
If breakout is confirmed, Target 1945

PAYTM -- MAKE OR BREAK ---Flag pattern PAYTM --DAILY CHART ---MAKE OR BREAK --FLAG PATTERN.
1. PAYTM seen triple bottom formation on Daily chart shown as circle 1,2,3 AT Strong support line around 625-630 level
2. Flag pattern seen on chart
3. previously trendline breakdown seen at 760-770 level and stock fall towards 625-630 , consecutive support form at 3 times at this level
4. Stock on daily chart trading at lower channel make or break level , if support hold at 625-630 on next daily candle stock can go upside to 680 level short term bullish where lower channel resistance seen
5. if stock fall bellow 620 daily on candle then will fall to 580 level lower channel support short term .
***THIS IDEA IS FOR EDUCATIONAL PURPOSE ... TRADE AT OWN RISK !
HAPPY TRADING. !

NSE:LT (CUP WITH HANDLE, FLAG)After giving a CUP WITH HANDLE Breakout, it formatted a flag pattern consolidation. Today it's gave a Break-out. We can expect 8% UPSIDE with 3.5% DOWNSIDE Risk.
Entry - 2020
SL - 1955
Target 1 - 2075
Target 2 - (2150 - 2180)
