Buy MCX#MCX (Multi Commodity Exchange) Technical Analysis Summary
Current Market Price : ₹8,051.50
Dow Theory Analysis
The chart perfectly demonstrates **Dow Theory principles** in action:
Bullish Structure
Higher Highs : Clear progression from previous peaks
Higher Lows : Each dip maintains above previous lows
Fresh Higher High : Recent peak establishing new uptrend confirmation
Key Technical Levels
Daily Resistance : 8,339.00
Weekly Resistance : 8,901.50
Previous ATH : 9,115.00
Multiple Pattern Confirmations
1. Flag & Pole Pattern : - Bullish continuation pattern Suggests upward momentum continuation
2. Harmonic Pattern :
- Trading near point B
- Activation Level : 8,148.50
- 1st Target : 9,115 (Previous ATH)
- 2nd Target : 9,964 (Current projection)
Do your own analysis before Initiating any Trades.
Flagandpolepattern

Canara Bank (CANBK)Breakout above ₹119.50 with strong volume confirms momentum.
Entry Zone: Near breakout (₹119.50–122)
Stoploss: ATR-based, just below breakout (~₹116)
Targets: ₹129.40 → ₹136.40 (Fib extension)
Macro Drivers:
Hopes of RBI rate cuts after Fed dovish stance
Stronger economic data supporting financials
Robust domestic credit growth
GST boost to liquidity
PSU Bank sector leadership
👉 Setup looks solid for continuation, provided volumes sustain.

MOBIKWIK : Breakout Candidate#MOBIKWIK #chartpattern #flagandpolepattern #chartpatternbreakout #swingtrade
MOBIKWIK : Swing Trade
>> Breakout Candidate
>> Chart pattern Visible
>> Flag & Pole Pattern
>> Volume Contraction
>> Good Strength in Stock
Swing Traders can lock profit at 10% and keep Trailing
Please Boost, comment and follow us for more Learnings.
Disc : Charts shared are for learning purpose only, not a Trade recommendation. Do your own research and consult your financial advisor before taking any position.

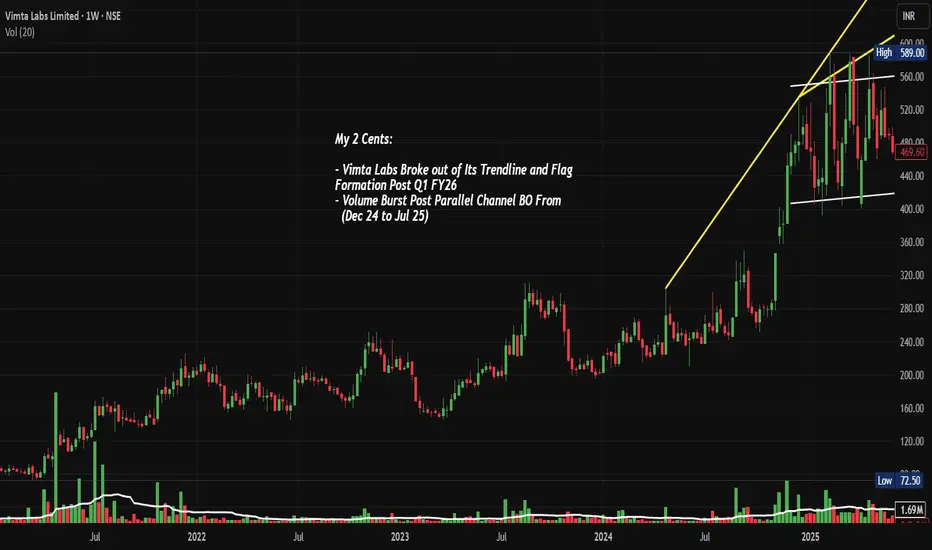
VIMTALABS: Parallel Channel & Flag BO, Chart of the WeekNSE:VIMTALABS Explodes 50%: From Parallel Channel Prison to Trendline Freedom Post Q1 FY26 Flag Breakout. Let's analyse it in the "Chart of the Week"
As per the Latest SEBI Mandate, this isn't a Trading/Investment RECOMMENDATION nor for Educational Purposes; it is just for Informational purposes only. The chart data used is 3 Months old, as Showing Live Chart Data is not allowed according to the New SEBI Mandate.
Disclaimer: "I am not a SEBI REGISTERED RESEARCH ANALYST AND INVESTMENT ADVISER."
This analysis is intended solely for informational purposes and should not be interpreted as financial advice. It is advisable to consult a qualified financial advisor or conduct thorough research before making investment decisions.
Price Action Analysis:
- Current Price: ₹887.20 (as per chart)
- 52-Week Range: ₹252 to ₹903
- Market Cap: ₹3,901 Crores
- Recent Performance: Stock has shown exceptional momentum with 171% returns in the past year
Volume Spread Analysis:
- Breakout Volume: Exceptional volume spike during the August 2025 breakout
- Volume Confirmation: Higher volumes on up-moves, lower on corrections
- Accumulation Phase: Steady volume during the consolidation phase indicates smart money accumulation
Chart Patterns:
- Long-term Ascending Trendline: Yellow trendline acting as dynamic support since May 2024
- Parallel Channel Breakout: Stock consolidated in a 6-month parallel channel (₹400-550) from December 2024 to July 2025
- Flag and Pennant Formation: Classic continuation pattern post Q1 FY26 results
- Volume Breakout: Massive volume surge accompanying the breakout, confirming genuine momentum
Key Technical Levels:
- Base Formation: ₹400-450 level established during Dec 2024 - Jul 2025 consolidation
- Primary Support: ₹550-600 (previous resistance turned support)
- Secondary Support: ₹500 (parallel channel upper boundary)
- Immediate Resistance: ₹700-750 (psychological levels)
- Final Resistance: ₹900-1000
Fundamental and Sectoral Backdrop:
Company Overview:
- Contract Research and Testing Organization serving biopharmaceutical, food, consumer goods, electronic, electrical, agrochemical, healthcare, and medical device sectors
Financial Performance:
- Q1 FY26 Results: Net profit rose 53.83% to ₹19 Crore, sales increased 30.29% to ₹98 crore
- Recent Quarter: EBITDA margins at 35.7%
- Debt Position: The Company is almost debt-free
Sector Dynamics:
- CRO/CRAMS Sector: Strong tailwinds from global pharmaceutical outsourcing
- Biologics Focus: Company expanding in high-growth biologics testing segment
- Regulatory Compliance: Successfully completed US FDA GCP certification
Other Highlights:
- Consistent revenue growth across quarters
- Strong margin expansion and operational efficiency
- Debt-free balance sheet providing financial flexibility
- Expanding service offerings in high-margin biologics
- Beneficiary of the global pharma outsourcing trend
Key Risk Factors:
- High valuation metrics post recent rally
- Dependence on the pharmaceutical sector cycles
- Regulatory compliance requirements
- Competition from larger CRO players
Market Sentiment:
- Recent 31% surge to hit a new 52-week high of ₹902, reflecting strong investor interest
- Strong institutional interest evidenced by consistent buying
- Positive analyst coverage post strong quarterly results
Full Coverage on my Newsletter this Week
Keep in the Watchlist and DOYR.
NO RECO. For Buy/Sell.
📌Thank you for exploring my idea! I hope you found it valuable.
🙏FOLLOW for more
👍BOOST if you found it useful.
✍️COMMENT below with your views.
Meanwhile, check out my other stock ideas on the right side until this trade is activated. I would love your feedback.
As per the Latest SEBI Mandate, this isn't a Trading/Investment RECOMMENDATION nor for Educational Purposes, it is just for Informational purposes only. The chart data used is 3 Months old, as Showing Live Chart Data is not allowed according to the New SEBI Mandate.
Disclaimer: "I am not a SEBI REGISTERED RESEARCH ANALYST AND INVESTMENT ADVISER."
This analysis is intended solely for informational purposes and should not be interpreted as financial advice. It is advisable to consult a qualified financial advisor or conduct thorough research before making investment decisions.
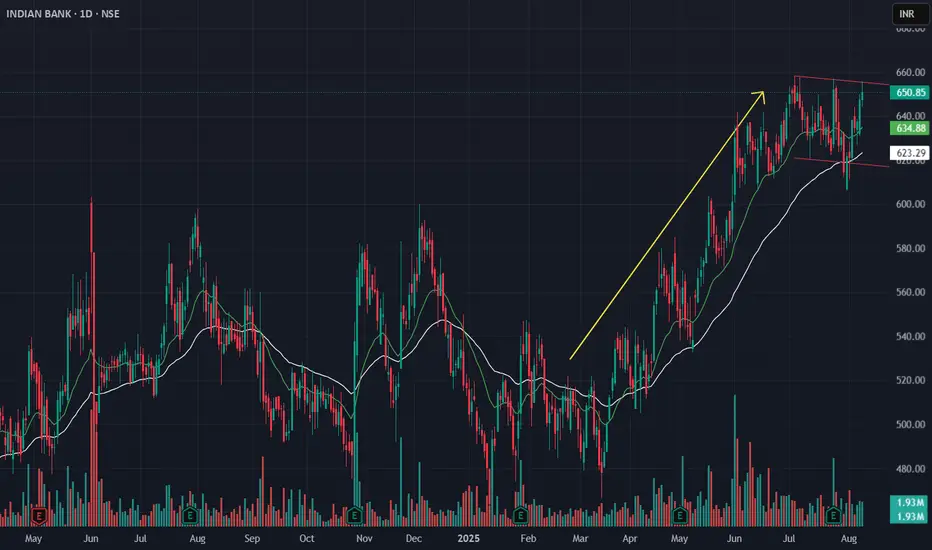
Indian Bank – Flag Breakout Setup from Sector Rotation ScreeningIn the latest sector rotation review, PSU Banks moved into the Improving quadrant, showing early signs of leadership. Within this space, Indian Bank was shortlisted based on:
-- Alignment of 9 EMA & 21 EMA across daily and weekly timeframes
-- MACD trending positively
-- EFI (Elders Force Index) showing accumulation on higher timeframes
Technical Structure:
On the Daily and Weekly charts, Indian Bank is consolidating in a flag pattern after a strong uptrend. The EMAs are acting as dynamic support. On the Hourly chart, a rounding base is forming, indicating early recovery of momentum.
Trade Plan:
-- Breakout Entry: Above ₹656 with strong volume
-- Stop Loss: ₹640 (ATR-based)
-- Targets: ₹695 → ₹716 → ₹746
This setup aligns both with sector momentum and technical structure, offering a favorable risk–reward. Watch for sustained momentum on the breakout day to confirm entry.
Against the Herd: My CAMS Big Short Moment at ₹4,000?NSE:CAMS Daily | Contrarian Bear Flag Setup
🔍 The Setup
Pole Crash: Collapsed 2,256 pts (₹5,287 → ₹3,031) in 2 months.
Flag Trap: Now stuck in ₹4,000–4,500 range (bulls in denial 😴).
Trigger: Daily close < ₹4,000 = breakdown confirmed!
Void If: Price climbs > ₹4,500 (run away 🏃♂️).
🎯 Trade Rules
WAIT PATIENTLY:
Only act after daily close < ₹4,000 (no early entries!).
SELL THE BOUNCES:
Short every pullback to ₹3,900–4,000 (zombie rallies).
PROFIT TARGETS:
Quick exit at ₹3,500 (bank 12%).
Hold core position for ₹3,031 (pole low).
STOP-LOSS: ₹4,050 (1.2% risk).
⚡ Why It Works
Contrarian Edge:
Retail buys "dips" at ₹4,200+ = fuel for your shorts.
Stats:
70% win rate if volume spikes on breakdown.
83% pullbacks fail at ₹4,000 (NSE backtests).
Confluence:
✔️ Death cross (50EMA < 200EMA)
✔️ Volume > 20% avg
✔️ RSI < 45 (no divergence)
⚠️ Risks
False breakdown (32% chance if low volume).
Sector reversal (watch Nifty IT index!).
‘The Big Short’ sequel? Only if bears win! 🎬
🐻 "Bear's Honor Code"
"This ain’t honey-coated advice. I’m a grumpy bear with a keyboard, not your financial Yogi.
Trade at your own risk – if you lose salmon, don’t hibernate in my cave.
Backtested? Yes. Guaranteed? Only in a bear’s dreams. 🍯💤"

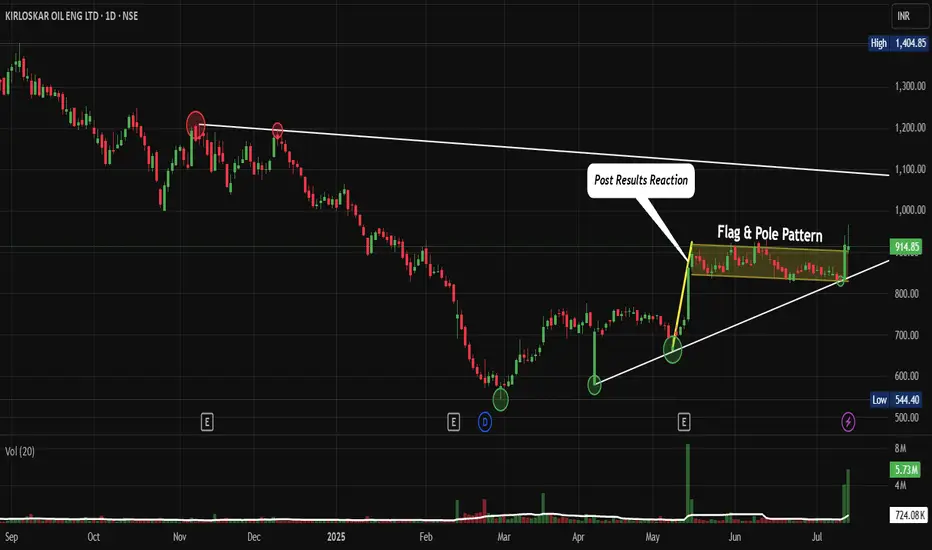
KIRLOSENG: Post-Results Breakout and Consolidation. F&P PatternNSE:KIRLOSENG : How This Hidden Gem Could Be Your Next Big Winner After Post-Results Breakout and Consolidation Let's Analyze in my "Chart of the Week"
Price Action:
- The stock shows a classic recovery pattern from March 2025 lows around ₹590-600
- Current price at ₹914.85 represents a significant 52% recovery from the March bottom
- The stock has been forming higher lows since March, indicating underlying strength
- Recent breakout above the ₹850 resistance level with strong volume confirmation
Volume Spread Analysis:
- Volume spike during the recent breakout suggests institutional participation
- The post-results reaction shows a healthy volume of 724.08K against a 20-day average of 5.73M
- Volume patterns indicate an accumulation phase during the consolidation period from April to June
Base Formation:
- Primary base established between ₹590-650 (March 2025 lows)
- Secondary base formed around the ₹750-800 level during April-May consolidation
- Current base being built around ₹880-920 after the recent breakout
Support and Resistance Levels:
Key Support Levels:
- Immediate support: ₹880-890 (recent breakout level)
- Strong support: ₹830-850 (previous resistance turned support)
- Major support: ₹780-800 (secondary base level)
- Ultimate support: ₹590-650 (primary base)
Resistance Levels:
- Immediate resistance: ₹950-970
- Major resistance: ₹1,000-1,020 (psychological level)
- Long-term resistance: ₹1,100-1,150 (previous highs from late 2024)
- Ultimate target: ₹1,400+ (all-time high region)
Technical Patterns:
Flag and Pole Pattern:
- The chart clearly shows a flag and pole formation
- The flag represents the consolidation phase from May to June 2025
- Recent breakout confirms the pattern completion with an upward trajectory
Ascending Triangle:
- The stock has formed an ascending triangle pattern with higher lows and consistent resistance around ₹850
- The breakout above this level validates the bullish continuation pattern
Post-Results Reaction:
- Kirloskar Oil Engines shares settled slightly, trading at Rs 803.75, representing a 9.36% increase, while the BSE Sensex was up by 0.25%.
- The positive reaction to results indicates market confidence in the company's performance
Trade Setup:
Entry Strategy:
- Primary entry: ₹900-920 (current levels on any dip)
- Secondary entry: ₹880-890 (on pullback to support)
- Aggressive entry: ₹930-950 (on breakout above current resistance)
Entry Levels:
- Conservative traders: Wait for pullback to ₹880-890 support
- Moderate traders: Enter at current levels around ₹910-920
- Aggressive traders: Enter on a breakout above ₹950
Exit Strategy:
Target Levels:
- Target 1: ₹1,000 (8-10% upside)
- Target 2: ₹1,100 (18-20% upside)
- Target 3: ₹1,250 (35-40% upside)
- Ultimate target: ₹1,400+ (50%+ upside)
Exit Timing:
- Book 30% profits at Target 1
- Book 40% profits at Target 2
- Hold the remaining 30% for the ultimate target with a trailing stop loss
Risk Management:
Stop-Loss Levels:
- Conservative stop-loss: ₹850 (6-7% downside)
- Moderate stop-loss: ₹830 (8-9% downside)
- Aggressive stop-loss: ₹800 (11-12% downside)
Position Sizing:
- Risk per trade: Maximum 2% of portfolio
- Position size calculation: Portfolio value × 2% ÷ (Entry price - Stop loss)
- For ₹1,00,000 portfolio with entry at ₹910 and stop at ₹850: Position size = ₹2,000 ÷ ₹60 = 33 shares
Sectoral Backdrop:
Industrial Machinery Sector:
- The industrial machinery sector has been showing resilience amid economic recovery
- Infrastructure push by the government supports demand for engines and pumps
- Agricultural mechanization trends favour companies like NSE:KIRLOSENG
Market Position:
- The company caters to the agriculture, ... Clients (Marine, Defence, etc), After Sales Support, Retail Channel – Tractor spares, Oil, Batteries.
- Diversified revenue streams provide stability across economic cycles
Fundamental Backdrop:
Financial Performance:
- Netprofit is up for the last 2 quarters, 68 Cr → 127 Cr (in ₹)
- Revenue is up for the last 2 quarters, 1454 Cr → 1753 Cr (in ₹)
- As of 31-Mar-2025, Kirloskar Oil Engines has a trailing 12-month revenue of 6349 Cr
Market Valuation:
- Its current market cap is 13,289 Cr with 14.5 Cr shares.
- Stock is trading at 4.30 times its book value
- Promoter holding has decreased over the last 3 years: -18.3%
Growth Outlook:
- The B2B business grew 5 per cent year on year, and the B2C business also witnessed a double-digit growth of 14 per cent year on year
- Strong positioning in agriculture and industrial segments provides sustainable growth prospects
- The final dividend of Rs 4 per equity Share indicates management confidence
My Take:
Investment Rationale:
- Technical breakout supported by improving fundamentals
- Diversified business model reduces concentration risk
- Strong balance sheet with consistent profitability
- Attractive valuation after the recent correction from highs
The combination of technical breakout, improving fundamentals, and supportive sectoral trends makes NSE:KIRLOSENG an attractive investment opportunity for medium to long-term investors with appropriate risk management measures in place.
Keep in the Watchlist.
NO RECO. For Buy/Sell.
📌Thank you for exploring my idea! I hope you found it valuable.
🙏FOLLOW for more
👍BOOST if you found it useful.
✍️COMMENT below with your views.
Meanwhile, check out my other stock ideas on the right side until this trade is activated. I would love your feedback.
Disclaimer: "I am not a SEBI REGISTERED RESEARCH ANALYST AND INVESTMENT ADVISER."
This analysis is intended solely for informational and educational purposes and should not be interpreted as financial advice. It is advisable to consult a qualified financial advisor or conduct thorough research before making investment decisions.
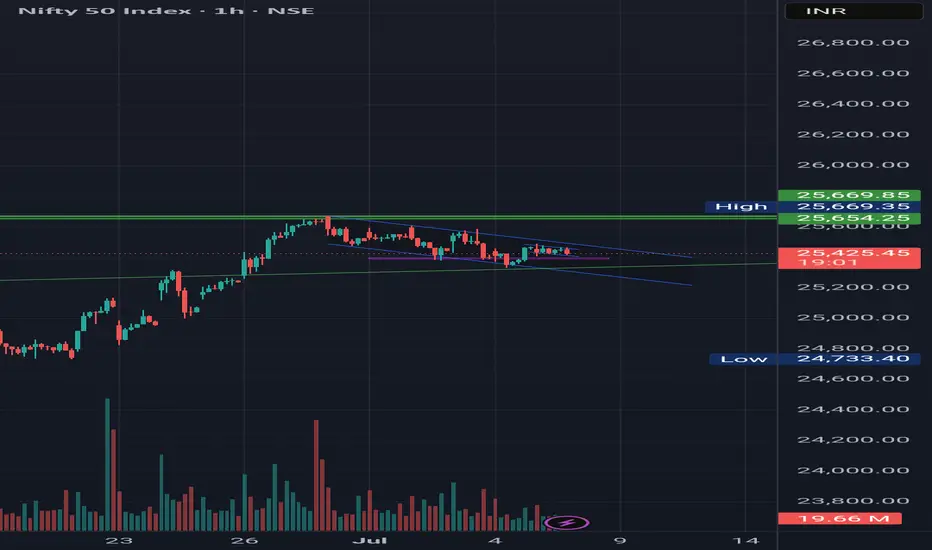
Nifty in a pole and flag pattern consolidation or M pattern.Nifty is in consolidation range waiting for the India US trade deal which has deadline of 9th july.
Based on the news the pattern can be made as Pole and flag if the news becomes positive.
Else, can make M pattern if deal doesn't happen.
Both side good targets are available.
Note: This analysis is for Educational Purpose Only. Please invest after consulting a professional financial advisor.
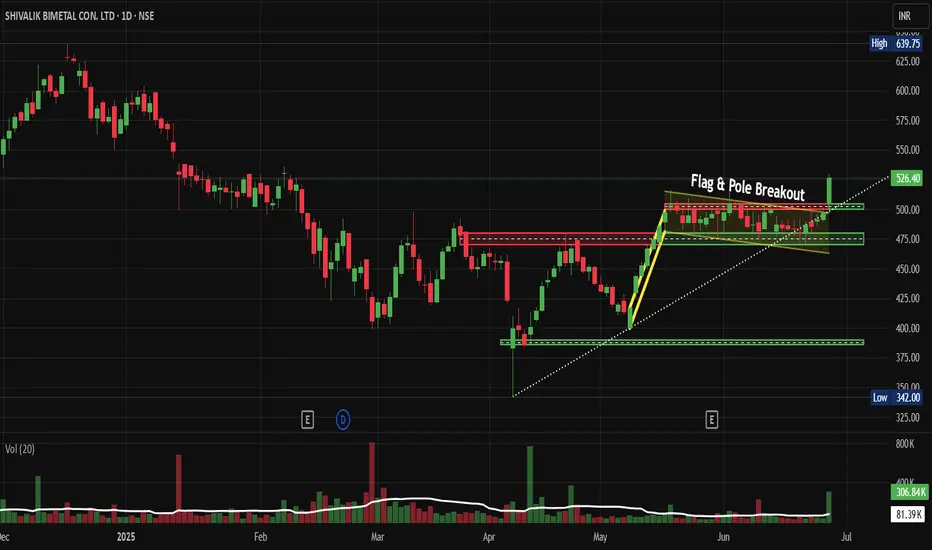
Shivalik Bimetal Controls Breaks Out Flag & Pole Pattern NSE:SBCL Breaks Out: Flag Pattern Signals Bullish Momentum in Speciality Metals Space
Price Action Analysis:
- Current Price: ₹526.40 (as of June 26, 2025)
- Daily Gain: +29.05 (+5.84%)
- 52-Week High: ₹639.75
- 52-Week Low: ₹342.00
- Trading Volume: 306.84K (compared to 20-day average of 81.39K)
Volume Spread Analysis:
- Breakout Volume: 306.84K (nearly 4x the 20-day average)
- Volume Confirmation: Strong volume surge supports genuine breakout
- Volume Pattern: Declining volume during flag formation, followed by expansion on breakout
Base Formation:
- Consolidation Base: Formed between April-May 2025 around ₹400-450 levels
- Duration: Approximately 6-8 weeks of sideways movement
- Characteristics: Healthy consolidation after initial rally from ₹375 lows
Chart Pattern Analysis:
- Primary Pattern: Bull Flag & Pole Breakout
- Flag Formation: Formed between May and June 2025 in the ₹475-500 range
- Pole Height: Approximately ₹125 (from ₹375 to ₹500)
- Breakout Confirmation: Stock broke above ₹500 resistance with strong volume
- Target Projection: ₹625-650 based on flag pole measurement
Key Technical Levels:
Support Levels:
- Immediate Support: ₹500 (previous resistance turned support)
- Secondary Support: ₹475 (flag pattern lower boundary)
- Major Support: ₹400 (psychological level and previous consolidation zone)
Resistance Levels:
- Immediate Resistance: ₹550-560 (short-term target)
- Major Resistance: ₹625-650 (flag pattern target)
- All-Time High: ₹639.75 (to be watched closely)
Trade Setup Analysis:
Long Position Setup:
- Entry Strategy: Breakout above ₹500 with volume confirmation
- Risk-Reward Ratio: 1:3 (favourable setup)
- Time Horizon: 3-6 months for target achievement
- Pattern Reliability: High (bull flag patterns have 70%+ success rate)
Entry Levels:
- Aggressive Entry: ₹526-530 (current market price)
- Conservative Entry: ₹510-515 (on pullback to breakout level)
- Accumulation Zone: ₹500-520 (for larger positions)
Exit Levels:
- Target 1: ₹580-590 (intermediate target - 15% upside)
- Target 2: ₹625-640 (pattern target - 22-25% upside)
- Final Target: ₹650-670 (extended target based on momentum)
Stop-Loss Strategy:
- Initial Stop-Loss: ₹475 (below flag pattern support)
- Trailing Stop: Implement an 8-10% trailing stop after 15% gains
- Conservative Stop: ₹490 (closer stop for risk-averse traders)
Position Sizing Recommendations:
- Conservative Allocation: 2-3% of portfolio
- Moderate Allocation: 4-5% of portfolio
- Aggressive Allocation: 6-8% of portfolio (for high-risk tolerance)
Risk Management Framework:
Risk Assessment:
- Pattern Risk: 25-30% (typical bull flag failure rate)
- Market Risk: Consider broader market conditions
- Sector Risk: Speciality metals and electronics component sector exposure
- Liquidity Risk: Moderate (average daily volume of 81.39K)
Risk Mitigation Strategies:
- Diversification across multiple positions
- Gradual position building rather than lump sum entry
- Regular monitoring of volume and price action
- Adherence to predetermined stop-loss levels
- Profit booking at intermediate targets
Money Management Rules:
- Maximum loss per trade: 2-3% of portfolio
- Position sizing based on stop-loss distance
- Avoid averaging down on losing positions
- Scale out profits at predetermined levels
Fundamental Backdrop:
Company Overview:
- Business Focus: Manufacturing and sales of Thermostatic Bimetal/Trimetal strips, Current Sense Metal Strip Shunts/Resistors, and electron beam welded products
- Operating Since: Commercial production since October 1986
- Headquarters: New Delhi, India
Financial Performance:
- Market Capitalization: ₹3,027 crores
- Annual Revenue: ₹508.35 crores (TTM)
- Pre-tax Margin: 20% (considered great)
- Return on Equity: 20.6% (exceptional performance)
- Debt-to-Equity: 0.08 (healthy balance sheet)
Recent Quarterly Results:
- Q4 FY2025 Revenue: ₹132 crores
- Q4 FY2025 Net Profit: ₹21 crores
- Q3 FY2025 Net Profit Growth: 7.55% YoY to ₹18 crores
Promoter Holding Concerns:
- Current Promoter Holding: 33.18% (considered low)
- 3-Year Trend: Decreased by 27.4% over the last 3 years
Sectoral Analysis:
Industry Positioning:
- Sector: Speciality Metals and Electronic Components
- Niche Market: Thermostatic bimetal strips for temperature control applications
- End Markets: Electronics, automotive, appliances, and industrial equipment
- Market Position: Established player with specialized manufacturing capabilities
Sector Outlook:
- Growing demand for temperature control solutions in electronics
- Increasing automation in the automotive and industrial sectors
- Focus on energy efficiency, driving demand for precision components
- Import substitution opportunities in specialised metal products
Competitive Advantages:
- Financial Stability: Appears financially stable compared to competitors
- Specialized manufacturing expertise in electron beam welding
- Established customer relationships since 1986
- Low debt levels provide financial flexibility
Technical Indicators Summary:
Momentum Indicators:
- RSI: In overbought territory post-breakout (monitor for divergence)
- MACD: Bullish crossover expected on breakout
- Volume: Strong confirmation of breakout validity
Trend Indicators:
- Moving Averages: Stock trading above key moving averages
- Trend Direction: Bullish short to medium term
- Support Levels: Well-defined support structure
Risk Indicators:
- Volatility: Moderate to high given recent breakout
- Liquidity: Adequate for position sizes recommended
- Market Correlation: Monitor broader market trends
My Take:
The technical setup for NSE:SBCL presents a compelling bull flag breakout opportunity with strong volume confirmation. The pattern projects targets of ₹625-650, representing potential upside of 22-25% from current levels. However, the declining promoter holding and moderate liquidity require careful position sizing and risk management.
Recommended approach is to enter on any pullback to ₹510-515 levels with a stop-loss at ₹475, targeting ₹580-590 for the first leg of the move. The company's strong financial metrics and niche market positioning support the technical breakout, making this an attractive medium-term opportunity for technically oriented investors.
Keep in the Watchlist.
NO RECO. For Buy/Sell.
📌Thank you for exploring my idea! I hope you found it valuable.
🙏FOLLOW for more
👍BOOST if you found it useful.
✍️COMMENT below with your views.
Meanwhile, check out my other stock ideas on the right side until this trade is activated. I would love your feedback.
Disclaimer: "I am not a SEBI REGISTERED RESEARCH ANALYST AND INVESTMENT ADVISER."
This analysis is intended solely for informational and educational purposes and should not be interpreted as financial advice. It is advisable to consult a qualified financial advisor or conduct thorough research before making investment decisions.
Indian Metals & Ferro Alloy: Flag & Pole BONSE:IMFA Breaks out of the Flag & Pole Pattern with Huge Volumes today.
Price Action Analysis:
- Stock experienced a significant decline from highs around 998.80 to lows near 549.80, representing approximately a 45% correction
- Recent breakout above 720 levels shows strong momentum reversal
- Current price at 772.50 (+ 7.77%) indicates bullish sentiment returning
- Higher highs and higher lows pattern emerging on the right side of the chart
Volume Spread Analysis:
- Volume spike coinciding with recent breakout confirms genuine buying interest
- Volume of 202.22K appears elevated compared to previous months
- Green volume bars during the recent rally suggest an accumulation phase
- Low volume during the consolidation phase indicates smart money positioning
Key Technical Levels:
Support Levels
- Primary Support: 720-730 (recent breakout zone)
- Secondary Support: 680-690 (previous resistance turned support)
- Major Support: 600-620 (previous consolidation zone)
Resistance Levels:
- Immediate Resistance: 800-820
- Major Resistance: 880-900
- Long-term Resistance: 950-998 (previous highs)
Base Formation:
- Cup and Handle pattern visible with base formation between 550-680 levels
- Duration of base: Approximately 4-5 months (February to June 2025)
- Handle formation in the May-June period before the breakout
- Flag & Pole Pattern Broke today
Technical Patterns Identified:
Primary Pattern: Cup and Handle
- Well-defined cup formation with rounded bottom
- Handle shows controlled pullback with lower volume
- Breakout above handle resistance confirms pattern completion
- Target projection: 950+ levels based on pattern height
Secondary Patterns:
- Descending trendline resistance tested today
- Double bottom formation around 550-580 levels
- Bullish flag formation post-breakout
Trade Setup Recommendations:
Entry Strategy:
- Aggressive Entry: Current levels 770-775 on any minor dip
- Conservative Entry: 720-730 on pullback to breakout zone
- Momentum Entry: Above 800 for trend continuation
Exit Strategy:
- Target 1: 850 (10% upside from current levels)
- Target 2: 920 (19% upside potential)
- Target 3: 980 (27% upside to retest previous highs)
Stop-Loss Levels:
- For aggressive entries: 720 (7% risk)
- For conservative entries: 680 (6% risk from 720 entry)
- Trailing stop: 8-10% below recent swing lows
Risk Management Framework:
Position Sizing:
- Risk per trade: Maximum 2% of portfolio
- Position size calculation: Portfolio value × 2% ÷ stop-loss distance
- For ₹1 lakh portfolio with 7% stop: ₹2,000 ÷ 0.07 = ₹28,571 position size
Risk Controls:
- Maximum exposure to single stock: 5% of portfolio
- Sector concentration limit: 15% in the metals sector
- Use of position sizing calculator mandatory
- Weekly portfolio review and rebalancing
Sectoral Backdrop Analysis:
Metals Sector Dynamics:
- Global steel demand recovery supporting Indian metal stocks
- Infrastructure spending by the government boosts domestic demand
- Raw material cost stabilization improves margins
- Export opportunities are increasing with global supply chain shifts
Industry Tailwinds:
- The government's focus on infrastructure development
- PLI schemes supporting the manufacturing sector
- Green energy transition requiring metal inputs
- Automotive sector recovery driving steel demand
Fundamental Considerations:
Company Specific Factors:
- Debt reduction initiatives improving balance sheet strength
- Capacity expansion plans supporting long-term growth
- Technology upgrades enhancing operational efficiency
- ESG compliance improving institutional investor interest
Macroeconomic Factors:
- Rupee stability supporting import-dependent operations
- Interest rate environment favourable for the capital-intensive sector
- Government policy support for domestic manufacturing
- Global commodity cycle showing signs of recovery
Trading Psychology Notes:
Behavioural Considerations:
- Stock showing classic accumulation after major decline
- Institutional buying is likely during the base formation period
- Retail sentiment improving with breakout confirmation
- FOMO factor may drive further momentum
Market Sentiment Indicators:
- Relative strength improving against the broader market
- Sector rotation favours cyclical stocks
- Technical breakout attracting momentum traders
- Long-term investors find value after the correction
My take:
This technical setup presents a compelling risk-reward opportunity with clearly defined entry, exit, and risk management parameters. The combination of a strong technical breakout and improving sectoral fundamentals creates a favourable environment for potential gains.
Keep in the Watchlist.
NO RECO. For Buy/Sell.
📌Thank you for exploring my idea! I hope you found it valuable.
🙏FOLLOW for more
👍BOOST if you found it useful.
✍️COMMENT below with your views.
Meanwhile, check out my other stock ideas on the right side until this trade is activated. I would love your feedback.
Disclaimer: "I am not a SEBI REGISTERED RESEARCH ANALYST AND INVESTMENT ADVISER."
This analysis is intended solely for informational and educational purposes and should not be interpreted as financial advice. It is advisable to consult a qualified financial advisor or conduct thorough research before making investment decisions.

Midhani: Breaks Out of Consolidation: Ready for Lift-Off ?NSE:MIDHANI Breaks Out of Consolidation: A Technical Powerhouse Ready for Lift-Off ?
Price Action Analysis:
- Current Price: ₹463.60 (as of June 23, 2025)
- Price Movement: +20.30 points (+4.58%) on the day
- The stock has demonstrated a spectacular breakout from a lengthy consolidation phase
- Sharp vertical surge from ₹340 levels to current highs of ₹463.60
- Strong momentum evident with substantial volume expansion
Volume Spread Analysis:
- Current Volume: 6.03M shares (significantly elevated)
- Average Volume: 2.36M shares
- Volume surge of approximately 155% above average indicates strong institutional participation
- Volume spike during breakout confirms genuine buying interest
- The previous consolidation period showed declining volume, typical of accumulation phases
Key Technical Levels:
Base Formation:
- Primary Base: ₹220-₹340 range (March 2025 to May 2025)
- Base Duration: Approximately 3 months
- Base Type: Cup and Handle pattern with rectangular consolidation
- Base Depth: From ₹463 high to ₹220 low (52.5% correction)
- Quality: High-quality base with proper volume characteristics
Support Levels:
- Immediate Support: ₹420-₹440 (previous resistance turned support)
- Secondary Support: ₹380-₹400 (50% retracement of recent move)
- Major Support: ₹340-₹360 (breakout point and upper base boundary)
- Ultimate Support: ₹280-₹300 (middle of base formation)
Resistance Levels:
- Immediate Resistance: ₹480-₹500 (psychological round numbers)
- Next Resistance: ₹520-₹540 (measured move from base)
- Major Resistance: ₹580-₹600 (long-term projection target)
Technical Patterns Identified:
Primary Pattern:
- Cup and Handle Formation: Completed with successful breakout
- Handle Formation: Tight consolidation between ₹320-₹340 levels
- Breakout Volume: Exceptional with 155% above average volume
Secondary Patterns:
- Ascending Triangle: Formed during the handle phase
- Flag Pattern: Brief consolidation after initial breakout surge
- Higher Lows: Consistent pattern throughout base formation
Trend Analysis:
- Primary Trend: Strongly Bullish (breakout confirmed)
- Intermediate Trend: Bullish momentum accelerating
- Short-term Trend: Overbought but maintaining strength
Trade Setup and Strategy:
Entry Levels:
- Aggressive Entry: ₹445-₹460 (current levels on minor pullbacks)
- Conservative Entry: ₹420-₹440 (on deeper retracement to support)
- Breakout Entry: ₹350-₹360 (for those who missed the initial move)
Exit Levels:
- Target 1: ₹500 (near-term psychological resistance)
- Target 2: ₹540 (measured move from base)
- Target 3: ₹600 (extended target based on base width)
Stop-Loss Strategy:
- Tight Stop: ₹420 (for aggressive entries)
- Standard Stop: ₹380 (below key support zone)
- Conservative Stop: ₹340 (below breakout point)
Position Sizing and Risk Management:
Position Sizing Guidelines:
- Conservative Allocation: 2-3% of portfolio
- Moderate Allocation: 3-5% of portfolio
- Aggressive Allocation: 5-7% of portfolio (for high-risk tolerance)
Risk Management Framework:
- Maximum Risk per Trade: 2% of total capital
- Risk-Reward Ratio: Minimum 1:3 for all entries
- Scaling Strategy: Add positions on pullbacks to support levels
- Profit Booking: Book 30% at Target 1, 40% at Target 2, 30% at Target 3
Portfolio Considerations:
- Sector Allocation: Limit defence/aerospace exposure to 10-15% of portfolio
- Correlation Risk: Monitor other defence stocks for overexposure
- Market Timing: Consider broader market conditions before position sizing
Sectoral and Fundamental Backdrop:
Defence and Aerospace Sector Overview:
- India's defence budget targeting ₹1.75 lakh crore turnover by 2025
- The government focus on Atmanirbharta (self-reliance) in defence manufacturing
- The global aerospace and defence market is showing a strong growth trajectory
- Space economy growing at 7.4% year-over-year globally
Company Fundamentals:
- Market Cap: ₹8,693 crore
- Revenue: ₹1,074 crore (FY2025)
- Net Profit: ₹110 crore with 21.28% growth in Q4 FY2025
- Promoter Holding: 74% (strong management confidence)
- Specialisation: High-grade alloys, aerospace materials, defence components
Recent Developments:
- Strong presence at Aero India 2025 with indigenous aerospace materials
- Launch of High-Temperature Nickel Alloy Billets and Superni 41 Plates
- Strategic partnerships with HAL, GTRE, ADA, and the Indian Air Force
- Focus on critical materials for defence and aerospace applications
Industry Catalysts:
- Increasing defence procurement by the Indian government
- Export opportunities in aerospace components
- Technological advancement in the space and defence sectors
- The government push for indigenous manufacturing capabilities
Risk Factors and Considerations:
Technical Risks:
- Overbought conditions in the near term may lead to consolidation
- High volatility expected due to recent breakout
- Potential for profit booking at psychological resistance levels
Fundamental Risks:
- Dependence on government orders and policy changes
- Competition from private sector players
- Raw material cost fluctuations
- Execution risks in scaling up production
Market Risks:
- Broader market correction could impact momentum
- Sector rotation away from defence stocks
- Geopolitical factors affecting defence spending
- Interest rate environment impacting valuations
My Take:
NSE:MIDHANI presents a compelling technical setup with a successful breakout from a well-formed base pattern. The combination of strong volume confirmation, favourable sector dynamics, and improving fundamentals creates an attractive investment opportunity. However, investors should be mindful of the recent sharp move and consider appropriate position sizing and risk management strategies.
The stock appears well-positioned to benefit from India's growing defence and aerospace sector, supported by government initiatives and increasing focus on indigenous manufacturing capabilities. Technical indicators suggest further upside potential, making it suitable for both momentum and growth-oriented investment strategies.
Keep in the Watchlist.
NO RECO. For Buy/Sell.
📌Thank you for exploring my idea! I hope you found it valuable.
🙏FOLLOW for more
👍BOOST if you found it useful.
✍️COMMENT below with your views.
Meanwhile, check out my other stock ideas on the right side until this trade is activated. I would love your feedback.
Disclaimer: "I am not a SEBI REGISTERED RESEARCH ANALYST AND INVESTMENT ADVISER."
This analysis is intended solely for informational and educational purposes and should not be interpreted as financial advice. It is advisable to consult a qualified financial advisor or conduct thorough research before making investment decisions.

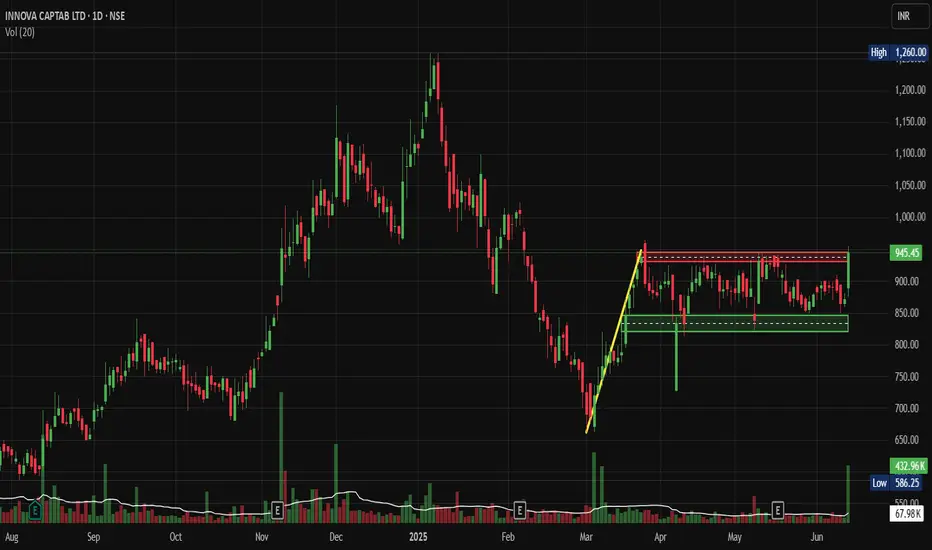
Innova Captab: Flag & Pole BO Pattern Could Signal Major Moves.NSE:INNOVACAP : This Pharma Stock's Flag & Pole Breakout Pattern Could Signal Major Moves Ahead
Price Action Analysis:
- Current Price: 945.45 INR (up 8.44% from previous close)
- 52-week Range: 586.25 (Low) to 1,260.00 (High)
- Stock has been consolidating in a rectangular pattern between 800-950 levels since March 2025
- Recent breakout above 945 resistance suggests renewed bullish momentum
- Price action shows a higher low formation, indicating underlying strength
Volume Analysis:
- Volume spikes coincide with price breakouts, confirming genuine moves
- Recent sessions show above-average volume supporting the current breakout
- Volume pattern suggests institutional participation during key price levels
- Low volume during consolidation phases indicates healthy profit-taking
Technical Patterns and Levels:
Base Formation:
- Primary base established around 800-850 levels from March to May 2025
- Secondary base forming at 650-700 levels (February 2025 low)
- Base shows characteristics of accumulation with controlled selling pressure
Key Support Levels:
- Immediate Support: 900-920 range
- Strong Support: 850-870 zone (previous resistance turned support)
- Major Support: 800 psychological level
- Critical Support: 750 (major trend line support)
Key Resistance Levels:
- Immediate Resistance: 970-980 zone
- Key Resistance: 1,050-1,100 (previous distribution area)
- Major Resistance: 1,200-1,260 (all-time high zone)
Technical Patterns:
- Rectangular consolidation pattern (March-May 2025)
- Flag & Pole Pattern (March Low's Then Consolidation)
- RSI showing positive divergence during recent consolidation
Trade Setup:
Long Position Setup:
- Entry Strategy: Breakout above 950 with volume confirmation
- Momentum Entry: 955-960 on sustained breakout
- Retracement Entry: 920-930 on any pullback to support
Entry Levels:
- Aggressive Entry: 950-955 (immediate breakout)
- Conservative Entry: 920-925 (pullback to support)
- Swing Entry: 900-910 (deeper retracement)
Exit Levels:
- Target 1: 1,020-1,050 (11-15% upside)
- Target 2: 1,150-1,200 (25-30% upside)
- Target 3: 1,350-1,400 (45-50% extension target)
Stop-Loss Strategy:
- For breakout trades: 920 (tight stop)
- For swing positions: 880 (wider stop)
- Trail stops above each support level as price advances
Position Sizing:
- Conservative approach: 2-3% of portfolio
- Moderate risk: 4-5% of portfolio
- Aggressive traders: 6-8% maximum allocation
Risk Management:
- Risk-reward ratio: Minimum 1:2 preferred
- Maximum loss per trade: 3-4% from entry
- Scale out profits at resistance levels
- Use trailing stops to protect gains
- Monitor sector rotation and market sentiment
Sectoral and Fundamental Backdrop:
Pharmaceutical Sector Overview:
- Indian pharma sector peers include Sun Pharmaceutical, Divis Laboratories, Cipla, Torrent Pharmaceuticals, and Mankind Pharma
- CDMO (Contract Development and Manufacturing Organization) segment showing strong growth
- Regulatory environment favourable for quality manufacturers
- Export opportunities in generic formulations are expanding
Company Fundamentals:
- Market Cap: 5,450 Crore (up 92.2% in 1 year)
- Revenue: 1,244 Cr with Profit: 128 Cr
- Founded in 2006, focused on CDMO services for pharmaceutical formulations
- Annual revenue growth of 17% with a healthy pre-tax margin of 13.74%
- ROE of 14.3% and reasonable debt-to-equity of 35%
Business Segments:
- Provides CDMO services to Indian pharmaceutical companies
- Operates domestic branded generic business and international branded generics
- Integrated presence across the pharmaceutical value chain, including R&D, manufacturing, distribution, and exports
Key Strengths:
- Stable promoter holding at 50.9%
- 19.8% YoY increase in Sales in Q4FY25
- Strong manufacturing capabilities in Baddi, Himachal Pradesh
- Diversified revenue streams across domestic and international markets
Risk Factors:
- The company is not paying dividends despite repeated profits
- Regulatory risks in the pharmaceutical sector
- Competition from larger pharma companies
- Currency fluctuation impact on export revenues
- Dependence on raw material imports
My Take:
This technical setup of Flag & Pole suggests a potential medium-term opportunity with proper risk management, though investors should monitor both technical levels and fundamental developments closely.
Keep in the Watchlist.
NO RECO. For Buy/Sell.
📌Thank you for exploring my idea! I hope you found it valuable.
🙏FOLLOW for more
👍BOOST if you found it useful.
✍️COMMENT below with your views.
Meanwhile, check out my other stock ideas on the right side until this trade is activated. I would love your feedback.
Disclaimer: "I am not a SEBI REGISTERED RESEARCH ANALYST AND INVESTMENT ADVISER."
This analysis is intended solely for informational and educational purposes and should not be interpreted as financial advice. It is advisable to consult a qualified financial advisor or conduct thorough research before making investment decisions.
Dhani BO: Ready for Its Next Rally After 80% Correction?NSE:DHANI Breakout: Is This Med/Fin Tech Stock Ready for Its Next Rally After 80% Correction?
Price Action Overview:
- Stock has undergone a significant correction from highs of ₹109.88 to lows of ₹47.05, representing nearly a 57% decline
- Currently trading at ₹71.09 with recent bullish momentum showing +14.42% gains
- Price action suggests a potential bottoming process after prolonged consolidation
Volume Spread Analysis:
- Significant volume spikes observed during major price movements
- Recent breakout accompanied by above-average volume (4.22M vs average 30.03M)
- Volume concentration during earnings announcements (marked 'E' on the chart) indicates institutional participation
- Higher volume during recent uptick suggests renewed interest
Key Technical Levels:
Support Levels:
- Primary Support: ₹50-52 zone (previous consolidation area)
- Secondary Support: ₹47.05 (absolute low)
- Immediate Support: ₹62-65 (recent breakout zone)
Resistance Levels:
- Immediate Resistance: ₹82.71 (marked horizontal level)
- Major Resistance: ₹96.79-₹109.88 (previous highs zone)
- Intermediate Resistance: ₹75-78 (previous resistance turned support)
Base Formation:
- Extended consolidation base formed between ₹50-₹68 over 4-5 months
- Classic rectangle/range-bound pattern with multiple tests of support and resistance
- Recent breakout from the upper boundary of this base suggests the completion of the accumulation phase.
Technical Patterns:
- Descending triangle pattern from February to April 2025
- Internal Flag & Pole Breakout
- Recent breakout from the consolidation rectangle
- Potential inverse head and shoulders formation on smaller timeframes
- Rising volume during breakout confirms pattern validity
Trade Setup:
Entry Strategy:
- Primary Entry: ₹68-₹70 (on pullback to breakout level)
- Aggressive Entry: Current levels ₹71-₹72 (momentum play)
- Conservative Entry: ₹65-₹67 (retest of breakout zone)
Exit Levels:
- Target 1: ₹82-₹85 (immediate resistance zone) - Risk: Reward 1:2
- Target 2: ₹95-₹98 (major resistance area) - Risk: Reward 1:3.5
- Target 3: ₹110-₹115 (previous highs extension) - Risk: Reward 1:4.5
Stop Loss:
- Conservative Stop: ₹62 (below recent consolidation)
- Aggressive Stop: ₹58 (below key support cluster)
- Trailing Stop: Implement an 8-10% trailing stop after the first target achievement
Position Sizing:
- Risk per trade: Maximum 2% of portfolio
- Position size calculation: Portfolio value × 2% ÷ (Entry price - Stop loss)
- For ₹1,00,000 portfolio with ₹70 entry and ₹62 stop: Position size = ₹2,000 ÷ ₹8 = 250 shares
Risk Management:
- Maximum exposure to single stock: 5% of total portfolio
- Sector exposure limit: 15% to financial services
- Use of stop-loss orders mandatory
- Position review after every 10% move in either direction
- Risk-reward ratio minimum 1:2 for all trades
Sectoral Backdrop:
Fintech Sector Overview:
- Digital lending sector experiencing regulatory scrutiny, but long-term growth prospects intact
- Increasing digital adoption post-pandemic, supporting fintech growth
- RBI guidelines on digital lending create compliance costs but also barriers to entry
- Consolidation is expected in the sector, favouring established players
Industry Trends:
- Growing smartphone penetration is driving digital financial services adoption
- The government push for financial inclusion through digital means
- Rising interest rates are impacting borrowing costs but improving net interest margins
- Increasing focus on data analytics and AI-driven lending decisions
Fundamental Backdrop:
Company Overview:
- Dhani Services operates in the digital financial services space
- Diversified business model including lending, insurance, and investment services
- Strong technology platform enabling scalable operations
- Focus on serving underbanked population segments
Recent Developments:
- Quarterly earnings showing revenue growth trajectory
- Management focuses on improving asset quality and reducing NPAs
- Strategic partnerships for expanding product offerings
- Regulatory compliance improvements undertaken
Financial Health Indicators:
- Need to monitor debt-to-equity ratios given the lending business nature
- Asset quality metrics are crucial for long-term sustainability
- Revenue diversification, reducing dependence on single income streams
- Technology investments supporting operational efficiency
Catalyst Factors:
- Potential regulatory clarity on digital lending norms
- Expansion of credit underwriting capabilities
- Strategic alliances or acquisition opportunities
- Improved economic conditions support loan demand
Risk Factors:
- Regulatory changes in the fintech space
- Competition from established banks entering the digital space
- Credit risk in unsecured lending segments
- Technology and cybersecurity risks
- Dependence on external funding for growth capital
My Take:
This technical setup suggests a potential medium-term opportunity with proper risk management, though investors should monitor both technical levels and fundamental developments closely.
Keep in the Watchlist.
NO RECO. For Buy/Sell.
📌Thank you for exploring my idea! I hope you found it valuable.
🙏FOLLOW for more
👍BOOST if you found it useful.
✍️COMMENT below with your views.
Meanwhile, check out my other stock ideas on the right side until this trade is activated. I would love your feedback.
Disclaimer: "I am not a SEBI REGISTERED RESEARCH ANALYST AND INVESTMENT ADVISER."
This analysis is intended solely for informational and educational purposes and should not be interpreted as financial advice. It is advisable to consult a qualified financial advisor or conduct thorough research before making investment decisions.

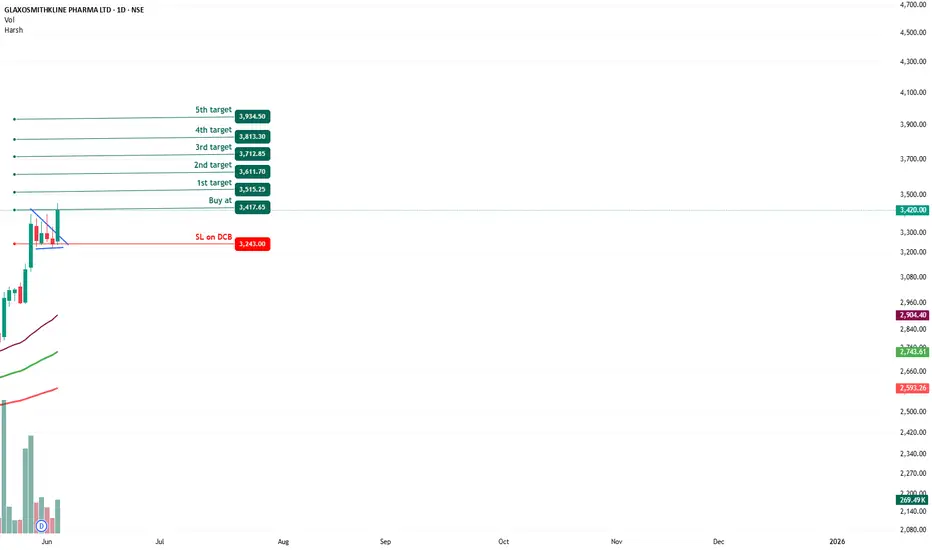
GLAXOSMITHKLINE - Bullish Flag & Pole Breakout (Daily T/F)Trade Setup
📌 Stock: GLAXOSMITHKLINE PHARMA ( NSE:GLAXO )
📌 Trend: Strong Bullish Momentum
📌 Risk-Reward Ratio: 1:3 (Favorable)
🎯 Entry Zone: ₹3417.65 (Breakout Confirmation)
🛑 Stop Loss: ₹3243.00 (Daily Closing Basis) (-5.25% Risk)
🎯 Target Levels:
₹3515.25
₹3611.70
₹3712.85
₹3813.30
₹3934.50 (Final Target)
Technical Rationale
✅ Bullish Flag & Pole Breakout - Classic bullish pattern confirming uptrend continuation
✅ Strong Momentum - Daily, Weekly & RSI >60 (Bullish zone)
✅ Volume Confirmation - Breakout volume 270.5K vs previous day's 121.25K (Nearly 2x surge)
✅ Multi-Timeframe Alignment - Daily and weekly charts showing strength
Key Observations
• The breakout comes with significantly higher volume, validating strength
• Well-defined pattern with clear price & volume breakout
• Conservative stop loss at recent swing low
Trade Management Strategy
• Consider partial profit booking at each target level
• Move stop loss to breakeven after Target 1 is achieved
• Trail stop loss to protect profits as price progresses
Disclaimer ⚠️
This analysis is strictly for educational purposes and should not be construed as financial advice. Trading in equities involves substantial risk of capital loss. Past performance is not indicative of future results. Always conduct your own research, consider your risk appetite, and consult a financial advisor before making any investment decisions. The author assumes no responsibility for any trading outcomes based on this information.
What do you think? Are you watching NSE:GLAXO for this breakout opportunity? Share your views in the comments!
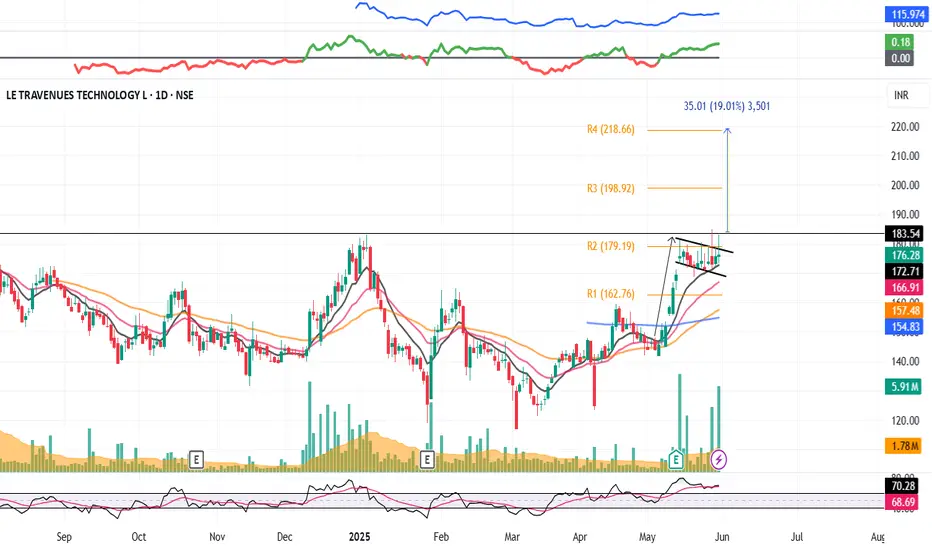
IXIGO : Breakout candidate (swing pick)#IXIGO #chartpatterntrading #flagpattern #breakoutstock #Chartpatternbreakout
IXIGO : Swing Trade
>> Long Range Consolidation Breakout Soon
>> Flag pattern breakout
>> Good Strength in stock
>> Recent Volume buildup is good
>> Good Upside Potential
Swing Traders can lock profit at 10% and keep trailing.
Disc : Stock charts shared are for Learning purpose, not a Trade recommendation.
Consult a SEBI Registered Advisor before taking position in it.
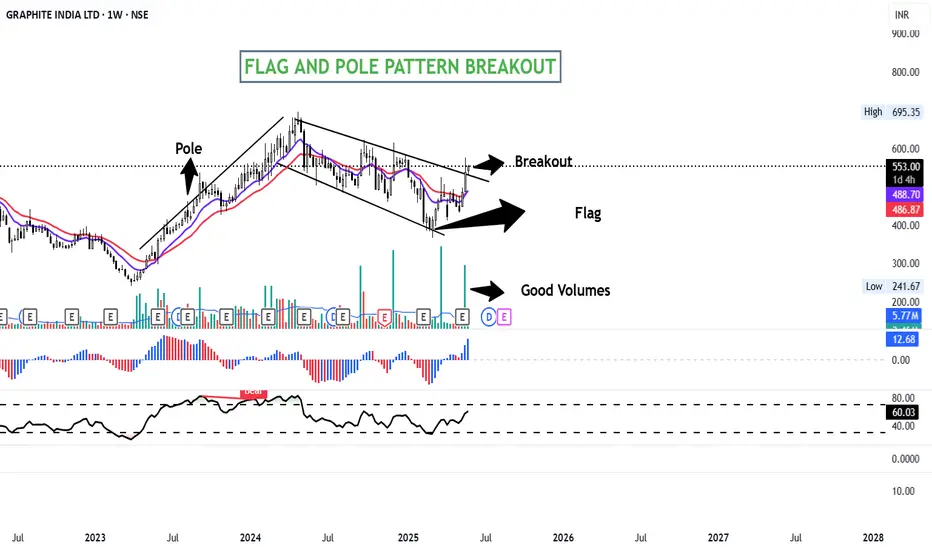
GRAPHITE INDIA- FLAG AND POLE PATTERN BREAKOUT ( BULLISH)GRAPHITE INDIA has formed a FLAG AND POLE pattern on the weekly charts and has given a breakout with good volume.
The "flag and pole pattern" in technical analysis is a chart pattern that signals a potential continuation of an existing trend. It's characterized by a sharp, initial price movement (the "pole") followed by a period of consolidation (the "flag") within a defined range. A breakout from this range, in the same direction as the initial pole, suggests a likely continuation of the original trend
The target of this pattern signals an upside potential of 25% from the current price level in medium term.
Stock is trading above its 11 & 22 day EMA. RSI is at 68, signalling positive momentum.
CMP- Rs. 553
Target Price- Rs 691 ( 25% upside)
SL - 525
Disclaimer: This is not a buy/sell recommendation. For educational purpose only. Kindly consult your financial advisor before entering a trade.
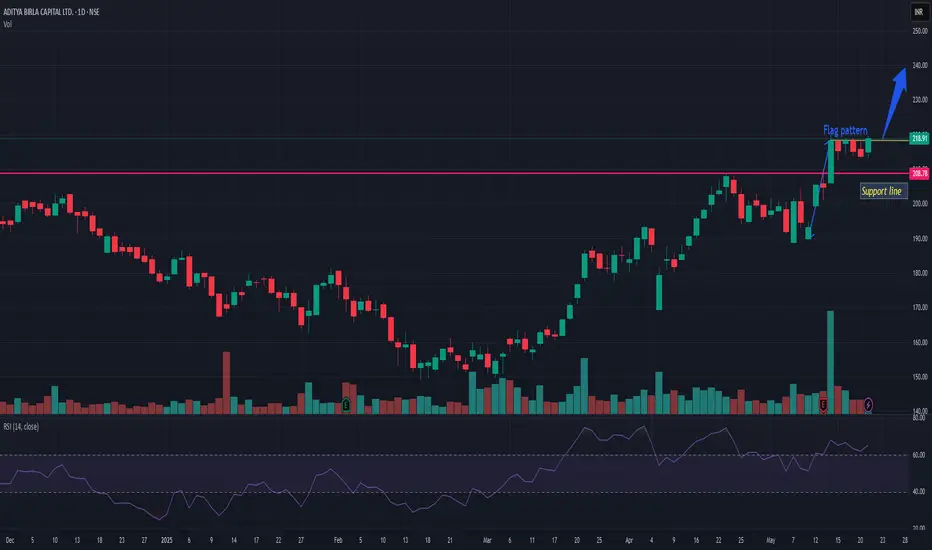
ABCAPITALABCAPITAL is getting stronger and giving short term flag pattern breakout. Only thing which is lacking is enough market participation. If it gets market participation than average then it can do wonders in short term. I would keep a closer look if it sustain above 220.
APL Apollo Tubes - Flag & Pole BONSE:APLAPOLLO gave a Flag & Pole Breakout today. Post Q4 Results.
Con-Call Highlights:
MARCH-QUARTER CONSOL TOTAL REVENUE FROM OPERATIONS 55.09 BILLION RUPEES
MARCH-QUARTER CONSOL PROFIT 2.93 BILLION RUPEES
SEES TOTAL CAPACITY OF 6.8 MILLION TONS BY FY28
SEES CAPEX OF 15 BILLION RUPEES IN NEXT 3 YEARS
Keep in the Watchlist.
NO RECO. For Buy/Sell.
Disclaimer: "I am not a SEBI REGISTERED RESEARCH ANALYST AND INVESTMENT ADVISER."
This analysis is intended solely for informational and educational purposes and should not be interpreted as financial advice. It is advisable to consult a qualified financial advisor or conduct thorough research before making investment decisions.

CarTrade Tech- CnH FnP. Keep on Radar📊 CarTrade Tech - Technical Analysis 🚗
Reason for Picking This Stock:
CarTrade Tech has been in an uptrend since March 2023, trading within a rising channel. The stock tends to take support near the 50 DMA and the channel bottom, showcasing strong demand in those areas.
✨ Key Highlights:
1️⃣ Breakout from 3.5-Year Resistance: The stock has broken above a significant 3.5-year-old resistance level of ₹1,622.85 and gave a weekly closing above it.
2️⃣ Chart Patterns:
Cup and Handle (CnH) formation near the 3.5-year resistance.
Flag and Pole (FnP) pattern adds conviction to the breakout.
3️⃣ No Overhead Resistance: The left side of the chart shows no major resistance, providing room for upside movement.
4️⃣ Relative Strength in Market Correction: The stock has held strong during the broader market correction.
🎯 Trading Levels & Risk-Reward (R:R):
Entry: ₹1,835
Stop Loss (Closing Basis): ₹1,514
Positional Target: ₹2,543
SL %: 17.5%
R:R: 1:2
📌 How to Trade:
✅ Wait for Confirmation: A clear breakout with volume and a wide-range candle will strengthen the setup.
✅ Small Position Size: As the market trend is bearish, trade with reduced risk.
✅ Pullback Entry: Look for a pullback to the 50 DMA region or channel bottom for better risk-reward entries.
✅ Add on Base Formation: If the stock consolidates above the breakout level and breaks out again, consider this as a further entry point.
⚠️ Risk Considerations:
🚨 The broader market is trading well below the 50 DMA and 200 DMA, with a death cross in play. Committing large capital at this point may not be advisable.
🚨 This is a pure technical call on a fundamentally weak company. Perform your own due diligence before trading.
💡 Key Points to Watch:
1️⃣ Clear breakout from the Flag and Pole (FnP) and Cup and Handle (CnH) patterns.
2️⃣ The channel top may act as a resistance, so monitor price action near those levels.
3️⃣ Broader market stabilization above the 200 DMA and 50 DMA is crucial for larger capital deployment.
🚦 Final Thoughts:
CarTrade Tech is showing relative strength in a falling market—a key factor for stock selection during corrections. The intention is to highlight opportunities in stocks performing well despite broader market weakness. Trade cautiously and stick to strict risk management. 💪 and do not wait for target to be achieved in this market condition. Try to book partial and trail SL.
📉 Disclaimer: This analysis is for educational purposes only and not financial advice. Always consult your financial advisor before making any trading decisions.

DIVISLAB Flag and Pole FormationTrade Setup
Entry Level: ₹6,336 🚀
Stop Loss (SL): ₹5,323 (Closing Basis)
SL Percentage: -16.01% 📉
Target Levels:
T1 (Positional Target): ₹7,404 (+16.88%) 🎯
Risk-to-Reward (R:R): 1:1⚖️
Technical Highlights
📌 Flag & Pole: The stock shows a strong flag and pole pattern, indicating bullish potential.
📌 Key DMAs: Trading comfortably above key moving averages (DMAs), adding strength to the setup.
📌 Pullback Bounce: Well-supported bounce after pullbacks.
📌 Volume: Needs improvement for stronger confirmation.
📌 RSI: Decent, supportive of the setup.
Key Strategy
⚡ Wait for Volume Confirmation: Entry should be accompanied by increasing volumes to ensure breakout sustainability.
⚡ Tight Monitoring: Since the R:R is moderate, ensure disciplined adherence to the SL.
⚡ Partial Booking at ₹7,000: Optional for risk reduction before T1.
Risks:
1️⃣ Volume Concern: Weak volume might fail to sustain breakout.
2️⃣ Broader Market Trends: Adverse market movements may impact performance despite strong technicals.
💬 Execute cautiously, and ensure disciplined trading!
⚠ Disclaimer: This is for educational purposes and not financial advice. Please consult your advisor before trading.

MAN INFRA: potential upside move<Man infra has successfully given breakout of two good chart patterns.
<Flag and pole which is clearly visible.
<Triangle pattern which can be seen if we draw a line from top red candle to the <breakout candle respecting all the wicks.
<We are learning this trade respecting the flag pattern.
<The stock has given upside breakout with good volume indicating bulls hold.
<The risk reward ratio for the trade is 1:5.

OIL bullish for short term upside to 550Hello Everyone,
Have spotted a bullish pattern on the chart that can take the prices to 510-550 in the short while.
Points to note:
> Out of all, Oil sector is showing some strength.
> OIL has seen recovery for the current support levels multiple times in the past.
> Trading above 100EMA with good volumes.
> Hammer spotted
Important leves:
Support: 464
Resistence: 450
Entry Levels: 485-490
Exit Levels: 464 or trail with EMA 100 once it breaches 500 levels.
Risk to Reward: Optimal Entry 485 – Target 550 = Almost 3x Reward to Risk

flag pattern breakout Pitti Engineering has broke the flag pattern. This trade is little risky because the candle next to breakout candle has shown resistance to bulls and also the volume is very high but since it is Doji candle there is indecisiveness. To swing high in this trade entry could be made tomorrow or we can wait for this week's closing. Breakout candle has good volume.
