SIEMENS LTD - Bullish Flag & Pole Breakout (Daily T/F)Trade Setup
📌 Stock: SIEMENS LTD ( NSE:SIEMENS )
📌 Trend: Strong Bullish Momentum
📌 Risk-Reward Ratio: 1:3 (Favorable)
🎯 Entry Zone: ₹3383.00 (Breakout Confirmation)
🛑 Stop Loss: ₹3208.00 (Daily Closing Basis) (-5 % Risk)
🎯 Target Levels:
₹3484.50
₹3589.10
₹3696.80
₹3807.70
₹3922.00 (Final Target)
Technical Rationale
✅ Bullish Flag & Pole Breakout - Classic bullish pattern confirming uptrend continuation
✅ Strong Momentum - Daily RSI >69 , Weekly RSI >59 & Monthly RSI >59 (Bullish zone)
✅ Volume Confirmation - Breakout volume 15.52M vs previous day's 4.27M (Nearly 4x surge)
✅ Multi-Timeframe Alignment - Daily and weekly charts showing strength
Key Observations
• The breakout comes with significantly higher volume, validating strength
• Well-defined pattern with clear price & volume breakout
• Conservative stop loss at recent swing low
Trade Management Strategy
• Consider partial profit booking at each target level
• Move stop loss to breakeven after Target 1 is achieved
• Trail stop loss to protect profits as price progresses
Disclaimer ⚠️
This analysis is strictly for educational purposes and should not be construed as financial advice. Trading in equities involves substantial risk of capital loss. Past performance is not indicative of future results. Always conduct your own research, consider your risk appetite, and consult a financial advisor before making any investment decisions. The author assumes no responsibility for any trading outcomes based on this information.
What do you think? Are you watching NSE:SIEMENS for this breakout opportunity? Share your views in the comments!
Flagformationbreak

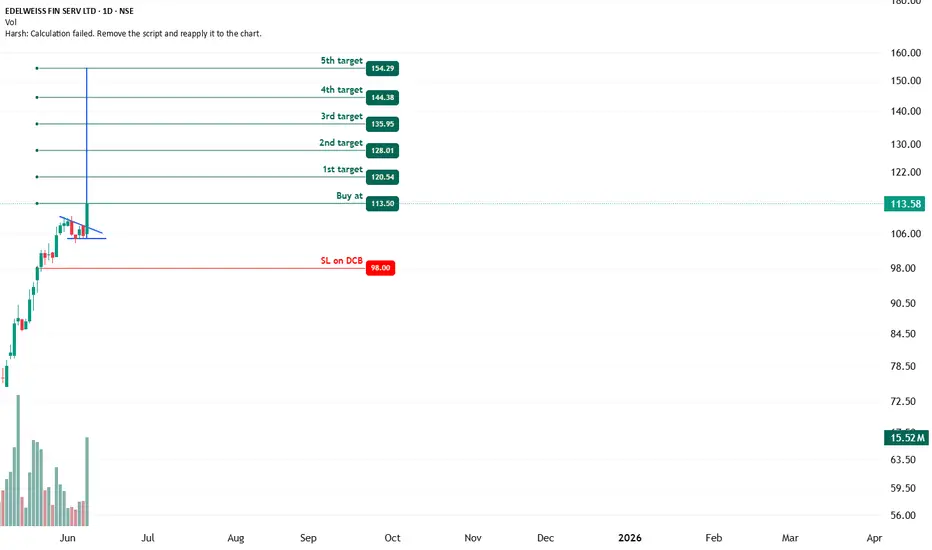
EDELWEISS FIN SERV - Bullish Flag & Pole Breakout (Daily T/F)Trade Setup
📌 Stock: EDELWEISS FIN SERV LTD ( NSE:EDELWEISS )
📌 Trend: Strong Bullish Momentum
📌 Risk-Reward Ratio: 1:3 (Favorable)
🎯 Entry Zone: ₹113.50 (Breakout Confirmation)
🛑 Stop Loss: ₹98.00 (Daily Closing Basis) (-14 % Risk)
🎯 Target Levels:
₹120.54
₹128.01
₹135.95
₹144.38
₹154.29 (Final Target)
Technical Rationale
✅ Bullish Flag & Pole Breakout - Classic bullish pattern confirming uptrend continuation
✅ Strong Momentum - Daily RSI >60 , Weekly RSI >56 & Monthly RSI >59 (Bullish zone)
✅ Volume Confirmation - Breakout volume 15.52M vs previous day's 4.27M (Nearly 4x surge)
✅ Multi-Timeframe Alignment - Daily and weekly charts showing strength
Key Observations
• The breakout comes with significantly higher volume, validating strength
• Well-defined pattern with clear price & volume breakout
• Conservative stop loss at recent swing low
Trade Management Strategy
• Consider partial profit booking at each target level
• Move stop loss to breakeven after Target 1 is achieved
• Trail stop loss to protect profits as price progresses
Disclaimer ⚠️
This analysis is strictly for educational purposes and should not be construed as financial advice. Trading in equities involves substantial risk of capital loss. Past performance is not indicative of future results. Always conduct your own research, consider your risk appetite, and consult a financial advisor before making any investment decisions. The author assumes no responsibility for any trading outcomes based on this information.
What do you think? Are you watching NSE:EDELWEISS for this breakout opportunity? Share your views in the comments!
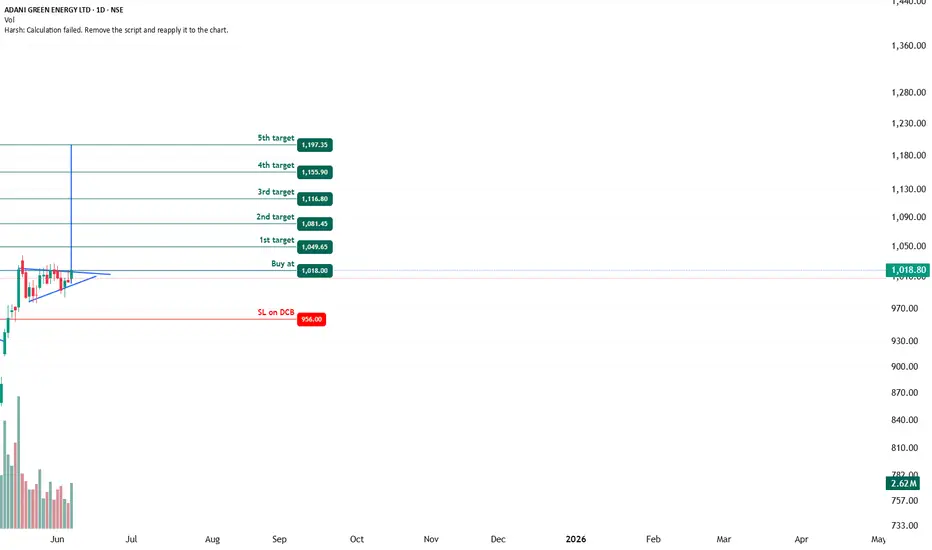
ADANI GREEN ENERGY - Bullish Flag & Pole Breakout (Daily T/F)Trade Setup
📌 Stock: ADANI GREEN ENERGY ( NSE:ADANIGREEN )
📌 Trend: Strong Bullish Momentum
📌 Risk-Reward Ratio: 1:3 (Favorable)
🎯 Entry Zone: ₹1018.00 (Breakout Confirmation)
🛑 Stop Loss: ₹956.00 (Daily Closing Basis) (-6 % Risk)
🎯 Target Levels:
₹1049.65
₹1081.45
₹1116.80
₹1155.90
₹1197.35 (Final Target)
Technical Rationale
✅ Bullish Flag & Pole Breakout - Classic bullish pattern confirming uptrend continuation
✅ Strong Momentum - Daily & Weekly RSI >60 (Bullish zone)
✅ Volume Confirmation - Breakout volume 2.62M vs previous day's 1.4M (Nearly 2x surge)
✅ Multi-Timeframe Alignment - Daily and weekly charts showing strength
Key Observations
• The breakout comes with significantly higher volume, validating strength
• Well-defined pattern with clear price & volume breakout
• Conservative stop loss at recent swing low
Trade Management Strategy
• Consider partial profit booking at each target level
• Move stop loss to breakeven after Target 1 is achieved
• Trail stop loss to protect profits as price progresses
Disclaimer ⚠️
This analysis is strictly for educational purposes and should not be construed as financial advice. Trading in equities involves substantial risk of capital loss. Past performance is not indicative of future results. Always conduct your own research, consider your risk appetite, and consult a financial advisor before making any investment decisions. The author assumes no responsibility for any trading outcomes based on this information.
What do you think? Are you watching NSE:ADANIGREEN for this breakout opportunity? Share your views in the comments!
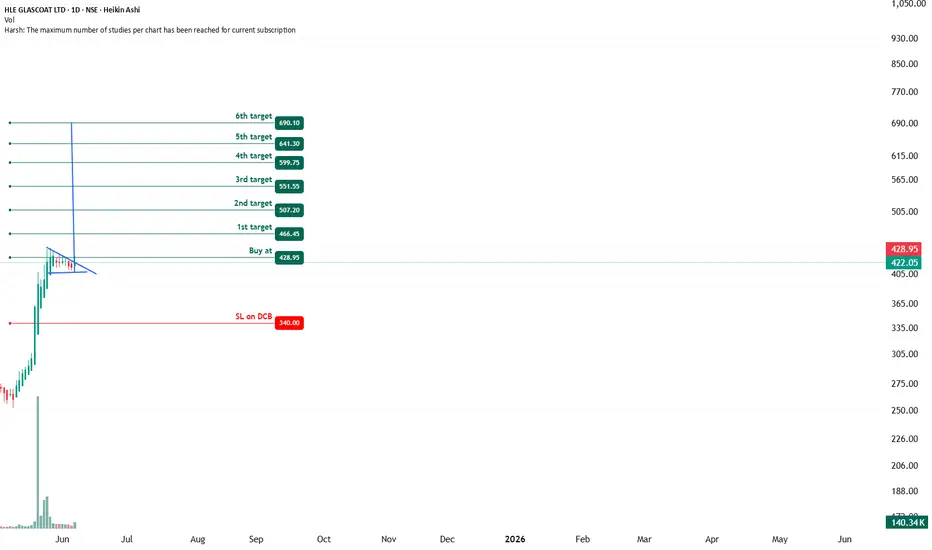
HLW GLASSCOAT - Bullish Flag & Pole Breakout (Daily T/F)Trade Setup
📌 Stock: HLE GLASSCOAT ( NSE:HLEGLAS )
📌 Trend: Strong Bullish Momentum
📌 Risk-Reward Ratio: 1:3 (Favorable)
🎯 Entry Zone: ₹428.95 (Breakout Confirmation)
🛑 Stop Loss: ₹340.00 (Daily Closing Basis) (-20 % Risk)
🎯 Target Levels:
₹466.45
₹507.20
₹551.55
₹599.75
₹641.30
₹690.10 (Final Target)
Technical Rationale
✅ Bullish Flag & Pole Breakout - Classic bullish pattern confirming uptrend continuation
✅ Strong Momentum - Daily & Weekly RSI >60 (Bullish zone)
✅ Volume Confirmation - Breakout volume 140.38K vs previous day's 55.08K (Nearly 3x surge)
✅ Multi-Timeframe Alignment - Daily and weekly charts showing strength
Key Observations
• The breakout comes with significantly higher volume, validating strength
• Well-defined pattern with clear price & volume breakout
• Conservative stop loss at recent swing low
Trade Management Strategy
• Consider partial profit booking at each target level
• Move stop loss to breakeven after Target 1 is achieved
• Trail stop loss to protect profits as price progresses
Disclaimer ⚠️
This analysis is strictly for educational purposes and should not be construed as financial advice. Trading in equities involves substantial risk of capital loss. Past performance is not indicative of future results. Always conduct your own research, consider your risk appetite, and consult a financial advisor before making any investment decisions. The author assumes no responsibility for any trading outcomes based on this information.
What do you think? Are you watching NSE:HLEGLAS for this breakout opportunity? Share your views in the comments!
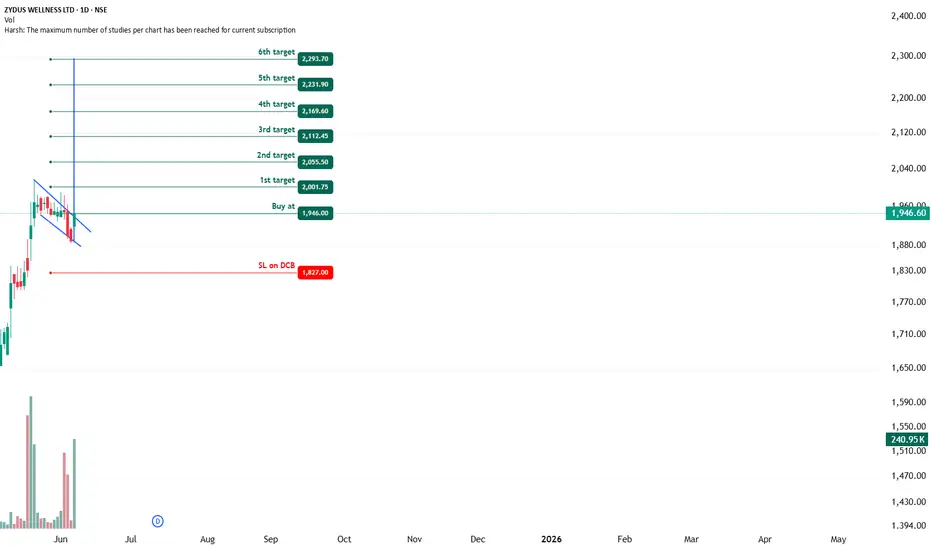
ZYDUS WELLNESS - Bullish Flag & Pole Breakout (Daily T/F)Trade Setup
📌 Stock: ZYDUS WELLNESS ( NSE:ZYDUSLIFE )
📌 Trend: Strong Bullish Momentum
📌 Risk-Reward Ratio: 1:3 (Favorable)
🎯 Entry Zone: ₹1946.00 (Breakout Confirmation)
🛑 Stop Loss: ₹1827.00(Daily Closing Basis) (-6 % Risk)
🎯 Target Levels:
₹2001.75
₹2055.50
₹2112.45
₹2169.60
₹2231.90
₹2293.70 (Final Target)
Technical Rationale
✅ Bullish Flag & Pole Breakout - Classic bullish pattern confirming uptrend continuation
✅ Strong Momentum - Daily & Weekly RSI >60 (Bullish zone)
✅ Volume Confirmation - Breakout volume 240.95K vs previous day's 20.49K (Nearly 12x surge)
✅ Multi-Timeframe Alignment - Daily and weekly charts showing strength
Key Observations
• The breakout comes with significantly higher volume, validating strength
• Well-defined pattern with clear price & volume breakout
• Conservative stop loss at recent swing low
Trade Management Strategy
• Consider partial profit booking at each target level
• Move stop loss to breakeven after Target 1 is achieved
• Trail stop loss to protect profits as price progresses
Disclaimer ⚠️
This analysis is strictly for educational purposes and should not be construed as financial advice. Trading in equities involves substantial risk of capital loss. Past performance is not indicative of future results. Always conduct your own research, consider your risk appetite, and consult a financial advisor before making any investment decisions. The author assumes no responsibility for any trading outcomes based on this information.
What do you think? Are you watching NSE:ZYDUSLIFE for this breakout opportunity? Share your views in the comments!
UTI ASSET MNGMT - Bullish Flag & Pole Breakout (Daily T/F)Trade Setup
📌 Stock: UTI ASSET MNGMT ( NSE:UTIAMC )
📌 Trend: Strong Bullish Momentum
📌 Risk-Reward Ratio: 1:3 (Favorable)
🎯 Entry Zone: ₹1220.45(Breakout Confirmation)
🛑 Stop Loss: ₹1141.00(Daily Closing Basis) (-6.6% Risk)
🎯 Target Levels:
₹1253.75
₹1287.95
₹1323.05
₹1355.50
₹1390.60
₹1424.70
₹1461.60 (Final Target)
Technical Rationale
✅ Bullish Flag & Pole Breakout - Classic bullish pattern confirming uptrend continuation
✅ Strong Momentum - Daily, Weekly & Monthly RSI >60 (Bullish zone)
✅ Volume Confirmation - Breakout volume 754.88K vs previous day's 178.21K (Nearly 4.5x surge)
✅ Multi-Timeframe Alignment - Daily and weekly charts showing strength
Key Observations
• The breakout comes with significantly higher volume, validating strength
• Well-defined pattern with clear price & volume breakout
• Conservative stop loss at recent swing low
Trade Management Strategy
• Consider partial profit booking at each target level
• Move stop loss to breakeven after Target 1 is achieved
• Trail stop loss to protect profits as price progresses
Disclaimer ⚠️
This analysis is strictly for educational purposes and should not be construed as financial advice. Trading in equities involves substantial risk of capital loss. Past performance is not indicative of future results. Always conduct your own research, consider your risk appetite, and consult a financial advisor before making any investment decisions. The author assumes no responsibility for any trading outcomes based on this information.
What do you think? Are you watching NSE:UTIAMC for this breakout opportunity? Share your views in the comments!

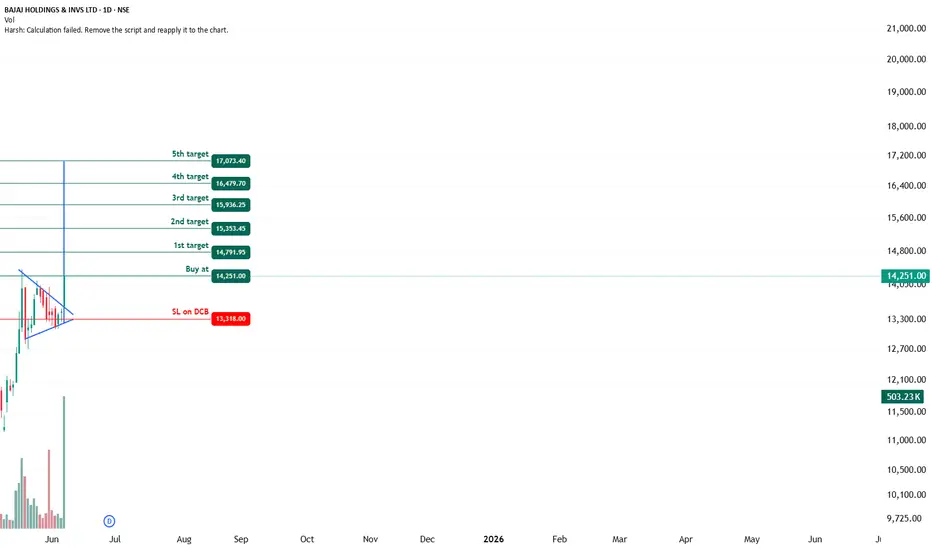
BAJAJ HOLDINGS - Bullish Flag & Pole Breakout (Daily T/F)Trade Setup
📌 Stock: BAJAJ HOLDINGS ( NSE:BAJAJHLDNG )
📌 Trend: Strong Bullish Momentum
📌 Risk-Reward Ratio: 1:3 (Favorable)
🎯 Entry Zone: ₹14251.00 (Breakout Confirmation)
🛑 Stop Loss: ₹13318.00(Daily Closing Basis) (-6.3% Risk)
🎯 Target Levels:
₹14791.95
₹15355.45
₹15936.25
₹16479.70
₹17073.40 (Final Target)
Technical Rationale
✅ Bullish Flag & Pole Breakout - Classic bullish pattern confirming uptrend continuation
✅ Strong Momentum - Daily, Weekly & Monthly RSI >60 (Bullish zone)
✅ Volume Confirmation - Breakout volume 503.23K vs previous day's 39.22K (Nearly 13x surge)
✅ Multi-Timeframe Alignment - Daily and weekly charts showing strength
Key Observations
• The breakout comes with significantly higher volume, validating strength
• Well-defined pattern with clear price & volume breakout
• Conservative stop loss at recent swing low
Trade Management Strategy
• Consider partial profit booking at each target level
• Move stop loss to breakeven after Target 1 is achieved
• Trail stop loss to protect profits as price progresses
Disclaimer ⚠️
This analysis is strictly for educational purposes and should not be construed as financial advice. Trading in equities involves substantial risk of capital loss. Past performance is not indicative of future results. Always conduct your own research, consider your risk appetite, and consult a financial advisor before making any investment decisions. The author assumes no responsibility for any trading outcomes based on this information.
What do you think? Are you watching NSE:BAJAJHLDNG for this breakout opportunity? Share your views in the comments!
IRFC - Bullish Flag & Pole Breakout (Daily T/F)Trade Setup
📌 Stock: IRFC ( NSE:IRFC )
📌 Trend: Strong Bullish Momentum
📌 Risk-Reward Ratio: 1:3 (Favorable)
🎯 Entry Zone: ₹144.00 (Breakout Confirmation)
🛑 Stop Loss: ₹134.00 (Daily Closing Basis) (-6.8% Risk)
🎯 Target Levels:
₹149.62
₹155.58
₹161.95
₹168.24
₹174.60 (Final Target)
Technical Rationale
✅ Bullish Flag & Pole Breakout - Classic bullish pattern confirming uptrend continuation
✅ Strong Momentum - Daily, Weekly & RSI >60 (Bullish zone)
✅ Volume Confirmation - Breakout volume 60.01M vs previous day's 23.1M (Nearly 3x surge)
✅ Multi-Timeframe Alignment - Daily and weekly charts showing strength
Key Observations
• The breakout comes with significantly higher volume, validating strength
• Well-defined pattern with clear price & volume breakout
• Conservative stop loss at recent swing low
Trade Management Strategy
• Consider partial profit booking at each target level
• Move stop loss to breakeven after Target 1 is achieved
• Trail stop loss to protect profits as price progresses
Disclaimer ⚠️
This analysis is strictly for educational purposes and should not be construed as financial advice. Trading in equities involves substantial risk of capital loss. Past performance is not indicative of future results. Always conduct your own research, consider your risk appetite, and consult a financial advisor before making any investment decisions. The author assumes no responsibility for any trading outcomes based on this information.
What do you think? Are you watching NSE:IRFC for this breakout opportunity? Share your views in the comments!

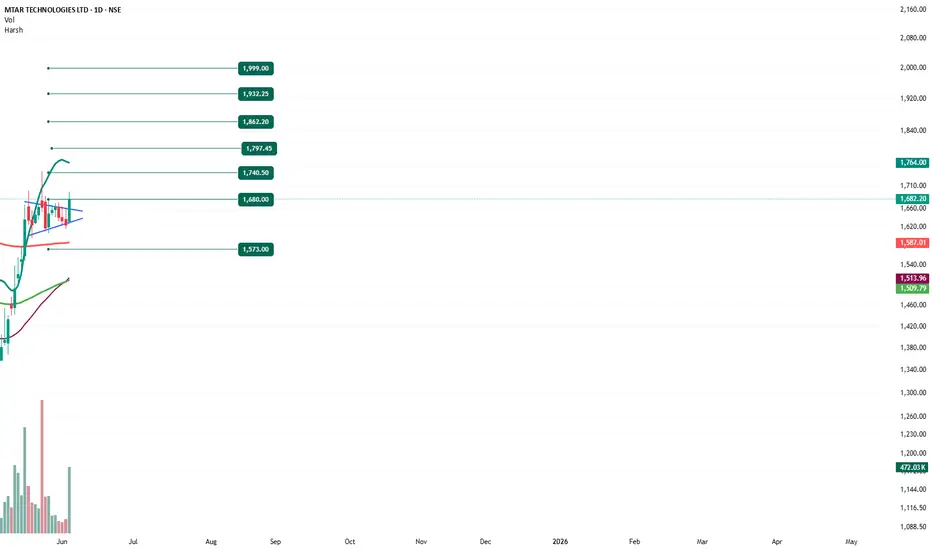
MTAR TECHNOLOGIES - Bullish Flag & Pole Breakout (Daily T/F)Trade Setup
📌 Stock: MTAR TECHNOLOGIES LTD ( NSE:MTARTECH )
📌 Trend: Strong Bullish Momentum
📌 Risk-Reward Ratio: 1:3 (Favorable)
🎯 Entry Zone: ₹1680.00 (Breakout Confirmation)
🛑 Stop Loss: ₹1573.00 (Daily Closing Basis) (-6.3% Risk)
🎯 Target Levels:
₹1740.50
₹1797.45
₹1862.20
₹1932.25
₹1999.00 (Final Target)
Technical Rationale
✅ Bullish Flag & Pole Breakout - Classic bullish pattern confirming uptrend continuation
✅ Strong Momentum - Daily, Weekly & RSI >60 (Bullish zone)
✅ Volume Confirmation - Breakout volume 472.5K vs previous day's 98.43K (Nearly 4.7x surge)
✅ Multi-Timeframe Alignment - Daily and weekly charts showing strength
Key Observations
• The breakout comes with significantly higher volume, validating strength
• Well-defined pattern with clear price & volume breakout
• Conservative stop loss at recent swing low
Trade Management Strategy
• Consider partial profit booking at each target level
• Move stop loss to breakeven after Target 1 is achieved
• Trail stop loss to protect profits as price progresses
Disclaimer ⚠️
This analysis is strictly for educational purposes and should not be construed as financial advice. Trading in equities involves substantial risk of capital loss. Past performance is not indicative of future results. Always conduct your own research, consider your risk appetite, and consult a financial advisor before making any investment decisions. The author assumes no responsibility for any trading outcomes based on this information.
What do you think? Are you watching NSE:MTARTECH for this breakout opportunity? Share your views in the comments!
Medium term trading opportunity in Sar Tele for V. Good UpsideHi,
NSE:SARTELE has given a Bullish Flag Breakout on Weekly charts with very good volume.
MACD is also on the bullish side on Weekly time frames. RSI is also on the bullish side on daily, weekly and monthly time frames.
In the current market scenario, I am expecting that the bullish momentum will continue.
Complete price projection like entry, stop loss and targets mentioned on the charts for educational purpose.
Don't Forget to Follow me to get all the updates.
Please share your feedback or any queries on the study.
Disclaimer: Please consult your financial advisor before making any investment decision.

Mazgaon DockMazgaon Dock Has Closed above Fibonacci Level with good volumes and momentum one can buy above 2310 sl 2250 tgt 2500.
Disclaimer: I am not SEBI registered Analyst Kindly consult your financial Advisor before taking any trading decision

Long Setup in Choice InternationalAn On Neck Chart Pattern Breakout happened on the Weekly Time frame of NSE:CHOICEIN
Price Action is well supported by the volume.
The stock is currently in uptrend making higher highs and higher lows.
One can add this stock into their stocks to buy list.
Initiate the long trade only according to the levels mentioned.
Stop loss will be on a Weekly closing basis.
Trend Analysis :- UP Trend
Chart Pattern :- Bullish On-Neck Chart Pattern
Technical Indicator :- Positive MACD Crossover

Daily Bullish Flag Pattern BO in HEUBACH COLORANTSIntroduction:
The new Heubach Group brings together two of the industry’s leading color innovators – Heubach and Clariants’s Global Colorants Business. With a tradition of delivering excellence that stretches back over 200 years, the Heubach name is synonymous with innovation, attention to customer needs and reliability in creating colors.
Today’s Heubach is a global industry leader with one of the world’s most complete portfolios of organic, inorganic and anti-corrosive pigments, pigment preparations, dyes and specialty materials for various applications. With a global manufacturing footprint including 19 facilities around the globe, Heubach is committed to a reliable supply of high-quality materials to meet customers demanding production environments. Sustainability is a part of the Heubach DNA.
We deliver industry leading, best-in-class and sustainable color solutions to brighten the lives of our customers, wherever they are.
Analysis
A Bullish Flag and Pole pattern is visible on the Daily chart of $NSE:HEUBACHIND. The Flag and Pole pattern is a bullish continuation pattern and it is visible in charts after a meaningful appreciation in the price.
MACD gave Positive crossover on Daily, Weekly and Monthly chart. So, expecting the momentum to continue.
One can create a fresh position in the scrip near Rs. 515-525 levels with the stoploss of Rs. 500 on Daily closing basis for the following targets 539.45, 557.25, 569.05, 581.15, 602.30 and 319.10.
Risk Disclaimer:
The trading ideas and analyses presented here are for educational purposes only and do not constitute financial advice. Trading and investing in financial markets involve risk. You should carefully consider your own financial situation, risk tolerance, and investment objectives before making any investment decisions.
The information provided in this analysis is based on my personal interpretation of market conditions and the available data at the time of writing. It is subject to change without notice, and I cannot guarantee the accuracy, completeness, or timeliness of the information provided.
Trading and investing carry the risk of substantial losses, and past performance is not indicative of future results. Always be aware that markets can be unpredictable, and prices may move against your trade or investment.
It is advisable to seek advice from a qualified financial professional and to conduct your own research before making any investment decisions. You should only invest funds that you can afford to lose.
I am not responsible for any trades or investments made based on the information presented in this analysis. By reading and using this information, you acknowledge and accept that you are solely responsible for any losses you may incur.

Genus Power Daily Flag BreakoutA Flag and Pole Breakout structure is visible on the daily chart of NSE:GENUSPOWER with very good voulme. Expecting it countnue its uptrend and may reach my target in very short span of time(my be within two weeks) Risk reward ration is also favourable. RSI on Daily and Weekly chart both are bullish.
------------------Entry@172
Exit@157(DCB)
---------------------------------Target1@187
----------------------------------------------------------Target2@202
------------------------------------------------------------------------------------Target3@217
xit the position if the stop loss triggered on DCB.
DO YOU WANT ALL MY RESEARCH FOR FREE THEN DON'T FORGET TO FOLLOW ME.
I AM EAGERLY WAITING FOR YOU COMMENTS ON THE STUDY...
Disclaimer: Content shared is for information and education purposes only and should not be treated as investment or trading advice. Please do your own analysis or take independent professional financial advice before making any investments based on your own personal circumstances. Investment in securities are subject to market risks, please carry out your due diligence before investing. And last but not the least, past performance is not indicative of future returns.

Banknifty Bullish Flag Breakout doneBanknifty Spot Bullish Flag Breakout done for long term can look for retest
around 37000-37300 levels for safe players with good risk to reward ratio
for such more analysis s m s 9 1 6 3 3 8 8 9 9 6
Disclaimer : only for educational and learning purpose

Wondrela Holidays, Bullish Flag BOA Bullish Flag emeged in the daily chart. Entry, Traget and Stop Loss mentioned the chart itself.
Stop Loss shoud be followed on Closing Basis.

GREAT OPPORTUNITY IN INDIA CEMENTS Can go long in INDIA CEMENTS because of the following reasons:
Range breakout with 2x avg volume.
Trend Line breakout.
Flag Formation Breakout.
Target - 230
Entry - 203
Stoploss - 187
