Perfect F&P on Bitcoins daily charts (21/01/26)Bitcoin forming good chart pattern on the daily charts.
The charts is a perfect example of a Flag and Pole pattern. If the pattern completes there are chance of seeing bitcoin dipping.
Identifying the last support around 85K. Be watchful if price dips below it.
Flag

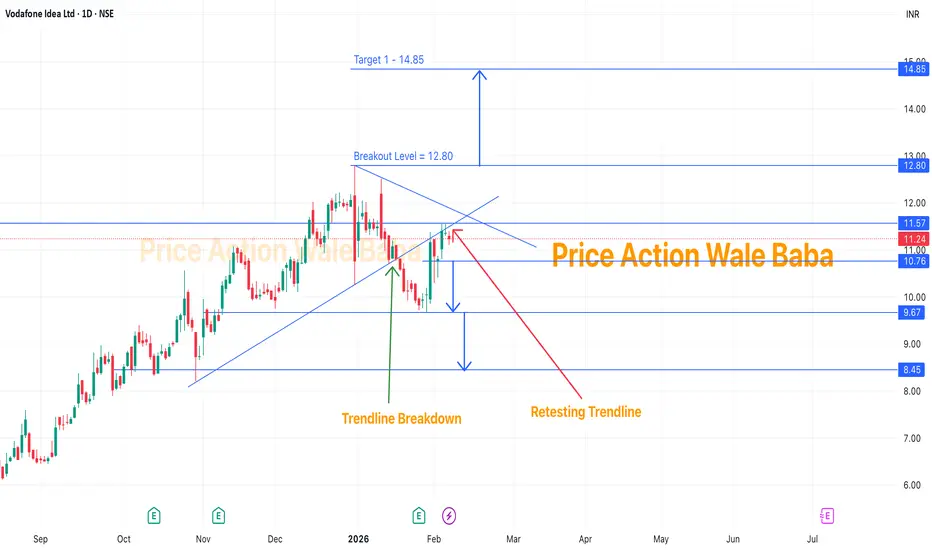
Vodafone - IdeaVodafone idea is the most trending stocks when comes to trading, because of small prices and movement.
Here, I have done some analysis of it and where you can find its trend.
1. Trend Understanding
- Vodafone idea was consolidating and then give the breakdown from rising channel or bearish flag.
- Then it had made a low of 9.68 and pull back to re-testing trendline.
- So, it is on trendline retesting and not going up.
2. Bearish Strategy
- So, what's now?? We should check if it will go down from here and again touch 9.68, then it will formed a head and shoulders pattern with neckline level 9.68.
- When it breaks 9.68 we can sell it for the target of 8.45.
3. Bullish Strategy
- Now, to see upside, we have to wait when it will breaks it high of 12.80.
- Once, it will breaks and sustain above 12.80, we will see target of 14.85 and more.
So, untill it can be sideways and consolidation in range of 12.80 and 9.68.
BEL Triangle & Flag BreakoutBEL is attempting breakout from Triangle and Bull Flag Pattern on 1D timeframe. Watch for closing at End of the Day. Watch for Earnings because this stock carries earnings risk.

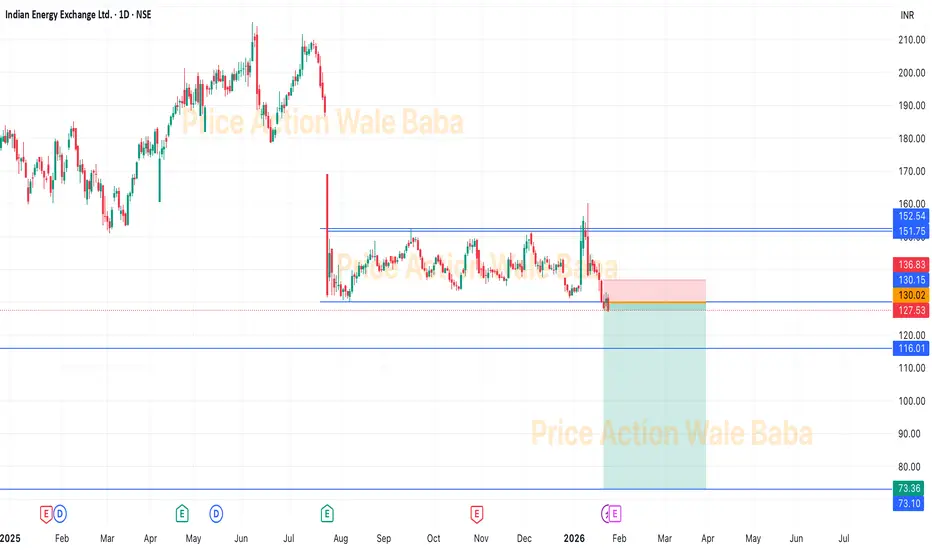
IEX - Box BreakoutIEX was consolidating in the box from the long time and now it's out of the box.
It is good to short IEX and hold for the target of 115-110
Although, you can keep in the hold for the target of 80-75 as we know government policy are comes against IEX's monopoly.
VOLTAS (15-Min) – Bearish Flag in PlayVOLTAS is forming a classic bearish flag & pole on the 15-minute timeframe. The sharp decline marks strong selling pressure, followed by a slow, overlapping upward channel, which is corrective in nature.
As long as price remains within this rising flag, the structure stays intact. A breakdown below the channel is the trigger, opening the door for continuation on the downside.
Disclaimer: This analysis is for educational purposes only and does not constitute investment advice. Please do your own research (DYOR) before making any trading decisions.

Bullish Flag Brewing in Bandhan BankBandhan Bank is consolidating after a sharp decline, forming what appears to be a potential bullish flag on the chart. The ongoing pullback is overlapping and corrective , suggesting digestion rather than a fresh impulsive sell-off.
As long as price holds above the 141 support zone , the bullish flag structure remains valid. A decisive breakout above the upper channel boundary would confirm continuation and open the door for higher levels.
Until then, this remains a wait-for-confirmation setup , with clearly defined risk and invalidation.
Disclaimer: This analysis is for educational purposes only and does not constitute investment advice. Please do your own research (DYOR) before making any trading decisions.


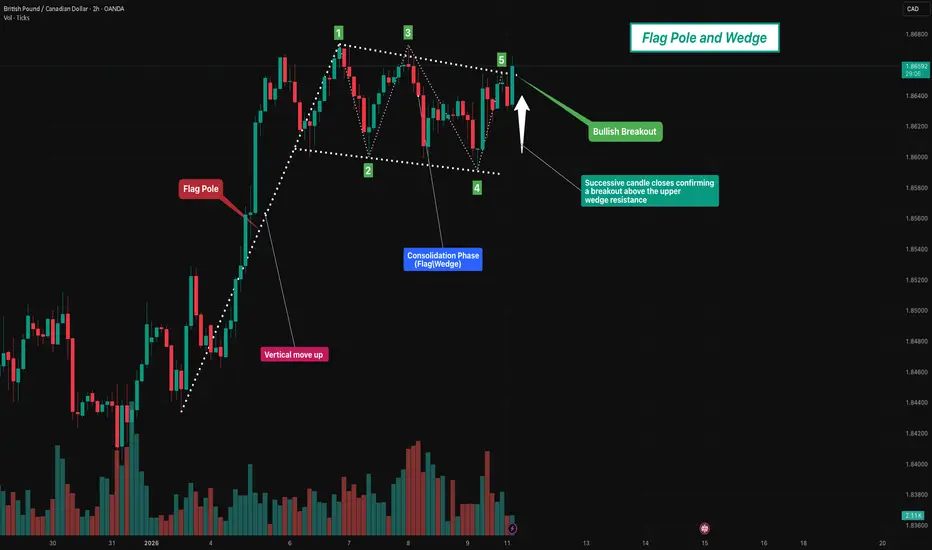
Flag pole and Wedge🧭 Overview
The chart illustrates a strong bullish impulse followed by a descending wedge formation, a well-known trend continuation structure.
After a sharp upward move (flag pole), price enters a controlled pullback where volatility contracts, forming lower highs and slightly lower or stable lows.
This setup represents a healthy pause in the trend, indicating accumulation and preparation for a potential bullish continuation.
⸻⸻⸻⸻⸻⸻⸻⸻⸻⸻⸻⸻⸻
📊 Chart Observations
1. The initial move shows strong bullish momentum, creating the flag pole with decisive candles.
2. Following the impulsive rally, price starts forming Lower Highs, indicating short-term profit booking.
3. Simultaneously, the lows remain controlled and gradual, shaping a descending wedge structure.
4. Price consolidates within the wedge, reflecting volatility contraction and market balance.
5. The prior flag pole suggests that the dominant trend remains bullish, favoring continuation rather than reversal.
6. As the wedge tightens, pressure builds for a breakout, typically in the direction of the prevailing trend.
7. Confirmation: A valid bullish continuation is confirmed when successive candles close above the upper wedge trendline.
⸻⸻⸻⸻⸻⸻⸻⸻⸻⸻⸻⸻⸻
🟢 Summary
Structure: Flag Pole + Descending Wedge
Market Context: Strong uptrend with healthy corrective consolidation
Trade Bias: Bullish — focus on breakout above the upper wedge boundary
Key Validation: Consecutive candle closes above wedge resistance
⸻⸻⸻⸻⸻⸻⸻⸻⸻⸻⸻⸻⸻
⚠️ Disclaimer
📘 For educational purposes only
🙅 Not SEBI registered
❌ Not a buy/sell recommendation
🧠 Shared purely for learning and pattern understanding
📊 Not Financial Advice
Supreme Industries Cmp 3354 Flag PatternSupreme Industries Cmp 3354 dated 31-12-2025
1. Flag Pattern after a long correction
2. RSI BO
Buy @Cmp SL 3260 target 3400-3420-3450-3475-3500-
3525-3550-3575-3600-3650
It is just a view, please trade at your own risk.

UPL - Multi time frame analysis...Happy New Year, my dear followers!!! 🎉
The price in the lower time frame(15 minutes) and higher time frame(daily) is forming a bull flag breakout pattern, which is bullish.
We can use the lower time frame for trade entry.
Support zones are 780 and 800.
Buy above 801 - 804 with the stop loss of 796 for the targets 812, 821, 830, 838 and 846.
Always do your analysis before taking any trade.

Karur Vysya Bank (W): Strongly Bullish - Blue Sky BreakoutTimeframe: Weekly | Scale: Logarithmic
The stock has confirmed a "Blue Sky" breakout to a new All-Time High, clearing a multi-week consolidation pattern. This move is backed by massive institutional buying volume on Friday, signaling the start of a new markup phase.
🚀 1. The Fundamental Catalyst (The "Why")
The technical breakout is driven by strong fundamental re-rating:
> Institutional Buying: Friday's massive volume (15M+ shares in one day) suggests a large fund entry. Investors are rewarding the bank for its superior Asset Quality (Net NPA at ~0.19%, one of the lowest in the industry).
> Midcap Bank Rally: Capital is rotating from large private banks into efficiently managed midcap banks like KVB, which are delivering consistent 20%+ earnings growth.
📈 2. The Chart Structure (Flag & Pole)
> The Pole: The sharp rally from ₹200 to ₹258 (Oct–Nov) formed the "Pole."
> The Flag: The consolidation between ₹242 – ₹255 over the last 4 weeks formed the "Flag." This was a healthy pause to digest gains.
> The Breakout: This week, the stock surged 4.13% , decisively closing above the flag resistance.
- Significance: A Flag breakout in an existing uptrend is a high-probability continuation pattern.
📊 3. Volume & Indicators
> Volume Concentration: The volume wasn't just "increasing"—it exploded on the breakout day (Dec 26). This is Demand Dominance .
> RSI: Rising in Monthly/Weekly frames. Currently near 70 , which is not "overbought" in a strong trend but rather indicates a "Super Bullish" zone.
🎯 4. Future Scenarios & Key Levels
> 🐂 Bullish Targets (The Projection):
- Target 1: ₹310 .
- Target 2: ₹328 .
- Blue Sky: Since it is at an ATH, there is no overhead supply (resistance).
> 🛡️ Support (The "Must Hold"):
- Immediate Support: ₹255 – ₹258. The top of the "Flag" pattern. The stock should ideally not close back inside the flag.
- Stop Loss: Level of ₹242 is the perfect structural stop. A break below this invalidates the pattern.
Conclusion
This is a Grade A Setup .
> Refinement: The massive Friday volume confirms the breakout is real. The stock has entered "Price Discovery" mode.
> Strategy: Hold for the target of ₹310 . Any dip to ₹260 is a buying opportunity.

BTC still in Range PlayBTC is still ranging, but a correction is expected before the Christmas Decision. A Breakout above 90k will push the price to 94k, and maybe we might see some wicks to 95k. Please note this is a multi-week Bearflag Creation, and that takes around 70 Days to complete. Phase 1 is completed, phase 2 is just starting
1. Move towards 90k today - 80% Probability
2. Invalidation if price starts closing below 87k - Probability 10%
Resolution Probability in Today's US open around 7:30 PM IST

JK TyresAs per the daily chart, the price is in a steady uptrend, faced resistance at the 520 zone, and now it is having a pullback. Sustaining above 520 can make the price to move towards the next resistance at 550 zone.
In a smaller time frame, we can see that a bull flag is forming. The price can test the 500 zone and can move up. If it breaks the 500 zone, the next support is at 480. As long as the price is above 480, it is buy on dips(it is better to buy, seeing the bullish strength)
Buy above 502 with the stop loss of 497 for the targets 507, 514, 522, 530, 542 and 548.
The levels where we can expect movement with bullish strength are 484, 502 and 522.
Always do your analysis before making any trade.

Biocon Flag breakoutA good flag breakout is seen in Biocon SL a Targets on chart.
This has also formed at weekly 20ma as support and showing follow through.
Makes probability high

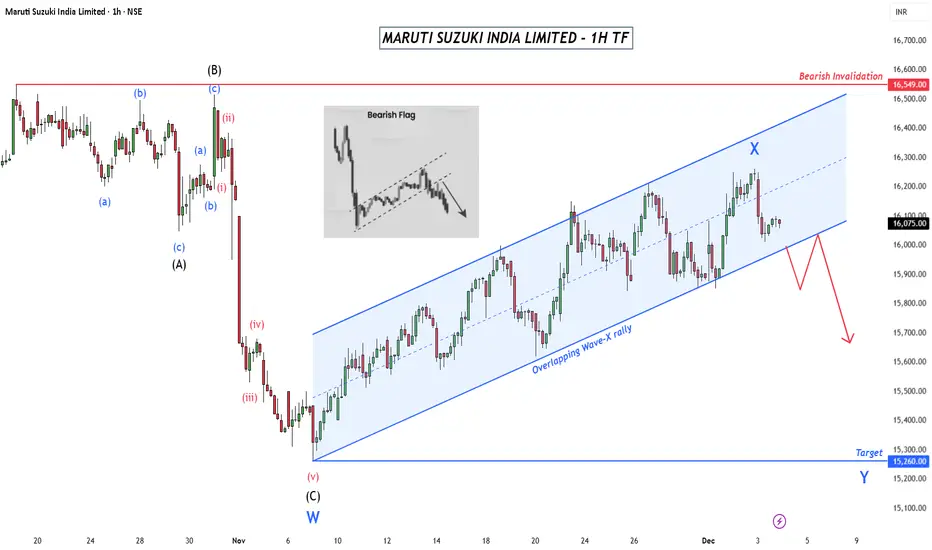
Maruti: Rising Flag, Dropping ProbabilityStructure
The decline into Wave W is complete as a Regular Flat.
The rebound is a corrective Wave X, fully overlapping and contained within a rising channel.
Bias remains bearish as long as price trades inside this channel.
Wave Y Setup
Trigger: Breakdown below the channel near 16000.
Entry: Preferable after a break and retest of the lower channel line.
Target: Toward 15,260 to complete Wave Y.
Invalidation: A decisive close above 16,549 invalidates the bearish view.
Summary
The current rise is a corrective phase, not a trend reversal. The higher-probability outcome is a continuation lower into Wave Y unless the channel breaks to the upside.
Disclaimer: This analysis is for educational purposes only and does not constitute investment advice. Please do your own research (DYOR) before making any trading decisions.
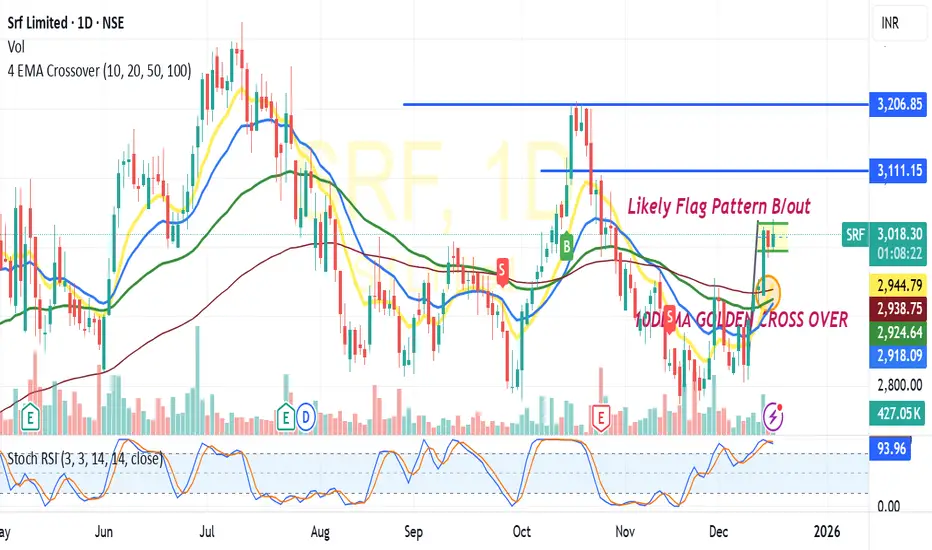
SRF : Likely Golden Cross Over & Flag Pattern Combo B/OUTSRF: Trading at 3020
Trading above all its EMA viz 10/20/50/100
Golden Cross Over in Daily Chart :10DEMA against 20/50/100
Flag Pattern Formation :Formed a flag pattern in daily chart
Neckline Breakout :Sustaining above 3020-3040 on closing basis expect 100+ Point move towards 3100+ Range)For educational purpose only)
FlagBreak - Bearish Continuation🔎 Overview
This chart highlights a Bearish Flag structure, a continuation pattern that forms after a strong directional move. It reflects a temporary pause in price before momentum potentially resumes in the same direction .
------------------------------------------------------------
📘 Concept — Bearish Flag
A Bearish Flag forms when price makes a sharp downward move (impulse) followed by a brief upward-sloping consolidation.
This consolidation is corrective in nature and does not indicate a trend reversal.
------------------------------------------------------------
🧭 How to Use
• Validation → Successive candle closes below the lower boundary confirm continuation.
• Devalidation → Candle closes above the upper boundary invalidate the setup.
------------------------------------------------------------
📊 Chart Explanation
1️⃣ Strong Impulsive Move (Flagpole)
The sharp downward move on the left shows aggressive selling pressure and establishes strong directional momentum.
2️⃣ Consolidation Phase (Flag Structure)
After the drop, price moves upward inside a narrow sloping channel, indicating a pause rather than reversal.
3️⃣ Lower Highs and Higher Lows
Price forms a compact structure with lower highs and higher lows, reflecting temporary balance.
4️⃣ Weak Pullback
The rising channel represents a corrective counter-move with reduced momentum, suggesting sellers remain in control.
5️⃣ Continuation Expectation
A decisive close below the lower flag boundary confirms the end of consolidation and continuation of the prior move.
------------------------------------------------------------
📝 Summary
Strong impulse defines direction
Rising flag shows corrective pause
Momentum remains weak during consolidation
Breakdown confirms continuation
------------------------------------------------------------
⚠️ Disclaimer
📘 For educational purposes only.
🙅 Not SEBI registered.
❌ Not a buy/sell recommendation.
🧠 Purely a learning resource.
📊 Not Financial Advice.

Sandur Maganese - Bullish Flag PatternSandur Maganese is into mining sector and is heading for a 70%+ returns on account of following:
1. It is making a bullish flag pattern which is a continuation pattern, on breakout it is heading for a big run.
2. See how during consolidation phase the volumes have dried down and have started gaining again - see last Friday candle, big volume.
3. It is India's 2nd largest Maganese mining Company, with quarterly profits have started again to show great results.
4. It has marque clients like Maruti, Mahindra, etc.
Keep following @Cleaneasycharts as we provide Right Stocks at Right Time at Right Price.
Cheers!!

TVSMOTOR's DOWNTREND OVER? NSE:TVSMOTOR
Price was in a clear downtrend earlier with lower lows. But notice the change in behaviour :
The last big down-leg was not able to break the previous low – sellers lost strength.
From that low, price bounced up with strong volume, showing fresh buying interest.
After that, price has been holding around the same zone for ~15 days, moving in a tight range instead of falling back. This looks like supply getting absorbed near resistance.
NSE:CNXAUTO chart also gave initial breakout from tight range.
Heres the 30 min chart
For me this is a potential range-breakout setup:
Entry: Above the range high around ₹3,505 on a strong candle.
Stop-loss: Below the range low near ₹3,460.
First target: Around ₹3,560.
Extended target: Near the next resistance zone around ₹3,600+ if momentum continues.
Plan is simple – as long as price stays above the breakout level, bias is bullish. A breakdown back inside the range or below ₹3,460 will invalidate the idea.
Study the chart and then act with probabilities.
Keep Learning
Happy Trading.

Nifty 50 Price Structure Analysis [02/12/2025: Tuesday]Top-Down Nifty 50 Price Structure Analysis for 02nd December 2025. The day is Tuesday.
Event : Nifty 50 Weekly Expiry. No other high-impact event.
(1) Monthly Time Frame:
It is the first day of the month. It is an inside candle. Major resistance is at level 26300. Major support is at levels 26150 and 26100. The view is bullish to indecisive. Technically, no scenario to short. Best to avoid trade.
(2) Weekly Time Frame:
It is the first day of the week. It is kind of a red marubozu, but with slight buying from the level 26150. There is a very strong resistance at the level 26300. There is a very strong support at the levels 26150 and 26100. Also, it's an inside week. Highly indecisive scenario. However, the uptrend is still intact. So, taking a short position is also difficult. No bullish trade till 26300 is breached. No bearish trade till 26100 is breached. The view is indecisive.
(3) Daily Time Frame:
Back-2-back 3-day red candle. Also, 3 days of range-bound consolidation. However, the uptrend is still intact. The bullish marubozu made on 26th November is still holding the uptrend. At this level, strong resistances are at levels 26300 and 26250. Strong support levels are at 26150 and 26100. The view is indecisive until higher or lower levels are breached.
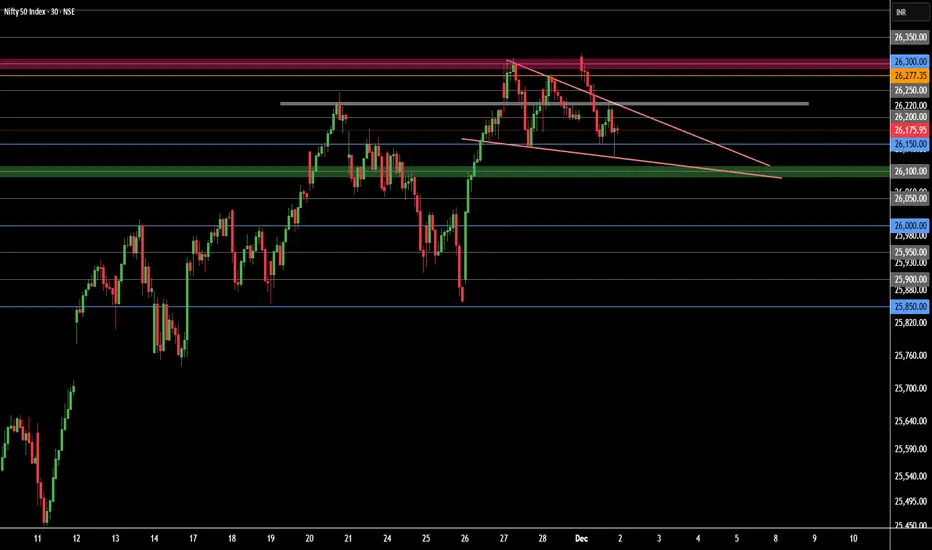
(4) 30-Minute Time Frame:
A perfect zig-zag range-bound consolidation of price in the zone of 26300 to 26150 is evident. There is also a formation of a pole and flag pattern. It is a no-trading zone. Major resistance levels are at 26300 and 26250. Major support levels are 26150 and 26100. The view is indecisive to bearish as it seems the price structure formed a triple top.
No Trading Zone (NTZ): 26300 - 26100.
Bullish Scenario Set-Up:
(i) Price sustains above the opening price.
(ii) Price starts to form a higher highs and lower lows structure above the level 26250.
(iii) Price shows the promise of trading above 26300.
Bearish Scenario Set-Up:
(i) Price sustains below the opening price.
(ii) Price starts to develop lower lows and lower highs below 26150.
(iii) Price decisively breaches the 26100 level.
Strong Resistance Zone: 26300 - 26250.
Strong Support Zone: 26150 - 26100.
Expectations (Hypothesis and insight from the trade plan):
(1) The view is bearish to indecisive. Every upmove should be doubted as sellers will try to expire price below levels 26300 and 26250.
(2) There is a higher chance of breaching the levels 26150 and 26100. But wait till 26100 is decisively breached.
(3) The first sign of bullishness can only be observed when the price sustains above the level 26250. But bullish probability is low. By the end of the day, if the price holds above 26150 - 26100 and tries to sustain above 26200, then there is a higher chance of bullish continuation.
(4) However, if the price breaches 26100 decisively, then there might be a free fall till 26000 at least.
Buy MCX#MCX (Multi Commodity Exchange) Technical Analysis Summary
Current Market Price : ₹8,051.50
Dow Theory Analysis
The chart perfectly demonstrates **Dow Theory principles** in action:
Bullish Structure
Higher Highs : Clear progression from previous peaks
Higher Lows : Each dip maintains above previous lows
Fresh Higher High : Recent peak establishing new uptrend confirmation
Key Technical Levels
Daily Resistance : 8,339.00
Weekly Resistance : 8,901.50
Previous ATH : 9,115.00
Multiple Pattern Confirmations
1. Flag & Pole Pattern : - Bullish continuation pattern Suggests upward momentum continuation
2. Harmonic Pattern :
- Trading near point B
- Activation Level : 8,148.50
- 1st Target : 9,115 (Previous ATH)
- 2nd Target : 9,964 (Current projection)
Do your own analysis before Initiating any Trades.

Strong PSU Bank - Indian Bank - Strong BuyIndian Bank - Swing to Short-Term Investment Report
Current Price: 653.10
TECHNICAL SETUP OVERVIEW
Analysis Type: Monthly Chart | Investment Horizon: Short to Medium Term (6-18 months)
Key Observation: After a historic breakout from multi-year resistance, Indian Bank has established itself as a solid structure for accumulation with exceptional return potential.
BREAKOUT TIMELINE & PATTERN
Historical Resistance Battle (2018): Successfully tested 5 consecutive months.
Major Breakout (January 2024) Clean breakout above 2018 resistance level, Significance 6-year base breakout - high probability setup - Follow-through Strong momentum confirmed.
Bull flag Pattern formation, Price Range: 632-736. Building energy for next leg up
Structural Advantages:
1. Clean Breakout Pattern
- No false breaks or whipsaws
- Volume confirms genuine buying
2. Multiple Timeframe Confluence
- Monthly, weekly, daily all aligned bullish
- No conflicting signals
- High probability continuation
3. Measured Move Projections
- Targets based on historical patterns
- Flag pole height projects to 1,050+
- Conservative targets: 813-973
4. Fundamental Support
- PSU bank re-rating theme intact
- Improving asset quality
- Growing dividends (35% YoY growth)
- Strong Q4 profit growth (+31.56%)
Disclaimer: For educational purposes only. Manage risk appropriately and do your own research.
🎯 Trade Smart. Trade Safe. Accumulate Quality.

Canarabank - Short Term BuySImple Technical Analysis.
Multiple PSU stocks are forming Flag&Pole pattern.
Canarabank - Hovering around Prev ATH.
Pattern BO will lead to 139.
Prev High Breakout will lead the Stock to 139/143/152/169.
Target Levels Based on Pattern target and Fibonocci Levels
