Flag Found in NZDUSDI was eyeing on NZDUSD for Bullish entry above its major support @ 0.5613.
Then I caught a flag pattern which indicates continuation towards 0.5515. This is also confirmed by its near major support at 0.5514.
The price retraced two times from 0.5514 on 9th April 2025 and 3rd Februrary 2025. It enables me to have a proactive selling below the current Lower Low @ 0.5588 which is the pole of our flag.
Our Stop losses positioned at 0.5617, right above the flag clothing.
I am taking two trades each with 1% risk.
If my first trade target hits then I will move the SL of other trade to BE to ride the same direction with great peace of mind. Happy Trading.
Trade No. 1
Entry (Sell Stop): 0.5588
SL: 0.5617
TP: 0.55518
Trade No. 2
Entry (Sell Stop): 0.5588
SL: 0.5617
TP: 0.55155
Flag

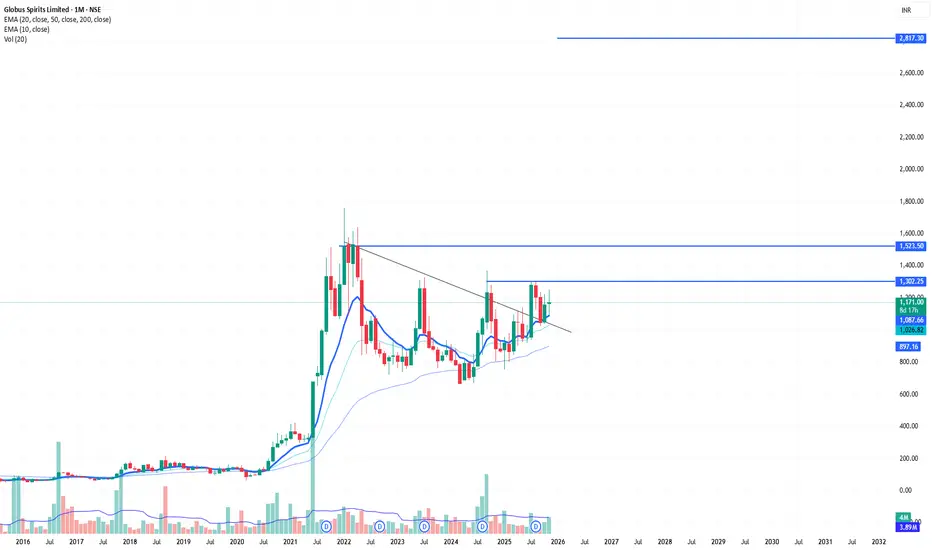
Contraction in Monthly Time FrameThis is the monthly chart and analysis of Global Spirits.
Global Spirits has formed classic flag and Pole pattern and now trading comfortable on 10ema. It has taken three times resistance from 1300+ Price zone and now made a perfect 3T pattern.
The stock has made same structure in the DTF also.
The stock made same structure during 2018 to 2020 and rallied 5 times from there,
Disclaimer- Do your analysis before entering any stock. You are responsible for your own profits and losses.
Always go in with a SL.
EURJPY: MEDIUM TERM BULLISH Hello everyone,
Let's talk about EURJPY upcoming predictions.
My pure Price action analysis is laying foundation for me to go Bullish.
With not much lift in my trading account, i am taking more risk by trading this pair with H1 Time frame aiming the Flag Target made by H4 Timeframe.
Currently, it crossed the flag's pole which was our confirmation point. Although I already got entered after the price touched the hourly trendline and then breakout above Resistance Level.
Please note that I am also keeping my equity safe and sound by early exit.
I am taking two trades each with 1% risk. Though the final target is 182.60 .
If my first trade target hits then I will move the SL of other trade to BE to ride the same direction with great peace of mind. Happy Trading.
Trade No. 1
Entry: 179.93
SL: 178.97
TP: 181.13000
Trade No. 2
Entry: 179.93
SL: 178.97
TP: 182.33000

BEL (W): Primed for ATH BreakoutBased on Weekly Timeframe, Logarithmic Scale
This is a classic "coiling spring" setup. The stock is in a tight, bullish consolidation right below its all-time high. A powerful combination of fundamental catalysts, bullish high-timeframe indicators, and classic volume contraction suggests a breakout is highly probable.
🚀 1. The Fundamental Catalysts (The "Why")
This bullish technical pattern is fully supported by a torrent of positive fundamental news, providing a strong "tailwind" for the stock:
- Strong Q2 Earnings: On Oct 31, BEL reported a 26% rise in revenue and an 18% rise in net profit for Q2 2026, beating estimates.
- Massive Order Inflow: The company is announcing new, large-scale orders almost weekly, including ₹792 crore (Nov 10) and ₹871 crore (Nov 14). This provides high visibility for future earnings.
📈 2. The Dominant Pattern: Bullish Consolidation
- The "Flagpole": The stock made a strong move up to its All-Time High (ATH) in June 2025.
- The "Flag": Since then, it has been in a sideways consolidation phase , trading in a tight range just ~2% below its ATH.
- Drying Volume: Volume has been drying up during this consolidation. This is a classic, powerful sign that sellers are exhausted ("supply has dried up") and the stock is being accumulated.
- Recent "Ignition": Last week's +3.04% surge on 73.21M in volume was a significant "ignition" signal, showing that buyers are starting to re-emerge and test the resistance.
📊 3. Confluence of Bullish Indicators
The "trifecta" of bullishness on high timeframes is exceptionally strong:
- RSI: The Relative Strength Index is rising on both the Monthly and Weekly charts, showing that long-term momentum is firmly on the side of the buyers.
- EMAs: The short-term Exponential Moving Averages are in a "PCO" (Price Crossover) state on both the Monthly and Weekly charts, confirming the long-term trend is up.
🎯 4. Future Scenarios & Key Levels to Watch
The price action next week is critical.
🐂 The Bullish Case (Breakout)
- Trigger: A decisive, high-volume weekly close above the ATH resistance (₹436).
- Confirmation: This would confirm the end of the 5-month consolidation and the start of a new leg up into "price discovery."
- Target: The next logical technical price target is around ₹530 .
🐻 The Bearish Case (Breakdown)
- Trigger: If the stock fails to break out and momentum is lost (e.g., due to a broader market pullback).
- Confirmation: The stock would need to break below.
- Target: A failure would see the stock fall to retest its immediate support level at ₹400 .
Conclusion
A "wait and watch" approach is ideal, but the evidence is heavily skewed to the upside. The combination of a perfect technical pattern (high tight flag), bullish high-timeframe indicators, and a powerful fundamental story (earnings + new orders) makes this a textbook setup for an ATH breakout.
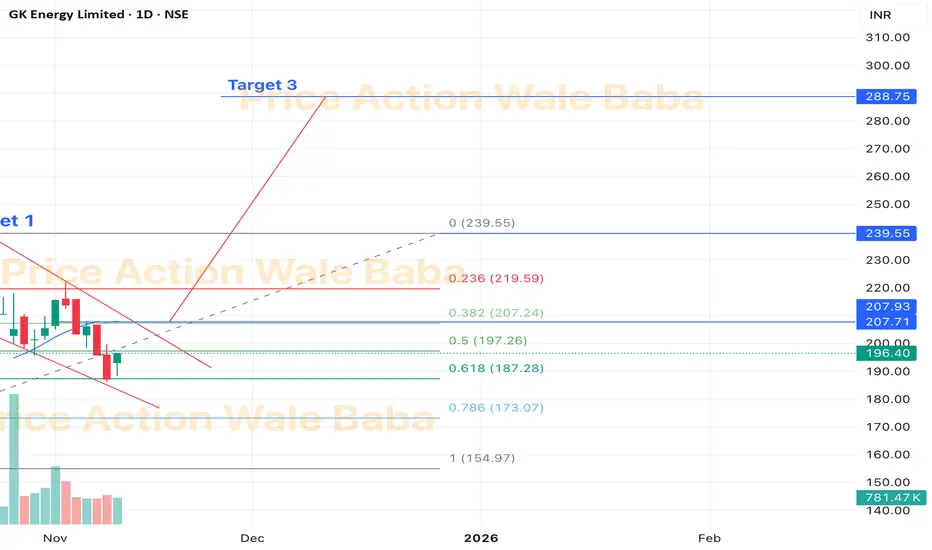
GK EnergyGK Energy have long scale Poll and Flag Pattern.
As per Fibo, it has 61.80% correction from the previous wale low and high made in that wave, which is All Time High.
So, as per technical analysis, If this stock sustain above 210,
Targets would be 219-239.
So, now here 239.60 is ATH, so what it can do? So, if sustain above 240, we will see 288 which is almost 60% upside from this wave.
Accumulate on every small dip and wait for the target.
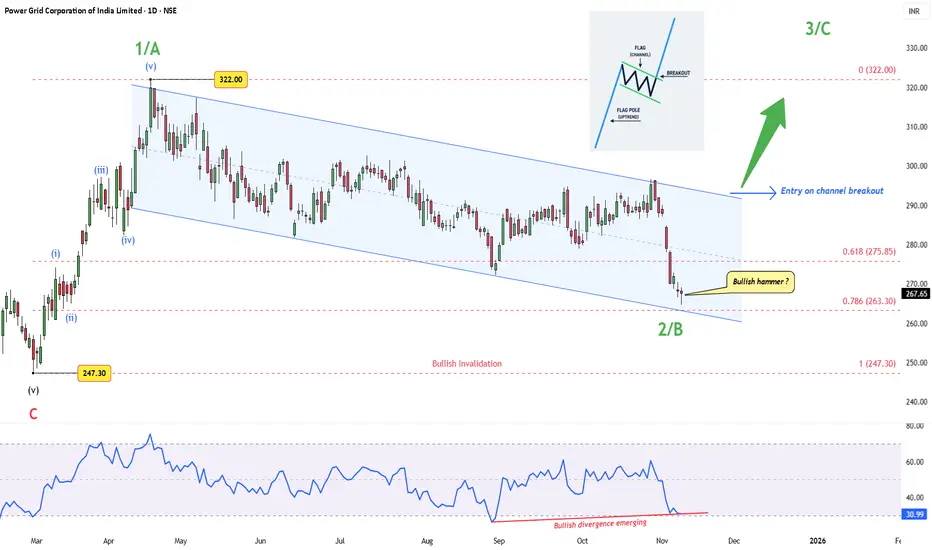
Power Grid – A Flag Within a WaveAfter completing a clean five-wave rally from ₹247.30 to ₹322, Power Grid has spent months in a controlled drift lower — a textbook corrective channel, likely forming Wave 2/B of the next major leg.
Price now sits near the 0.786 retracement (₹263 zone), showing early signs of exhaustion. A “ Bullish hammer? ” candle has appeared — not textbook-perfect, but hinting that buyers are starting to show up near prior demand.
The RSI divergence adds another layer — price made new lows, RSI didn’t. That’s often how momentum bottoms quietly form before a sharp reversal.
Still, price hasn’t kissed the lower boundary of the channel, which has already acted as support thrice. So, another quick dip can’t be ruled out before a stronger move unfolds.
A breakout above the upper channel would confirm the end of this correction and signal the start of Wave 3/C, with ₹322 as the first key level to reclaim.
Until then, patience is key — the structure remains healthy, the confluence is strong, and the risk is clearly defined.
Structure summary:
Wave 1/A : ₹247.30 → ₹322
Wave 2/B : Descending flag-type correction
Key fibs : 0.618 = ₹275.85, 0.786 = ₹263.30
RSI : Bullish divergence emerging
Trigger : Breakout above channel
Invalidation : Below ₹247
Disclaimer: This analysis is for educational purposes only and does not constitute investment advice. Please do your own research (DYOR) before making any trading decisions.
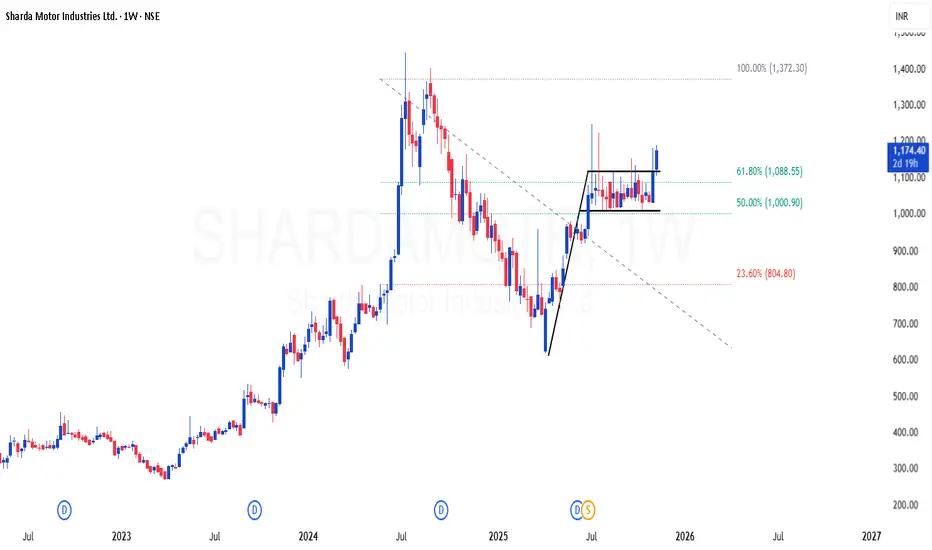
SHARDAMOTR | Nice flag breakout in weekly time frameSHARDAMOTR | Nice flag breakout in weekly time frame
CMP : 1170 (Dip : 1000)
SL : 900
Target : 1800 (based on fib)

Sobha- A breakout of consolidation is on cardsRealty sector has been performing well post Q2 results announcements.
Sobha has posted stellar Q2 numbers but it might be one off quarter as well.
Technically, stock is looking ripe for a good flag breakout of consolidation.
We might soon see a breakout coming but sustainment of breakout is crucial for further upmove.
Levels are mentioned on chart. We can see upside of more than 50% if breakout sustains.
You can also check other realty sector stocks and see if any similar pattern is visible.
Please note that I am just NISM certified RA and not SEBI registered.
This analysis is not a recommendation but has been shared for educational purposes only.

Indraprastha Medical Ltd | Bullish Flag Breakout | Swing SetupCompany Overview (Fundamental)
Indraprastha Medical Corporation Ltd (IMCL) operates under the Apollo Hospitals Group and manages the Indraprastha Apollo Hospital, New Delhi — one of India’s largest multi-specialty hospitals. Company financially strong, consistent profitability, improving margins, and low debt.
Fundamentally stable company with consistent earnings and a defensive sector (Healthcare).
Strong base for technical breakout follow-through.
💰 Market Cap: ~₹5,400 Cr
📈 Revenue Growth (YoY): +16% (Strong Growth)
💸 Net Profit Margin: ~10–12% (steady)
💵 Debt-to-Equity: 0.05 (virtually debt-free)
📊 ROE (Return on Equity): ~20%
Technical Overview
The setup represents a bullish continuation phase, with EMAs stacked positively and volume confirming accumulation.
Price trades above all 3 key EMAs (9, 20, 50) — strong bullish alignment.
Formation of a textbook Bullish Flag Pattern after a sharp pole rally from ₹460 to ₹610.
Recent candle closed bullish with +3.4% gain and high volume (2.48M) — indicating renewed buying interest.
RSI ~60 → Momentum healthy and not overbought.
MACD positive crossover developing, confirming bullish trend strength.
Price Action Analysis
Clean, bullish, momentum-driven move with volume confirmation.
Buy on dip near breakout retest at ₹580-583
Book Partial profit at ₹625–630
target 2: ₹655–660 this will be Flag breakout projection.
A perfect risk to reward ratio following.
Disclaimer
This analysis is for educational and research purposes only — not investment advice.
Always do your own due diligence and manage risk before trading.

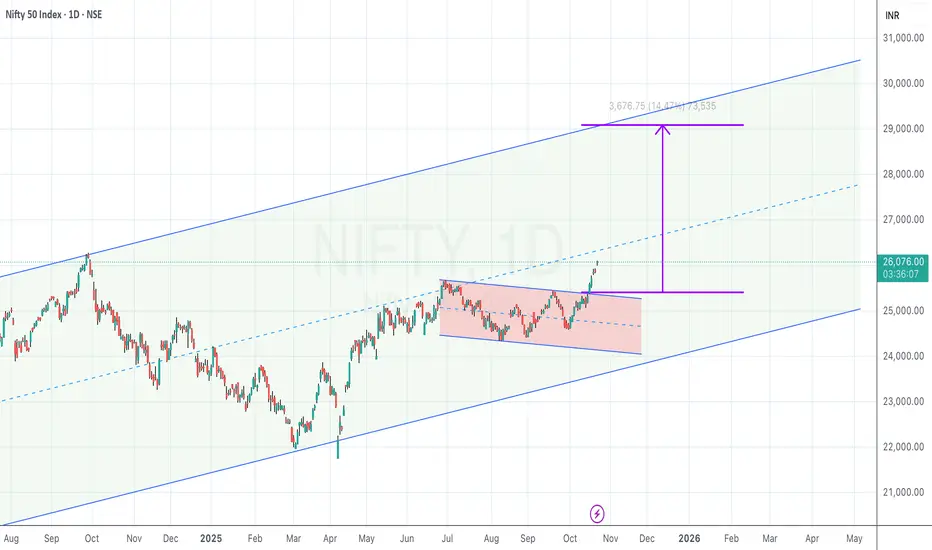
Flag breakout inside a long-term rising channel
NIFTY spent the last few months in a falling/sideways range (highlighted box) within a larger rising channel.
Price has broken out on the upside and is pushing above the box top / local supply.
A classic measured-move from the height of the box projects ~3,650–3,700 pts higher, aligning with the upper channel—pointing to ~29,400–29,600.
Why it works
Structure alignment : Local flag breakout with the primary up-channel.
Confluence : Measured move ≈ upper channel touch, giving a logical exhaustion zone for profit-taking.
What can go wrong
False breakout : Quick rejection and close back under 25,700.
Macro/event risk : Gap moves around data/events can bypass stops—position accordingly.
Bias: Bullish while above 25,700 on daily closes.
This is a technical study for educational purposes, not investment advice. Manage risk.
SchaefflerInd - Technical Analysis#Schaeffler India - Technical Analysis Report
Current Price: 4,141.10 / Prev ATH @4951.
Trade Setup Overview
Basic Dow Theory : Stock is making Higher High - Higher Low by Breaking previous ATH decisively and stock is down to strong Demand Zone for retracement.
Stock is in consolidation before breaking previous ATH & currently forming Flag & Pole Pattern.
Entry on breakout above resistance 4,200-4,300
Conservative Stop Loss at 3,800 | Tight SL near 4,000
Tgt 1: 4,602
Tgt 2: 4,776
Tgt 3: 5,026
Grand Flag & Pole Target: 5,495.
Technical Highlights:
- Trend Reversal confirmed by breaking previous High on May 2025 around 2,800
- Price consolidating after strong recovery rally
- Trading above key moving averages
- Breakout above 4,300 resistance could trigger momentum toward 4,600 / 5495
Risk-Reward:
Favorable R:R with potential 11-33% upside vs 3-8% downside to stop loss levels.

VCP Move on Gilead SciencesGot a second chance of getting into the trade on Gilead.
Taken it based on VCP move after studying the scenario.

BAJAJFINANCE F&P BREAKOUTBajajfinance breaking flag&pole pattern
good volume building up last few days
rsi above 60, trading at ATH
SL 970 ,Target 1130 on pivot level
NO BUY/SELL RECOMENDATION

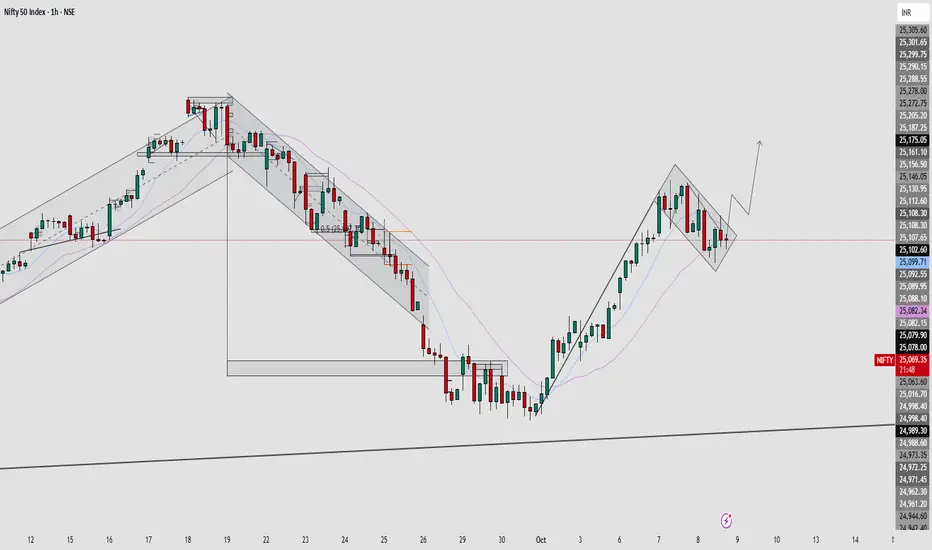
Nifty 50 Index – Bullish Pole & Flag Breakout Setup(5-min-15min)The Nifty 50 index on the 5-minute and 15-minute timeframe is showing a bullish pole and flag continuation pattern. After a strong upward rally (the pole), the price has entered a downward-sloping consolidation channel (the flag), indicating healthy profit booking. The pattern suggests potential for a breakout on the upside, resuming the prior bullish trend.
Key levels to watch:
Support: 24,824 – 24,883 zone (green lines)
Resistance: 25,222 and 25,359 (red lines)
Breakout Target Zone: Above 25,400 if price sustains above the flag channel resistance.
The volume profile also indicates strong accumulation near 25,000, further strengthening the bullish bias.

Yatharth HospitalFlag breakout with 3 rejections on hourly chart. Took an entry at 820 post-confirmation with strong volume support with SL near 790.

NIFTY 50 – Bullish Flag Formation | Continuation Pattern in PlayNIFTY 50 is currently forming a bullish flag pattern on the lower timeframe after a strong impulsive move to the upside.
This consolidation phase represents a healthy correction within an uptrend , indicating that bulls are likely preparing for the next breakout leg .
The structure is showing a clear flag channel , where price is respecting parallel trendlines after the strong upward impulse.
Volume is also contracting during the pullback — a typical characteristic of a flag pattern.
Key Highlights:
🚀 Strong impulsive move followed by tight consolidation (flag).
📉 Flag resistance zone: 25,130 – 25,170
📈 Breakout above this zone could trigger bullish continuation toward 25,300 – 25,400.
⚠️ Invalid if price breaks below 25,050 with strong momentum.
Trading Idea:
Wait for a clean breakout candle above the flag resistance with volume confirmation for potential long entries.
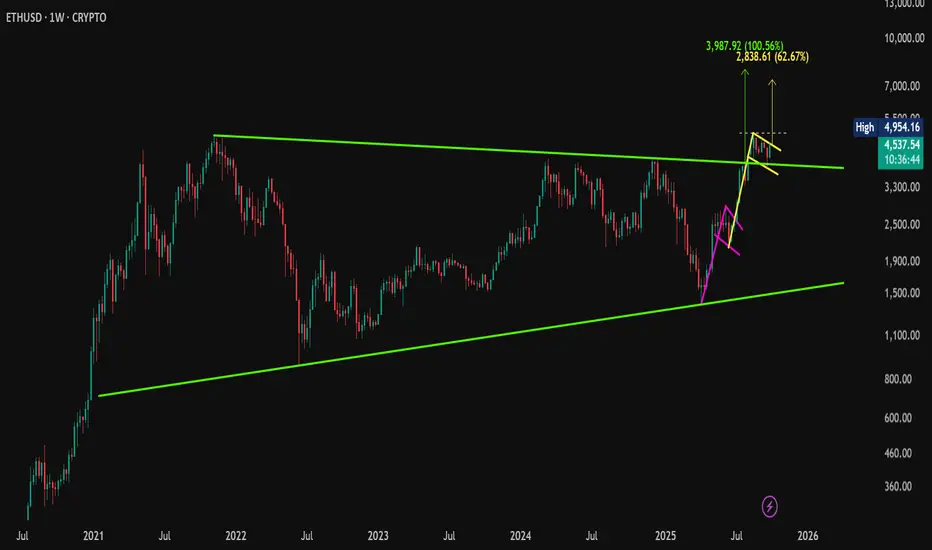
ETH Triangle Breakout + Bull Flag Setup – Is $8K Next?CMP: $4,540
Ethereum has broken out of a long-term symmetrical triangle , retested the trendline, and is now moving higher — signaling strong bullish momentum.
🔹 Breakout Retest Done – ETH completed a clean breakout and retest of the triangle resistance.
🔹 Bull Flags – Two bullish continuation flags have formed. The second flag is on the verge of breaking out , hinting at another potential leg up.
🔹 Pattern Targets –
• Bull Flag target: $7,365 +, if breakout confirms.
• Symmetrical Triangle target: $7,950 , which is over 62% above current price.
🟢 Key Level to Watch: A weekly close above $4,954.16 (previous ATH) would further validate the bullish structure.
#ETH | #Ethereum | #Crypto | #Breakout | #ChartPatterns | #SymmetricalTriangle | #BullFlag | #PriceAction
📌 Disclaimer: This analysis is shared for educational purposes only. It is not a buy/sell recommendation. Please do your own research before making any trading decisions.
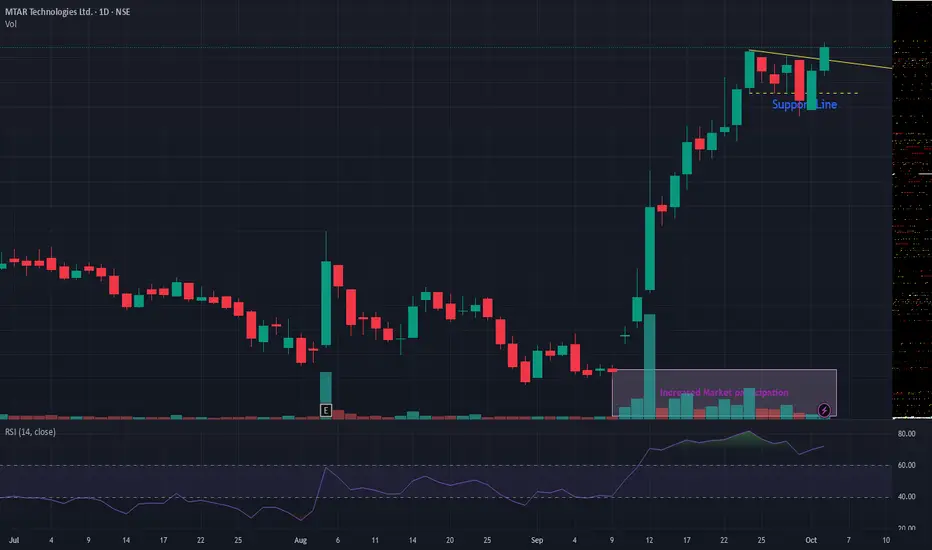
MTARTECHMTARTECH giving trend-line breakout. VCP breakout also observed. Volume too has spiked. As long as it is above support line, the stock seems attractive. Many defense stocks are showing strength and trying to give a run! Keep in your watchlist
JSWENERGY Quarterly Breakout#jswenergy Strong Breakout and Sustaining strongly on Quarterly Chart.
Good to Hold for Swing, Short and Long-term #Investment.
Strong on Technical's.
Charts never Disappoint me !

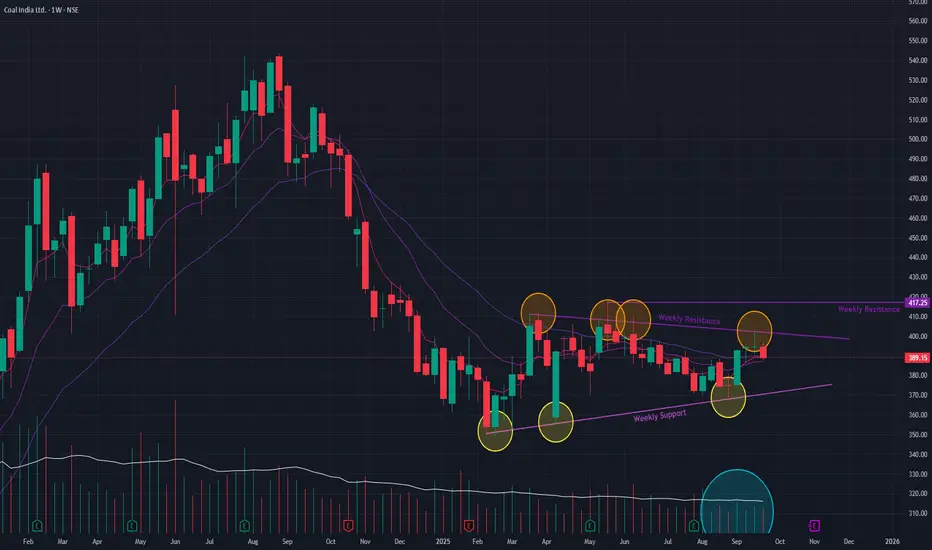
Coal India (W) - Consolidates in a Potential Bear Flag PatternFollowing a significant downtrend that began in August 2024, Coal India has entered a sideways consolidation phase, which has been in place since December 2024. This prolonged period of consolidation after a downtrend is forming what appears to be a Bear Flag , a classic continuation pattern that typically resolves to the downside.
The stock is currently trading within this pattern, approaching a critical juncture.
Bearish Indicators to Note 📉
The negative outlook is supported by key observations:
- Continuation Pattern: The formation of a Bear Flag itself suggests that the pause is likely a prelude to resuming the prior downtrend.
- Declining Volume: Trading volume has been noticeably drying up during this consolidation phase, which often indicates a lack of buying conviction and can precede a breakdown.
Outlook and Key Levels
The price action in the coming weeks will be crucial.
- Bearish Case: A breakdown below the lower trendline of the flag pattern, especially on a spike in volume, would confirm the continuation of the downtrend.
- Bullish Reversal: To invalidate the bearish pattern, the stock must stage a decisive breakout above the upper resistance trendline of the flag, supported by a massive surge in volume. Until such a breakout occurs, the prevailing technical bias remains bearish.
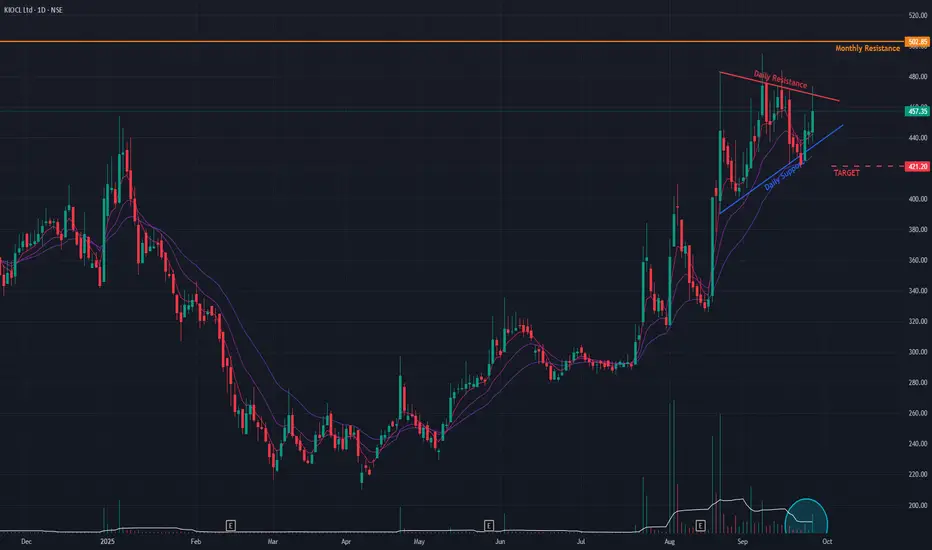
KIOCL (D) - Consolidates in Bullish Pattern After Massive RallyFollowing a powerful uptrend that has seen the stock gain over 125% since its bullish reversal in April 2025, KIOCL is now consolidating in a bullish Flag & Pole pattern . This chart formation is typically a continuation pattern, suggesting that the prior uptrend is likely to resume after this brief pause.
The stock is currently trading within the "flag" portion of the pattern. A breakout from this consolidation is the key trigger for the next potential move.
Broad-Based Bullish Indicators 👍
The underlying trend remains strong, supported by a host of positive technical signals:
- Multi-Timeframe Strength: Short-term Exponential Moving Averages (EMAs) are in a bullish state across the monthly, weekly, and daily charts .
- Confirmed Momentum: The Relative Strength Index (RSI) also confirms a bullish state on the monthly and weekly timeframes. While the daily RSI has not yet completed a bullish crossover, it is positioned to do so.
- Volume Buildup: A noticeable increase in trading volume during recent sessions suggests accumulation is taking place within the pattern.
Hurdles and Key Levels
For the uptrend to continue, the stock must first break out above the upper trendline of the flag pattern . Immediately following a potential breakout, it will face another significant hurdle in the form of a long-term horizontal resistance trendline .
- Bullish Case 📈: If the stock successfully breaks out of the flag pattern and sustains its momentum, the next potential price target is the resistance zone near ₹620 .
- Bearish Case 📉: If the pattern fails and momentum is not sustained, the stock could pull back to find support near the ₹420 level. The price action in the coming days will be critical.
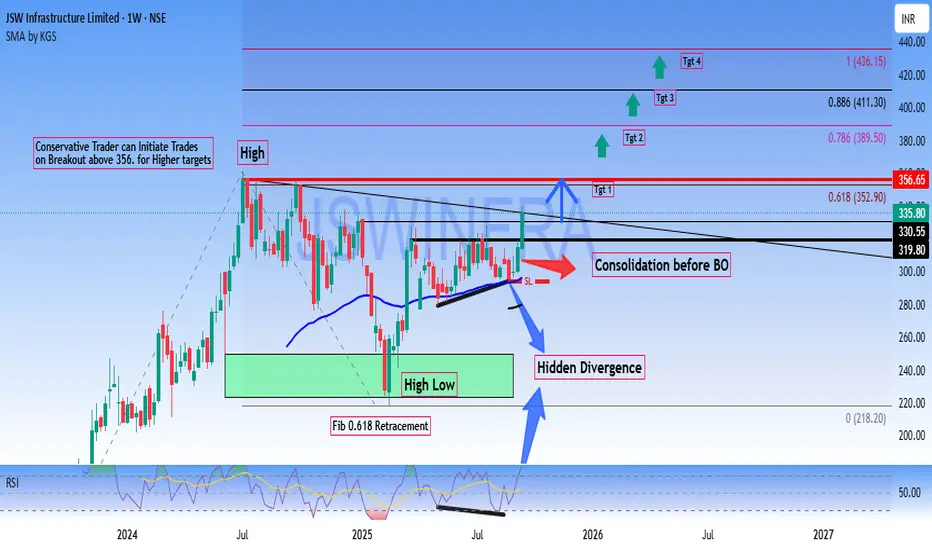
Long JSWINFRA - Short term Investment# JSW Infrastructure Limited (NSE) - Technical Analysis Report
Current Price: 335.80
Key Technical Observations
**Bullish Breakout Setup**
- Breakout Level: Above 356 for conservative trade
Consolidation phase completing before potential breakout (BO) & Stock trading near resistance zone.
Price Targets
- Target 1: 352.90 (0.618 Fibonacci level)
- Target 2: 389.50 (0.786 Fibonacci level)
- Target 3: 411.30 (0.886 Fibonacci level)
- Target 4: 436.15 (1.0 Fibonacci extension)
- Moving Average: SMA showing upward momentum at 296.13
- Fibonacci Retracement : 61.8% level acting as immediate resistance
Chart Pattern Analysis
- Hidden Divergence on the chart suggesting underlying strength
- Consolidation Phase after pullback from 0.618 fib levels and Recent sideways movement indicating accumulation
Risk Management
- Support Level of the recent consolidation low around 280-300 zone
- Stop Loss: Conservative traders should consider stops below 320 on candle close basis.
Conservative Traders:
- Wait for decisive breakout above ₹356 with volume confirmation
- Enter on pullback to ₹340-345 range after breakout
- Target progressive profit booking at mentioned Fibonacci levels
Disclaimer: This analysis is for educational purposes only. Please conduct your own research and risk management before making investment decisions.