Titan: Breakout Awaited ?Titan is up by almost 4% right now, and a flag pattern is quite visible. Probability of a breakout might be there provided it breaches the hurdle successfully with volume.
7% upside could be seen after the breach.
Note: Just an observation
Flagpatternsignal

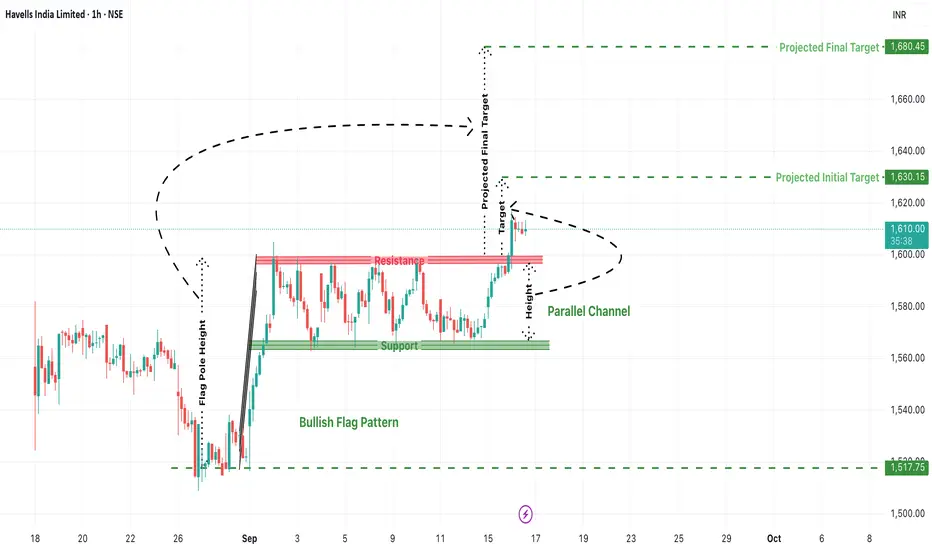
Havells Bullish Flag Breakout: Can We See a Rally to 1680+?Havells India Ltd. is currently showing a classic bullish technical setup—a Bullish Flag Pattern—that could lead to a potential breakout and strong upside movement in the short term. Traders who favor breakout-based strategies should pay close attention to this chart, especially considering the structured parallel channel and previous rally that preceded it.
1. Bullish Flag Pattern: Anatomy of the Setup
A bull flag is a continuation pattern that occurs after a sharp price rise (flagpole), followed by a period of consolidation within a narrow parallel channel (the flag). This structure typically suggests that the bullish trend will resume once the price breaks out of the flag range.
In Havells:
Flag Pole: The stock surged sharply from the 1517 zone to near 1610, forming a vertical rise.
Flag/Channel: Price moved sideways within a narrow support at ~1570 and resistance at ~1610, creating a clean parallel channel.
This shows price compression after a strong move, typically a sign of healthy consolidation before another leg up.
2. Breakout Levels and Price Action Confirmation
As per the current chart:
Havells has broken above the resistance zone around 1610, signaling a potential breakout.
The breakout candle is attempting to close above the red resistance band, and follow-up candles will be crucial to confirm strength.
A retest of this breakout zone could offer ideal long entries.
3. Projected Targets from the Pattern
Using the flagpole height, we can project upside targets from the breakout point:
Initial Target: ₹1630.15
A conservative target based on minor resistance and pole extension.
Final Projected Target: ₹1680.45
This marks the full measured move and could be achieved if the rally sustains momentum.
4. Ideal Trading Plan (For Traders)
Entry:
After confirmed breakout above ₹1610
Or on retest near ₹1600–1610 zone with bullish price action.
Stop Loss:
Below the flag support zone at around ₹1570
Aggressive traders can keep it below ₹1585.
Targets:
T1: ₹1630
T2: ₹1680+
Risk-Reward Ratio:
Minimum 1:2 depending on entry price.
5. Risk Scenarios to Watch For
False Breakouts: If the breakout doesn’t sustain and price falls back into the channel, it may trap early longs.
Macro Events: Broader market volatility (Nifty moves or global cues) can impact momentum.
Volume: Lack of volume on breakout candles can reduce conviction—always monitor volume to confirm strength.
Conclusion: Havells Looks Set for a Fresh Rally
This is a textbook bullish flag breakout in formation, with clear upside potential. If the momentum sustains, Havells could very well reach 1680+ in the coming sessions. However, traders must practice disciplined risk management, wait for confirmation, and avoid chasing without a proper plan.
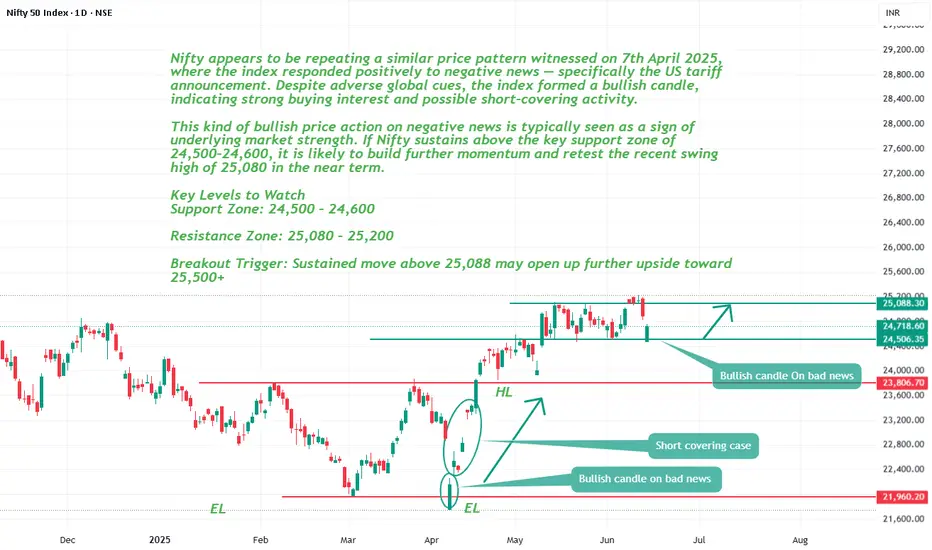
Nifty appears to be repeating price pattern of 7th April.Nifty appears to be repeating a similar price pattern witnessed on 7th April 2025, where the index responded positively to negative news — specifically the US tariff announcement. Despite adverse global cues, the index formed a bullish candle, indicating strong buying interest and possible short-covering activity.
This kind of bullish price action on negative news is typically seen as a sign of underlying market strength. If Nifty sustains above the key support zone of 24,500–24,600, it is likely to build further momentum and retest the recent swing high of 25,080 in the near term.
Key Levels to Watch
Support Zone: 24,500 – 24,600
Resistance Zone: 25,080 – 25,200
Breakout Trigger: Sustained move above 25,088 may open up further upside toward 25,500+
Infosys ready for Flag pattern breakout in coming daysNSE:INFY Ready for flag pattern breakout in coming days
Consolidated pattern since many days now ready for breakout in coming days
Follow for more trading signals or analysis.
Target 10% approx
Stoploss 3%
Do as directed in the chart
This is not the trading recommendation or advise 🚨
Do your analysis before taking any step.

Long term trading opportunity in Suratwala for huge upsideHi,
NSE:SBGLP has given a Bullish Flag Breakout on Weekly charts with very good volume.
MACD is also on the bullish side on Weekly time frames. RSI is also on the bullish side on daily, weekly and monthly time frames.
In the current market scenario, I am expecting that the bullish momentum will continue.
Complete price projection like entry, stop loss and targets mentioned on the charts for educational purpose.
Don't Forget to Follow me to get all the updates.
Please share your feedback or any queries on the study.
Disclaimer: Please consult your financial advisor before making any investment decision.

Tata Motors - Follow Up Flag PatternTata motors has created a good flag pattern, the height of the pole is 500 points,
Today - 25th July it has given a breakout from the pattern.
Tata motors will hit 1500++ levels due to Flag pattern breakout out.

NATCOPHARM - FLAG AND POLE FORMATION IN PROGRESSHi All,
This idea is extension of existing idea on Natco Pharma which formed Cup and Handle
Interestingly the price action has formed a FLAG AND POLE formation with price action getting tighter & tighter with shrinking volume.
Flag Breakout may happen anytime soon & till then investor is advised to be patient.
Results are also expected & so market might be waiting for some earnings surprise
Thanks,
Stock-n-Shine

INOXGREEN - 6 Months Consolidation Breakout / All Time HighInox Green Energy Services Ltd
1) Time Frame - Weekly.
2) The Stock has been Consolidating since (January, 2024). Now It has given a Consolidation breakout & Closed at it's Life Time High with good volume & good bullish momentum candle in weekly Time Frame.
3) The stock may find it's next resistance around the price (210 - 22.90% from the price 170.82).
4) Recommendation - Strong Buy.

Adani Power- In consolidation to gain powerAdani power- Already C&H breakout target in monthly timeframe is 733. Now the flag formation in 4 hours timeframe confirms the same target as can be seen in the chart.

Investment Gem: (Adani Enterprise) Set to Soar 20-25%!ADANI ENTERPRISE:
Swing Targets: 3900/400
Long Term: 6000
Company Background and Work:
- Founded by Gautam Adani in 1988, Adani Enterprises Limited is a conglomerate within the Adani Group.
- Core sectors: Energy, infrastructure, logistics, agribusiness, real estate, financial services, and defense.
- Evolution into a leading player in India's business landscape.
- Core businesses: Trading, coal mining, renewable energy generation, agribusiness, and logistics.
- Trading: Started with agricultural commodities, diversified into coal, oil, gas, edible oils, and metals.
- Global presence with trading offices in key markets.
- Coal Mining: Among India's largest coal mining companies, meeting energy demands for various industries.
- Renewable Energy: Active investment in solar and wind power projects, contributing to clean energy transition.
- Agribusiness: Strong presence in sourcing, processing, and trading of agricultural commodities.
- Operations include grain silos, storage facilities, and processing plants.
- Logistics: Operates ports, terminals, and transportation services facilitating trade domestically and internationally.
- Adani Ports and Special Economic Zone Limited (APSEZ) is a major subsidiary.
- Other Businesses: Real estate development, financial services, and defense manufacturing.
- Diversified business interests strategically leveraged for growth and profitability.
- Contribution to India's economic development, infrastructure, and energy security.
- Commitment to innovation and sustainability in shaping India's future economy.
--------------------------Fundamental Analysis
- Shareholding: Promoters' holdings 72.61% as of December 2023.
- Financial Performance: The company has sustained profitability over the last 2-3 quarters, with earnings averaging between 136977 crores per quarter.
--------------------------Technical Analysis
- Ready to Break .618 Fib level.
- Bullish Flag pattern.
Above 50 Moving Average.
Imp. Note: This analysis is provided for informational purposes only and does not constitute a direct recommendation to buy or sell stocks. Investors should conduct their own research and consult with financial advisors before making any investment decisions, as market conditions and individual circumstances may vary.
Market Risk: However, it's important to acknowledge the inherent risks associated with investing in the stock market, including but not limited to volatility, economic downturns, regulatory changes, and unforeseen events that can impact stock prices. It's crucial for investors to remain vigilant and diversify their portfolios to mitigate potential losses.

3i Infotech- BULLISH(Daily) BULLISH(Weekly) BULLISH(Monthly)3i Infotech- Inside the monthly cup and handle pattern, a weekly cup and handle formed and broke out. After that Flag pattern formed in daily and brokeout today for the target of 50, 60, 70, 120 and 220 finally in a longer term.
Note: This is for educational purpose only.

Zen Technologies- Flag pattern and Cup and handleZen Technologies- On the verge of flag pattern breakout to complete the cup and handle pattern.. Once both the flag pattern and 790 broken it will be easy target to achieve 900 in short term. The long term target is 1500.
Note: This is for educational purpose only.

Daily Bullish Flag pattern BO in MRPLIntroduction:
Mangalore Refinery and Petrochemicals Limited (MRPL) is a Category 1 Miniratna Central Public Sector Enterprise (CPSE) under the Ministry of Petroleum & Natural Gas. MRPL is located in beautiful hilly terrain, north of Mangaluru city, in Dakshina Kannada District of Karnataka State (India). The 15.0MMTPA (Million Metric Ton per annum) Refinery has got a versatile design with complex secondary processing units and high flexibility to process Crudes of various APIs, delivering a variety of quality products.
MRPL's Refinery is capable of producing almost a full range of petroleum products like Naphtha, LPG, Motor Spirit, High-Speed Diesel, Kerosene, Aviation Turbine Fuel, Sulphur, Xylene, Bitumen along with Pet Coke and Polypropylene.
MRPL's 440 KTA Novolen gas-phase Polypropylene Plant using Zeigler Natta catalyst is capable of producing the complete range of homopolymer grades.
MRPL operates an Aromatic Complex, a petrochemical unit capable of producing 0.905 MMTPA of Para Xylene and 0.273 MMTPA of Benzene. This Aromatic Complex is situated in the Mangalore Special Economic Zone (MSEZ) and is fully integrated with MRPL.
MRPL has Two Captive Jetties in NMPT, Single Point Mooring Facility, While Oil Loading Facility, Rail Wagon Loading Silo for Petcoke, and Truck Loading Silos for Petcoke. MRPL is having Marketing Infrastructure Depots in Kasargod (Kerala), Hindupur (AP), and Hosur (TN).
Shell MRPL Aviation Fuels and Services Limited (SMA) is a 50:50 joint venture between MRPL and Shell Gas B.V. (Shell), a step-down subsidiary of Royal Dutch Shell Plc, Netherlands markets aviation turbine fuel (ATF) to airlines, both domestic as well as international carriers. SMA currently procures ATF from MRPL Refinery Complex and supplies at various airports like Bengaluru, Goa, Mangalore, Hyderabad, Chennai, Calicut, Madurai, Trichy, Coimbatore, Kannur, etc. SMA enables Indian carriers to fuelling requirements across International Airports.
Analysis
A Bullish Flag and Pole pattern is visible on the Daily chart of NSE:MRPL .The Flag and Pole pattern is a bullish continuation pattern and it is visible in charts after a meaningful appreciation in the price.
MACD gave Positive crossover on Weekly and Monthly chart. So, expecting the momentum to continue.
One can create a fresh position in the scrip near Rs. 115-118 levels with the stoploss of Rs. 109 on Daily closing basis for the following targets 121.15, 125.25, 129.05, 136.15 and 141.85.
Risk Disclaimer:
The trading ideas and analyses presented here are for educational purposes only and do not constitute financial advice. Trading and investing in financial markets involve risk. You should carefully consider your own financial situation, risk tolerance, and investment objectives before making any investment decisions.
The information provided in this analysis is based on my personal interpretation of market conditions and the available data at the time of writing. It is subject to change without notice, and I cannot guarantee the accuracy, completeness, or timeliness of the information provided.
Trading and investing carry the risk of substantial losses, and past performance is not indicative of future results. Always be aware that markets can be unpredictable, and prices may move against your trade or investment.
It is advisable to seek advice from a qualified financial professional and to conduct your own research before making any investment decisions. You should only invest funds that you can afford to lose.
I am not responsible for any trades or investments made based on the information presented in this analysis. By reading and using this information, you acknowledge and accept that you are solely responsible for any losses you may incur.

APARINDS: Flag and BB Squeeze APARINDS is readying for a huge flag breakout from horizontal channel. Bollinger Band Squeeze is primed for a explosive breakout.

NTPC Looks BullishNTPC Has created a flag pattern and Gave a retest which shows bullish movement. Keep Watching it.

BTC in Bearish Parallel Chanel PatternBITCOIN 4-hr Chart Analysis
CRYPTOCAP:BTC at present moving as per Descending Channel's in Parallel Pattern with more Bearish mode, and soon be ready to break out Last Lower-High strong support of $28,300 to moving towards FWB:27K to next step of Lower-Low trends in Bitcoin Market.
This time, very big chances to break down approx. 7% to 10% soon.
Let's wait, what's the next move of market but as per my opinion, soon it will be in bearish zone.
anyway, always #DYOR and Trade wisely by using #StopLoss, It's just #NFA
&
Must Share, LIKE & COMMENTS on it....

Nifty levels for 19th JulyGood Morning Traders, Yesterday was a good day for everyone i think right, except Hero Zero Trade of Fin NIfty, am i right? Because we had got momentum for both side. Okay now let's focus on today's scenario.
Nifty is going to form a bullish flag pattern i think. Just assuming but we will trade according to price action. If there will be bullish flag pattern we will wait for breakout to enter for grabbing momentum. Global scenario is looking mixed till now, American market have given best intraday closing yesterday. Asian market struggling as Hang Seng already down 1.39% till now. So let's see how our market is going to behave. I have already market all the levels on chart, but still i will write here too.
Nifty Important levels for today:-
Buy Nifty above 19806, if levels got sustained at least for 15 mints.
Targets we can see in upside 19875/19950+ ( New All time high ).
keep Stop loss at 19699
Sale Nifty below 19699, if levels got sustained at least for 15 mints.
Targets we can see in downside 19615/19564
Keep Stop loss at 19806
Note:- Avoid trade in No trading zone as if you are a option buyer then you will lose money. And Always wait for the best entry or levels to execute trades. And always follow strict stop loss to save your capital from unexpected market direction.
Disclaimer:- Please always do your own analysis or consult with your financial advisor before taking any kind of trades.
Dear traders, If you like my work then do not forget to hit like and follow me, and guy's let me know what do you think about this idea in comment box, i would be love to reply all of you guy's.
Thankyou.

WELSPUNIND | SWING TRADE | BULLISH MOMENTUMWELSPUNIND | SWING TRADE | BULLISH MOMENTUM
CONFIRMATION FACTORS
1) Pole and Flag formation
2) 20/200 EMA Crossover
3) Market structure breakout and good consolidation happening

DABUR INDIA LTD - Forming Reverse Flag PatternDabur India Ltd is forming a Reverse Flag Pattern and it is about to give a breakout at 528.
Based on the pattern, one can enter around 528 after the breakout and target can be set around 487 with Stoploss of 540.
This gives us risk to reward ratio of 3.3. Pattern is forming on hourly chart.
Disclaimer:
This idea is only for education purpose, Please consult your financial advisor.
I am not SEBI registered.

SRFSRF made flag n pole pattern on hourly charts with decent volumes & broke out of flag pennant pattern.
Could be bought with mentioned stoploss & target.
Not too be missed breakout.

TRENTTRENT made flag n pole pattern on an hourly charts with good volumes, although, it hadn't broke out of it yet.
Safe traders could wait patienty to break above 1364 then enter with mentioned stop & target.
Aggressive traders can buy here add on dip or add more above breakout with mentioned stoploss & target.

Prestige on Bullish This script traded under the channel pattern and takes the support at Weekly trend line as well as channel support line.Target is the resistance of the channel pattern and stoploss is below the channel pattern support line weekly close.
DISCLAIMER:
I am not a SEBI registered person this is not an investment tips it's just for an educational purpose. So don't take any trade blindly based on this analysis discuss with your financial advisor before taking any trade. I am not responsible for your profit or loss.

JINDALSTEL [flag pattern]A bull flag pattern with good consolidation after breakout ...... happen good "watch on "
Disclosure : I am not SEBI registered. The information provided here is for Education Purposes only.
Consult your financial advisor before taking any decisions
