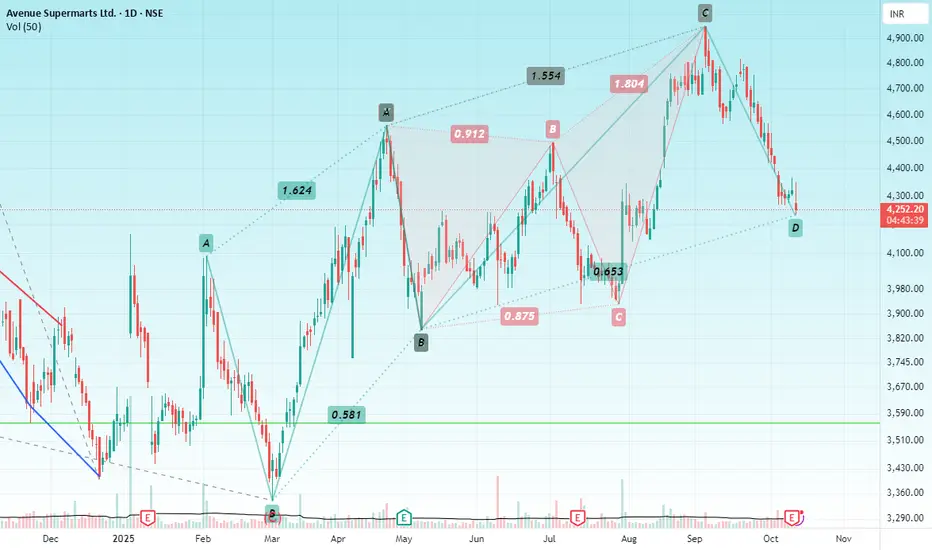
DMARTHello & welcome to this analysis
DMART has usually reversed regularly from Harmonic Patterns as can be seen in this chart in daily time from a
Bullish Reciprocal ABCD
to a
Bearish Deep Crab
to now forming a
Bullish Reciprocal ABCD
If it sustains above 4200 then it could give a probable bounce/reversal to 4400 & 4550 indicating a good risk : reward ratio
All the best
Fmcgstock
Bajaj Health care falling wedge pattern.Price Action: A "weapon candle breakout" is evident, with the price testing 497.60 INR, supported by a "huge volume" spike, indicating strong bullish momentum.
Pattern: A falling wedge pattern is noted, typically bullish, with the breakout suggesting a potential upward trend.
Targets and Support:
As per chart any dip up to 458 is buying opportunity for Price targets are set at 646 INR (TG1) and 784 INR (TG2).
Indicators:
RSI (14, close) at 67.72 nears overbought levels.
MACD shows a bullish crossover.
ADX is in momentum (above 25) with +DI above -DI, confirming trend strength.
Like and support.

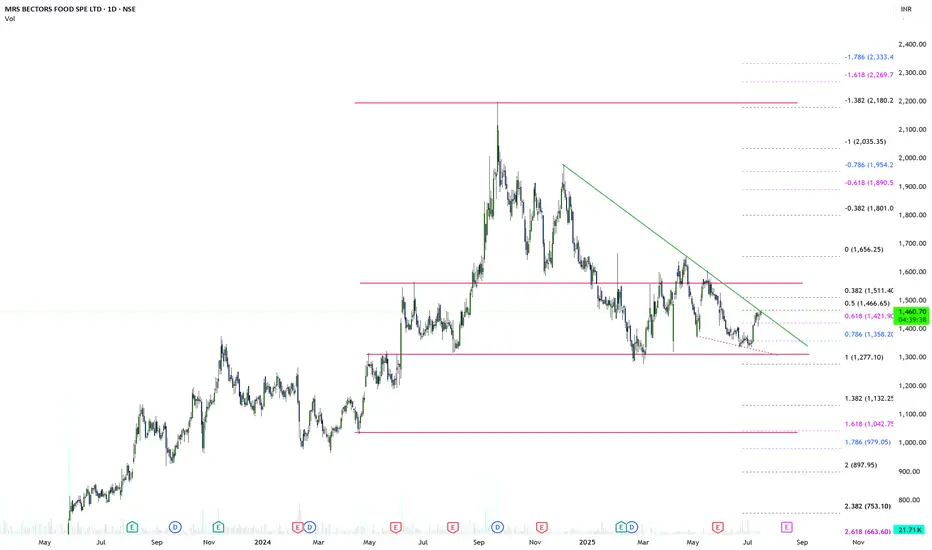
BECTORFOOD: Craving for a Breakout!?BECTORFOOD is near it's trendline breakout zone and expecting it to touch 1800-2000 in coming months.
Enter with Limited qty and slowly add more on dips (only recommended for Safe players)
NOTE: I'm not a SEBI REG. Study charts before investing.
EMAMI LTDHello & welcome to this analysis
the market has taken a heavy toll across all sectors, not even sparing the defensive sector - FMCG.
What lies ahead for Emami, a fmcg co with established brands across several segments - I have in this video covered the stock across multiple time frames showing likely support areas and probable resistance areas keeping in mind the likelihood of more upside in the medium to long term based on the studies of Ichimoku & Fibonacci
Happy investing

Hindustan UnileverHello & welcome to this analysis
FMCG sector appears to be doing better then other sectors after a very long time with Hindustan Unilever having a large weightage in the sector
Strength signal -
Since 2008 it has never violated the Quarterly Ichimoku Base line nor the Monthly Ichimoku Cloud. Near these support levels it becomes a very attractive value buy. This time also in 2024 it did the same.
After giving a Cup & Handle breakout in the weekly time frame its seen a pullback since October 2024 along with the rest of the market. In the last 3 weeks its gone sideways whereas we have seen other sectors continue to see sharp selling. Once again highlighting that current level is seeing consistent buying support. The pullback appears to have been completed as it bounced back from its rising trend line.
A daily falling wedge breakout has also witnessed a pullback now. As long as it now holds the rising trendline at 2350 it has good potential for upside suggesting a decent low risk high reward set up from short to medium term.
Upside levels one can look out for above 2400 are at 2700 / 3100 / 3300 / 3600
All the best for your trading and investing
My last video on the stock link is shared

Dabur India Stock at a Critical JunctureDabur India Ltd., a leading FMCG player, is showing an interesting technical setup on its weekly chart.
Key Highlights:
Strong Support: The stock has consistently respected a long-term ascending trendline since 2012.
Triangle Pattern: A descending triangle is forming, signaling potential breakout or breakdown.
Current Level: Trading at INR 507.50, near critical support at the trendline.
Outlook:
Bullish Case: A breakout above the triangle could target INR 680.
Bearish Case: A breakdown below INR 480 may signal further downside.

Britannia is ready to leave the ground and start flying Hello everyone, i hope you all will be doing good in your life and your trading as well. Today i have brought another nifty50 stock which is trading at important support zone, Probability is high it can take off means it can leave the ground and flying in blue sky.. I am expecting minimum 35%+ move in this swing, if you check chart above i have shown every swing since it has given a breakout in November 2022, and then it is just making higher highs and higher lows channel and respecting the upward support trendline, this time again we have seen correction in many stocks so britannia also corrected and it is just trading above to Upward support trendline, i am expecting it will surely take support in this zone and fly in blue sky. I already have mention the levels above for stop loss and targets please follow in your trading.
Fundamental Analysis
D/E is 0.52
Interest Coverage ratio is 18.77
D/E 0.52 has reduced as compared to last year's D/E 0.84
ROCE is 49.25%
ROE is 57.1%
ROCE 49.25% is higher than 5 years ROCE average 45.76%
ROE 57.1% is higher than 5 years ROE average 52.47%
Operating Profit Margin (EBITDA Margin) is 18.9%
Operating Profit Margin (EBITDA Margin) 18.9% has improved as compared to last year's OPM 17.11%
NPM is 12.76%
Dividend Yield is 1.5%
Free Cash Flow yield is 1.72%
Company has a negative Cash Conversion Days of -27.09
Dividend pay-out is 82.75% of Net Profit
3 Years Sales CAGR is 13.07%
3 Years Profit CAGR is 15.11%
FII have increased their stakes by 0.5% in the latest quarter (17.41% to 17.91%)
Retail/Public have reduced their stakes by 0.46% in the latest quarter (16.69% to 16.23%)
Retail/Public have reduced their stakes by 4.71% in last 3 years
Promoters + FIIs + DIIs hold 84.69% in the company
Disclaimer:- Please always do your own analysis or consult with your financial advisor before taking any kind of trades.
Dear traders, If you like my work then do not forget to hit like and follow me, and guy's let me know what do you think about this idea in comment box, i would be love to reply all of you guy's.

Inverted Head and shoulder pattern formed in Nestle indiaNSE:NESTLEIND Ready for breakout
Weekly chart
Inverted Head and shoulder pattern formed
Stoploss at your risk
Target may be achieved in 3-4 months because it is a low volatility stock
Rising volume since 3-4 weeks showing buyers interest
Do as directed in the chart 📈
Do your analysis before taking any step
This is not trading recommendation or advise.
Follow for more such analysis.Thank you.

20% upside possible in TATA Group (FMCG) Stock in short termHello i hope you all will be doing good in your life and your trading as well, today i have brought a stock which is belongs from TATA Group and stock in from FMCG sector. Stock is forming narrow Contractions which comes in volume contraction Pattern. Soon stock can give breakout of the zones which i have marked above in chart. Stock is good to go as positionally for short term to medium term. I will explain about this VCP method in next paragraph.
The Volatility Contraction Pattern (VCP) is a technical chart pattern used in stock trading to help identify potential buying opportunities and market breakouts. It's based on the idea that a period of low volatility is likely to follow a prolonged consolidation phase.
What it is?
A chart pattern that indicates a stock is preparing for a breakout.
How it works?
A price consolidation phase, where the price moves within a narrow range, followed by a breakout or breakdown.
Characteristics?
A series of smaller contractions, each tighter than the last, ideally with 2-4 contractions.
How it's created?
A supply and demand characteristic, created by institutions accumulating within a base.
How it's used?
To identify potential entry points for trades.
Note:- I have taken help of Google to explain about this pattern.
Tata Consumer Products Ltd. is one of the leading companies of the Tata Group, with presence in the food and beverages business in India and internationally. It is the second largest tea company globally and has significant market presence and leadership in many markets. In addition to South Asia (mainly India), it has presence in various other geographies including Canada, UK, North America, Australia, Europe, Middle East and Africa.
Market Cap
₹ 1,20,297 Cr.
Current Price
₹ 1,216
High / Low
₹ 1,254 / 844
Stock P/E
90.6
Book Value
₹ 162
Dividend Yield
0.64 %
ROCE
10.6 %
ROE
8.32 %
Face Value
₹ 1.00
Industry PE
30.1
Debt
₹ 3,477 Cr.
EPS
₹ 11.5
Promoter holding
33.8 %
Intrinsic Value
₹ 188
Pledged percentage
0.00 %
EVEBITDA
46.1
Change in Prom Hold
0.29 %
Profit Var 5Yrs
27.0 %
Sales growth 5Years
16.0 %
Return over 5years
34.4 %
Debt to equity
0.22
Net profit
₹ 1,167 Cr.
ROE 5Yr
6.83 %
Profit growth
15.9 %
Earnings yield
1.81 %
PEG Ratio
3.36
Disclaimer:- Please always do your own analysis or consult with your financial advisor before taking any kind of trades.
Dear traders, If you like my work then do not forget to hit like and follow me, and guy's let me know what do you think about this idea in comment box, i would be love to reply all of you guy's.
Thankyou.

Perfect Trading Setup- BRITANNIA INDSUTRIES LTD Britannia has break the resistance on daily Timeframe and retested previous resistance that has become a good support on 15 minutes timeframe So my overview is very bullish in this FMCG stock.
It's a perfect Price action for a Swing Trading which can be hold for next few days.
Options selling will be my favourite because 26 September is a expiry and premium will decay fast.
I Always trade with a hedge to minimize losses and also use Stoploss.
This is just my overview after analysing and I am not recommending to trade. This is just for teaching and Observing purpose

apex fozen forming flag and poleapex fozen forming flag and pole
stock is looing good for short term

#Tataconsumer, highly upside potential candiate..After the completed Inverted H&S pattern , now creating C&H pattern.

AVANTIFEED: Ready to FEED!!AVANTIFEED is in a Flag pattern and expected to breakout soon with great volumes. Keep this on radar and can give handsome returns in coming weeks.
Targets are marked on the trendlines.
NOTE: I'm not a SEBI REG. Study before investing.

Tata consumer-A strong flag breakout in this FMCG stock!Tata consumer has given good breakout after a decent flag consolidation.
Stock can fly towards ATH and also make a new ATH soon. Keep in watchlist.
Amazing risk reward at CMP and relatively safe stock for long term.

HUL - A snail!Price analysis & overview:
1. Moves are very choppy.
2. Until it breaks ATH, there is nothing to do with this stock.
- Stay tuned for further insights, updates and trade safely!
- If you liked the analysis, don't forget to leave a comment and boost the post. Happy trading!
Disclaimer: This is NOT a buy/sell recommendation. This post is meant for learning purposes only. Please, do your due diligence before investing.
Thanks & Regards,
Anubrata Ray

Heritage foods-A swing trade to watchout forHeritage food has given good move, around 100% returns in past 12 months.
Currently, stock is consolidating and can give good move once breakout of flag is done.
FMCG sector is looking strong and it can support the breakout in this stock.
Do keep in watchlist.

Dabur India has given Breakout of Bullish Triangle PatternHello Everyone,
I hope you all will be doing good in your trading and your life as well, i have a stock which has given a bullish triangle pattern breakout on weekly timeframe. Stock name is Dabur India and it is one of the leading fast moving consumer goods (FMCG) players dealing in consumer care and food products. Dabur India Limited is the fourth largest FMCG Company in India and the world’s largest Ayurvedic and Natural Health Care Company with a portfolio of over 250 Herbal/Ayurvedic products.
Market Cap
₹ 1,09,930 Cr.
Current Price
₹ 620
High / Low
₹ 634 / 489
Stock P/E
60.7
Book Value
₹ 55.7
Dividend Yield
0.84 %
ROCE
22.3 %
ROE
19.2 %
Face Value
₹ 1.00
Industry PE
44.5
Debt
₹ 1,365 Cr.
EPS
₹ 10.4
Promoter holding
66.2 %
Intrinsic Value
₹ 145
Pledged percentage
0.00 %
EVEBITDA
38.4
Change in Prom Hold
0.01 %
Profit Var 5Yrs
3.89 %
Sales growth 5Years
7.81 %
Return over 5years
8.67 %
Debt to equity
0.14
Net profit
₹ 1,811 Cr.
ROE 5Yr
21.6 %
Profit growth
7.26 %
Disclaimer:- Please always do your own analysis or consult with your financial advisor before taking any kind of trades.
Dear traders, If you like my work then do not forget to hit like and follow me, and guy's let me know what do you think about this idea in comment box, i would be love to reply all of you guy's.
Thankyou.

GODREJCP CUP N HANDLE PATTERNGodrej Consumer Products Limited is an Indian Multinational consumer goods company based in Mumbai, India. GCPL's products include soap, hair colourants, toiletries and liquid detergents.
It is one of leading FMCG firms in india as well as globally, their range of product mainly covers shampoo, hair colours, grooming kits.
1.5 billion people globally use Godrej products from soaps and hair care to home care and health every day.
We recently identify a cup n handle pattern in Godrej consumer products.
CMP: 1315
SL : 1270
T1 : 1390
T2. : 1400
T3 : 1440
Note : It is recommendation it is only for educational purpose

COLPAL CUP N HANDLEColgate-Palmolive Company is an American multinational consumer products company headquartered on Park Avenue in Midtown Manhattan, New York City. The company specializes in the production, distribution, and provision of household, health care, personal care, and veterinary products We do see a good breakout as cup n handle pattern.
CMP : 2870 on closes basis
SL 2760
TARGET: 2940 / 3050
Note : This is only for educational purpose

VBL FOR TARGET 1650One of the major stock for FMCG segment clearly showing uptrend. VBL ( Varun Beverages ltd)has corrected in recent correction . and now stock is ready for big up move rally for the target of 1650
CMP : 1420
SL : 1365
( Above idea is only for educational purpose )

Hindustan UnileverHello & welcome to this analysis
It has been an underperformer for the last 4 years and has still not shown any clear sign of reversal except for going sideways in lower time frame due to being over-sold.
2250 is a crucial support, failure to hold could lead to further down side till 2100-1950. While short covering could come in earliest above 2275 with resistance lined up at 2300-2350-2450
Happy Investing

DABUR (BO with volume)DABUR is moving aggressively for a breakout. Moving out of this triangle will lead to another high.
NOTE: I'm not a SEBI REG. Study before investing.

CNX FMCG Indices Technical Analysis - Nifty FMCG did play out exactly the way I had forecasted and now it's following my path.
- FMCG stocks can witness a good retracement and I think this isn't the right place to add them as well
- For any long term Investments better try understanding the fact that catching a bullet train in the middle won't help you in gaining money it will help you more in losing.
