Banknifty forecast 21-22 Nov’22 l Elliott waveBanknifty can have two possible scenarios. It is in correction of 5 wave while in 4 of 5.
4 looks completed and we are in last leg then temporary pause of fall expected.
Red : most likely scenerio. Below 50300 we are short for impulse down 💰💰
Green: less likely but we are still in wave 4 it will tests our patience should move very slow up towards 50900-51000.
Disclaimer: This post is for educational purpose. No trade/ buy/ sell signal is suggested or advised. Do your own analysis before buying or selling any stock/options.
Forecast

BEL AnalysisNSE:BEL is forming a clear parallel channel pattern in 1D TF which could be traded once broken out..
Disclaimer:- This analysis is only for educational purpose. Please always do your own analysis or consult with your financial advisor before taking any kind of trades NSE:BEL


USDINR - all time highs will be taken out in November?USD is making some serious inroads. INR trailing behind unable to maintain the equilibrium.
83.4210 is the current ATH. Today we went up to 83.3010. TVC:DXY at 107.
Continued FII selling will only add fuel to the fire. When the Indian media houses are gung-ho about the decadal that belongs to India & its growth story - the people outside are not that interested.
TVC:US30Y quoting 4.945% looks exciting from a debt perspective !
--
A rising USDINR means the INR is getting devalued. Calendar year 2022 saw an erosion of 11.07%, YTD is only 0.61% - will the rising US yield + war in middle east further erode the Indian Rupee??

Price action analysis on 2 Swing ideas for 21 sep I daily make educational content videos for swing / positional trading

USDINR Asceding Trangle Pattern The weekly chart of the USD INR is the ascending trangle pattern formation: In the techanical view the probability of the brackout is high as compare to the brackdown.
Currently the crude price hike, this is negative effect the USDINR
Next year is the election, previous chart patter show election year Rupee is fall
Foreign investor sold the indian market

Big Breakout In USDINR. Will Equity Market Fell ??Buy USDINR At Cmp - 82.68 & On Dips To 81.6
SL - 80.4 ( Weekly Closing Basis )
Target - 93

USDINR trade set upSince Oct 2022, USDINR first time gave breakout today.
We can see volatility in coming days.

Rupee is gearing up for move!!!!Rupee is gearing up for move if dollar index starts closing below 99 then rupee will move towards 80 & 78. If dollar index move towards 104 then rupee can give more above 83 towards 85 & 87 then Bank Nifty also take back seat & IT sector move. Trade with stoploss & happy trading.

USOIL.F ANALYSIS ( Crude Oil Prices )ANTICIPATION OF FED DECISION
The Federal Reserve is meeting this week to decide on a potential interest rate hike. While analysts agree that the central bank will maintain its rates for the first time since March 2022, investors are focused on the tone of the announcement. If the Fed hints at further rate hikes later in the year, as many predict, oil prices could decline further🔻📉.
GLOBAL ECONOMIC CONCERN
The Eurozone has entered a technical recession, and there are concerns about the U.S. economy facing a similar fate due to potential interest rate hikes by the Federal Reserve in response to high inflation. The economic data from China, the world's largest oil importer, also showed a decrease in exports for the first time this year, raising concerns about short-term global oil demand.
TECHNICAL ANALYSIS
As per the technical analysis of USOIL in a DAY-TF,WEEKLY-TF & MONTHLY-TF are showing downtrend ( STRONG SELL ). Apart from this, Moving Average ( MA5 (SELL 69.28), MA10(SELL 70.47), MA50 ( SELL 73.88), MA200 (SELL 78.20)) & Technical Indicator ((RSI(14)SELL), (STOCH(9,6)OVERSOLD), (MACD(12,26)SELL)) are showing strong sell.

USDINR plan for next week’s This is the plan of USDINR breakout for next upcoming seasons according to price action advanced analysis upcoming target of this currency pair apx is 6-7% in one month

The 2000 Withdrawal Rally 1$ = 85 INR ???USD INR chart seems to be ready for a rally.
Breakout from the Symmetrical Triangle.
Can we see 85 ?

USDINR is looking bearishInitial targets of USDINR on breakdown in dollar. High volatility can be expected - pyramiding will be best approach
Use Discretion!

GOKULAGRO LONG PREDICTIONThis is my first public prediction for the equity and it is my view on this stock to go up.
This is for education and knowledge.
Note:
There is a HAMMER AND INVERTED HAMMER
candlestick pattern on the 50 day EMA.
Downmove of 40 point before making of
this pattern.
And a Strict Stoploss as shown in the Chart.

USDINR March 2023 Month Expiry Target is 83 From Price Action, data etc its very clear 82.50 is acting as support and 82.75 and 83 as Resistance for rest of march 2023 month......
I think before march expiry 83 will be tested at least once !!!!!!

USDINR predictive analysis with future directions in DCB.USDINR hovering between the marked suppy demand zones as per present price action.

USD INR : WILL IT BREAK THE RESISTANCES THIS TIMEI am sharing my view on USD INR Movement as of now and predicted the two possible moves on the chart. The chart is moving in a range since 14 Feb 2023 and shrinking all the way to form an ascending triangle. I have tried to wind up its movement as shown in the chart. As USDINR has already tested the resistance level 1, 5 times, and thus the probability of breaking out is high, with support of two Moving Averages below the CMP, and ascending support line. However , it may encounter another rejection at resistance level 2 again , as it has not been tested much.
Please share your views !

USDINR1st BUY 82.02 (30% of your capital)
2nd BUY 81.73 (30% of your capital)
3rd BUY 81.43 (30% of your capital)
A margin call of 10% must be maintained.
Note: Only buying (long FUT or Monthly CALL) is recommended here; no shorting or bearish trend is recommended; almost all events are happened so strong naturals (above > 82.39); do not buy weekly CALL options and OTM CALL options; only ITM or ATM monthly options are recommended.

USDINRPlease keep in mind that this is only for futures and positional traders.
You can buy USDINR in 3 different buy zones, as mentioned (Buy zone 1, Buy zone 2, Buy zone 3).
There is NO-STOPLOSS; simply purchase as much as you can. Don't panic if it reaches Zone 3; instead, buy as much as possible.
It is important to note that this view is for the next three months and is not recommended for short-term time frames.
Note 1: Do not trade CALL options based on this view because it is a long-term view and you may lose money buying OTM or ITM due to theta decay in the long run.
Note 2 : Because the USDINR is oversold, strong Bullishness is expected to continue, and only buying is recommended (avoid short selling or buying PUT options) at retracement levels.

Understanding Inside Bar setup concept with trade example I daily make educational content videos for financial markets

USDINR WAVE ANALYSISFX_IDC:USDINR seems to be forming Truncated 5th Wave.
Lot of selling pressure at 83 with RSI negative divergence suggesting momentum Fading.
Unless 83 is Taken out on closing basis. It could turn out to be Wave 5 Truncation as per Elliottwave Theory.

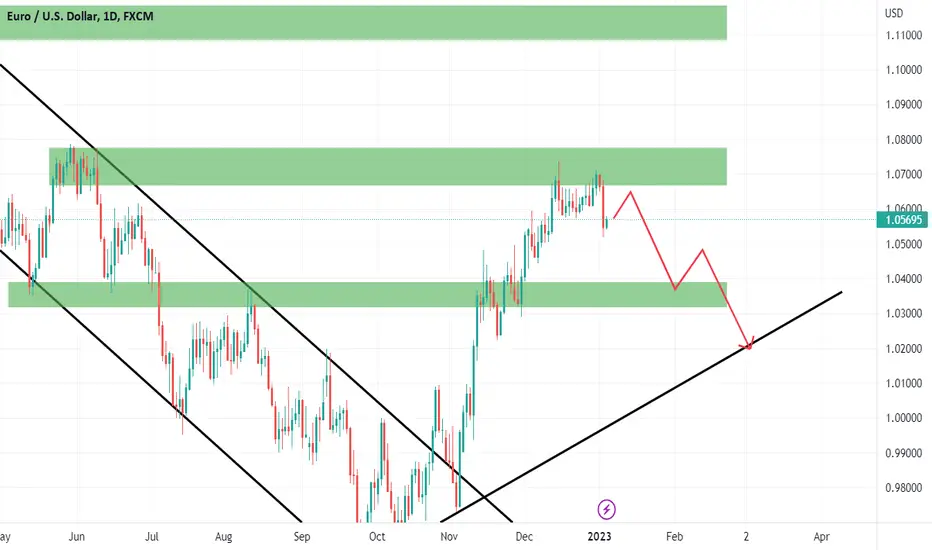
{GREAT SELL OPPORTUNITY IN EURUSD}In the daily timeframe EURUSD is consolidating since many days at the supply/resistance area. You may enter the sell to reach the target as I mentioned.
Happy trading
3 Amazing Swing trade Pattern based Ideas for December I daily make educational content videos for financial markets
