Xau USD Bullish Xau USD buying come at 4671 and then boom to 4852 . It's good bet as Usa is Asking for greenland and Max EU countries are selling USA bonds. Then Buying will come more in Safe haven assest like Gold & Silver . Xau USD may touch 5000 in coming week . Keep SL . Trial SL.
Tgt 5000+
Forex-trading

Market Update: Gold The Battle at 4600After an explosive breakout to new all time highs, Gold is currently in a classic breather phase, sustaining its position remarkably well above the previous ATH. We are seeing a high-tight consolidation essentially a Bullish Flag forming on the daily chart. This suggests that the market is merely digesting recent gains and building the necessary energy for the next leg higher. Despite the broader bullish sentiment fueled by recent geopolitical tensions in Iran and the "Powell Probe" investigation into the Fed, the bulls have hit a temporary ceiling.
The 4600 level has emerged as the immediate line in the sand. On a daily closing basis, we are seeing consistent rejection here; the price is struggling to print a solid candle body above this psychological milestone. For a high conviction continuation, we need to see a clear daily close above 4600. Once this horizontal resistance is cleared, the structural path opens up toward the Monthly R2 at 4731.
On the flip side, the downside remains well protected. The Monthly R1 (4526) area is our primary support zone. As long as we hold above this on a daily close basis, the buy the dip mentality remains the dominant play. The mix of sticky CPI data and safe haven rotation keeps the floor solid, even if the bullish wave continuation requires a bit more patience.

XAUUSD H4 – Correction, then ExpansionXAUUSD H4 – Pullback Then Continuation Using Fibonacci and Key Levels
Gold remains in a strong bullish trend on H4, but the current structure suggests the market needs a pullback into liquidity before the next expansion leg.
Market View
The recent rally has pushed price into premium territory, which often triggers short-term profit-taking.
Fibonacci extensions are acting as liquidity magnets: 2.618 is a key reaction zone, while 3.618 is the next expansion target.
Main approach: wait for the pullback into support/buy zones, then follow the trend.
Key Levels to Watch
Near resistance: 4546–4550 (reaction zone / key resistance)
Sell reaction zone: 4632–4637 (Fibonacci 2.618, likely to cause volatility)
Expansion target: 4707 (Fibonacci 3.618)
Buy liquidity zone: 4445–4449 (best buy area in this structure)
Strong support: 4408 (critical defensive support)
Scenario 1 – Shallow Pullback, Then Push Higher
Idea: price pulls back lightly, holds structure, and resumes the uptrend quickly.
Preferred pullback zone: 4546–4550
Expectation: move back up toward 4632–4637, and if absorbed, extend toward 4707
Confirmation to watch: H4 candles hold above 4546–4550 with clear buying response (rejection wicks, strong closes, momentum return)
Scenario 2 – Deeper Pullback to Sweep Liquidity, Then Strong Rally
Idea: price sweeps deeper into the best demand zone before the next major leg.
Deep pullback zone: 4445–4449
Expectation: bounce back to 4546–4550 → then push to 4632–4637 → and potentially extend to 4707
Confirmation to watch: strong reaction at 4445–4449 (buyers absorb, structure holds, no clean breakdown)
Important Notes
4632–4637 is a sensitive zone where profit-taking and sharp swings can appear before continuation.
If price breaks and holds below 4445–4449, shift focus to 4408 to judge whether the bullish structure is still being defended.
Conclusion
The main trend is still bullish, but the best edge comes from waiting for a pullback and buying at key levels. Focus zones: 4546–4550 (shallow pullback) and 4445–4449 (deep pullback with better R:R). If Fibonacci expansion continues, the next upside target is 4707.
If you share the same view, follow me to get the next updates earlier.

XAUUSD: Bullish Breakout Confirmed? New ATH in Play!As anticipated in our weekly analysis, Gold started the week with a bang, opening with a positive gap and aggressively smashing through the previous All Time High of 4550. We are currently trading in "uncharted territory," and the price action is screaming bullish across all major timeframes.
🔍 Market Context & Drivers
The surge isn't just technical; the fundamental backdrop is fueling this "fear trade":
Geopolitical Flare-up: Tensions are peaking as the U.S. considers military options in Iran following recent unrest, alongside ongoing frictions in Venezuela.
Safe-Haven Inflow: Growing concerns over the Federal Reserve’s independence and the U.S. Supreme Court’s upcoming ruling on tariffs (expected Wednesday) are pushing investors toward the safety of gold.
Dovish Tailwinds: Last Friday's soft NFP data (only 50k jobs added) has cemented expectations for further Fed rate cuts, lowering the opportunity cost for holding Gold.
🛠 Trading Strategy
The trend is clearly your friend here. Since we have successfully breached the 4550 barrier, the focus shifts to the Daily Close.
The Confirmation: We need a solid Daily candle closing above 4550. This validates the breakout and traps the late sellers.
Buy the Dip: If we see a retest of the 4550-4540 area, it’s a high-probability "buy on dip" zone.
The Target: Once the breakout is confirmed, our primary objective is the Monthly R2 at 4731, with a secondary long-term target eyeing the 5000 milestone.
Immediate Target// 4731 Monthly R2 Pivot & psychological extension.
Breakout Zone// 4550 Previous ATH; Must close above this on the Daily to confirm.
Primary Support// 4550 - 4540 The "Flip Zone" (Old Resistance becoming New Support).
Major Support// 4500 Psychological handle & secondary structural floor.

Gold Stuck in Consolidation Ahead of FOMCGold just trading in sideways right now, stuck between 4,175 and 4,200 while everyone waits on tomorrow's FOMC. Current price around 4,194 is basically dead center of this range classic indecision. Nobody wants to make a move until Powell speaks.
Technically, it's pretty straightforward. If we push higher, there's resistance sitting at 4,240 4,255 that's been holding back rallies all week. On the flip side, a break below here targets the 4,100-4,120 support area .
The 25bp cut is basically a done deal. What traders actually care about is what Powell says about next year. Is the Fed done after this, or are more cuts coming? That's the real question, and nobody knows the answer yet.
So we're stuck in this boring chop. Volume's light, moves get faded quickly, and it's just back and forth noise. Honestly, it's the kind of price action that kills your soul if you're trying to trade it. Better to sit tight and wait for the Fed to give us some actual direction. Could rip through 4,240 if Powell's dovish, or dump to 4,100 if he sounds hawkish. Until then, it's just a waiting game.

EURNZDPrice action has been strongly bullish, with an impulsive push to the upside that took out a weekly high. That may have completed the price objective, which is why I’m now expecting a potential drop. A structure shift has already occurred and an entry was available, though I didn’t take it.
For now, I’ll stay on the sidelines and watch price action. If price reaches the demand zone, I’ll look for confirmation to get into longs. There’s also a large inefficiency/price void that could be filled on the way down. Let’s see how this pair develops — just sharing a possible scenario.

XAUUSD (Gold Spot) – Daily & H4 Update | 03 Dec 2025Yesterday’s session delivered exactly the kind of two-way volatility we often see when a strong trend starts to lose momentum. Gold opened with early selling pressure, dropped sharply, and filled the bullish Fair Value Gap (between roughly 4170–4200 before finding buyers. The 4200 psychological round number held firm as dynamic support, and more importantly, yesterday’s daily candle closed comfortably above it, a clear sign that bulls are still defending this zone aggressively for now.However, the broader context remains cautionary. As highlighted yesterday, we printed a very narrow Central Pivot Range positioned near the top of the recent range. Price ultimately closed below this CPR, which is typically a bearish development and suggests the aggressive bullish momentum we saw through November is fading, at least in the short term.Current Technical Structure
Immediate resistance cluster sits at 4245-50. A convincing H4 close above 4230 (Fib level for recent drop) would be the first meaningful sign of renewed bullish strength.
The real confirmation of trend continuation comes only with a decisive break and daily close above 4245–4250 (R1 and the recent range high). Until that happens, the path of least resistance leans lower within this ascending channel.
Key Levels to Watch TodayBullish scenario Hold above 4230 → potential retest of 4250–60
H4 close > 4230 → opens 4245–4250 and possibly 4280 (R2)
Daily close > 4245 → resumes the broader uptrend targeting 4300+
Bearish scenario Failure to sustain today’s CPR (4198–4203) on an intraday basis increases downside risk
Break and close below 4198–4200 → high-probability move toward Previous Day Low ~4165
Loss of 4165 exposes S2 ~4130 and potentially the lower levels
Summary & Bias As long as 4200 hold, the structural uptrend remains valid . That said, the narrow-top CPR, repeated failure at 4245–4250, and yesterday’s close below CPR all point to waning momentum. base case for the next 24–48 hours is continued range-bound/two-way action between 4165–4250 unless we get a clear daily close outside of this zone. A sustained break below 4198–4200 would shift near-term bias to bearish with 4165 and 4130 as logical downside targets. Conversely, bulls need to reclaim and hold 4230+ quickly to keep the November uptrend alive.

Gold Faces Critical Resistance: Will Bulls Break Through or FadeGold is currently trading around 4,217, , as bulls continue to struggle with a persistent resistance zone that has proven difficult to crack. .
The $4,240-4,250 level has emerged as a significant ceiling for gold price, repeatedly rejecting bullish advances over recent sessions. Multiple attempts by buyers to establish a foothold above this area have been met with aggressive selling pressure, creating major resistance for the current rally.
The repeated failures at this level suggest strong conviction from bears defending this zone.
Today's Central Pivot Range (CPR) formation presents a narrow range, which historically signals an imminent volatility expansion.
A narrow CPR often acts as a coiled spring the tighter the compression, the more explosive the eventual breakout. This technical setup demands heightened attention to risk management and position sizing.
Key Technical Levels to Watch
The ascending trendline (black diagonal) provides dynamic support
Bullish Order Block: $4,170-4,200 zone
Bullish Case:
A convincing breakout and close above 4,250 would invalidate the recent resistance and likely trigger stops from short sellers, potentially fueling a rapid move toward the R2 level at $4,290. The key word here is "sustain" we need to see buyers hold gains above resistance, not just spike through momentarily.
Bearish/Consolidation Case:
Failure to breach 4,250 could lead to profit-taking and a drift back toward the $4,200 level. A break below the ascending trendline would be a more significant warning sign, potentially opening the door to a test of the $4,170-4,200 order block. Loss of this support zone could accelerate selling toward $4,150.
Breakout traders: Wait for a decisive close above $4,250 with strong volume before entering long positions, targeting $4,275-4,300
Range traders: Look for mean reversion plays within the $4,200-4,240 range
Trend followers: Watch for trendline support holds for continuation long entries

Gold Stuck Between 4050-4100. Now What?Gold price is currently trading in classic range-bound behavior on the daily timeframe, with price action consolidating between the 4050-4100 area (On closing basis ) as marked by the rectangle on the chart.
Based on the current technical setup, I'm anticipating continued consolidation for approximately 6-7 weeks from this point. However, this isn't likely to be a simple sideways move the consolidation is expected to carry a bearish undertone, meaning we may see more pressure toward the lower end of the range during this period.
after mid-January, conditions appear favorable for a fresh buying rally to develop. This consolidation phase may simply be the market gathering momentum for the next leg higher, allowing for profit-taking and position adjustments before the next bullish impulse.
While range trading can be tempting during consolidation phases,., buying on dips remains the more favorable approach.

Brian here with the gold outlook for November 20thGood morning everyone, Brian here with the gold outlook for November 20th. The ABC correction phase of gold is nearly complete, and the market is preparing to enter a new wave phase amidst a flurry of USD data today.
Fundamental Analysis
Today's focus remains on the US labor data: NFP (or revisions), Unemployment Rate, and Initial Jobless Claims.
If the data shows a cooling labor market, expectations for the Fed to soon pivot to a rate-cutting cycle will rise, weakening real yields, putting pressure on the USD, and supporting gold prices.
Conversely, "too good" data will strengthen the dollar, allowing for a short-term repricing move, potentially dragging gold down to lower liquidity zones before recovering.
US session liquidity may be thin before the news release, making it prone to spikes due to algorithms and large flows simultaneously adjusting positions.
Overall, the macro backdrop still favors "buying the dip" for gold, but you must accept strong volatility around news time.
Technical Analysis
On the chart, gold has completed an ABC corrective wave within a descending channel, part of a larger uptrend.
The current descending channel only serves as a corrective leg after the previous upward wave; prices are trading above the "mean" area of the bullish structure, indicating the larger market structure remains bullish.
Below is the liquidity zone / demand zone 4013–4015, coinciding with the previous low and the lower channel boundary – if there's another stop-hunt to this area, it is still considered an opportunity to join the upward move, as long as 4008 is not breached.
Above, the 4086–4100 cluster is the decision zone: breaking and holding above here will confirm exiting the corrective channel, triggering an impulsive leg towards resistances 4132–4146 and further to 4187.
In summary, the main bias remains bullish, prioritizing buy strategies at support zones or after breakout confirmation.
Key Price Levels
Resistance: 4086 – 4100 – 4110 – 4132 – 4146
Support: 4040 – 4030 – 4015
Trading Scenarios
Buy Scenario 1 – Continuation Breakout
Entry: 4086
SL: 4078
TP: 4100 – 4120 – 4140
Prioritize when price breaks up and retests 4086–4100 as a new support zone, confirming exit from the descending channel.
Buy Scenario 2 – Deep Liquidity Sweep
Entry: 4015–4013
SL: 4008
TP: 4030 – 4045 – 4070
Watch for strong price reactions at the demand zone, with pin bars or engulfing candles signaling order flow returning to buyers.
Sell Scenario – Sell Reaction at Strong Resistance
Entry: 4144–4146
SL: 4151
TP: 4132 – 4120 – 4100
Short-term sell strategy, leveraging the high supply zone if price rises straight up without sufficient accumulation.
The medium-term upside target if the bullish wave develops as expected remains the 4187 area.
What do you think of this scenario? Remember to follow Brian for daily gold insights and comment your views below to join the discussion.

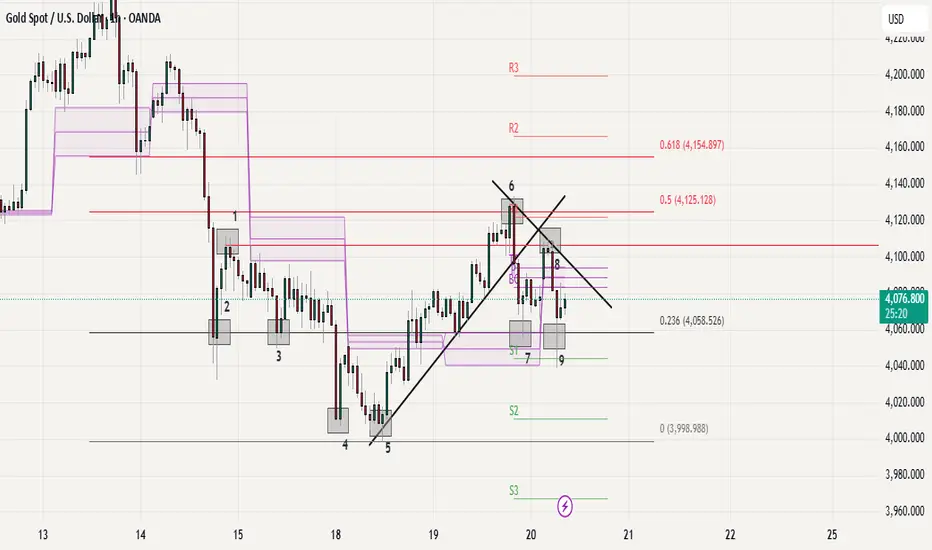
Gold Current Price Action Structure Looking weak under 6 and 8||
Support at 7 and 9, more correction under these POI.//
to go bullish need to claim /breakout on 6//
major support / Demand at 4 and 5//
Overall sentiments as per structure is correction /bearish for short term .
Gold Maintains Bullish Structure Despite 4245 Rejection We have seen a sharp rejection from the 4245 level yesterday, forming a red candle . However,. Gold found solid support at the weekly R3 level around 4147 and managed to close above it, which is a significant technical development. Currently, we're witnessing a strong recovery rally on lower tf that suggests the bulls aren't ready to give up just yet.
When we zoom in to the daily timeframe, yesterday's downward move appears to be just a normal bearish candle rather than a trend reversal signal. The key factor supporting this view is that price was trading well above the weekly R3 level throughout the session. In a healthy uptrend, these kinds of pullbacks are quite normal and often provide opportunities for fresh entries. The overall bullish structure on the daily chart remains intact, which gives me confidence that this isn't the beginning of a major correction.
Looking at the current setup, the first critical support level at 4140-4150. This zone has proven its importance multiple times, and as long as price holds above this area, I'm maintaining a bullish bias. A daily close below 4140-4150 would be the first warning sign that we might be heading back into consolidation territory. That scenario would require a reassessment of the trend direction.
However, if gold continues to respect the 4140-4150 support zone and builds on today's recovery momentum, we could see price pushing toward higher levels in the coming sessions. The bulls have shown their presence at key support areas, and with the daily structure still favoring upside, the path of least resistance appears to be upward for now.

XAUUSD – PRIORITISE BUYING, TARGET 4040XAUUSD – PRIORITISE BUYING, TARGET 4040 🎯
🌤 1. Overview
Hello everyone 💬
My perspective on gold today remains to prioritise buying, as there hasn't been a clear deep decline.
The price is currently consolidating in a narrow range, needing more time to build momentum before breaking out.
I will wait to buy back at the OB area – where there is high liquidity, this is a region likely to see strong price reactions.
The best scenario today: the price may sell lightly at FVG, then drop to OB to trigger the buy setup.
💹 2. Technical Analysis (ICT Perspective)
💜 Price Structure: Gold still maintains a short-term uptrend, the main trend hasn't been broken.
💎 Liquidity: Liquidity is concentrated below the 3940 area – potential buying OB.
💫 FVG: The 3975–3980 area is where a slight decline reaction may occur.
⚙️ Order Block (OB): 3938–3945 is a crucial support area, with potential for a strong price rebound from here.
📈 Main Target: 4040 – high liquidity area, coinciding with the large frame FVG.
🎯 3. Reference Trading Scenario
💢 Short SELL (scalping)
Entry: 3980 | SL: 3988
TP: 3972 – 3960 – 3940
💖 Main BUY (priority)
Entry: 3940 | SL: 3932
TP: 3952 – 3968 – 3990 – 4012 – 4035
✨ 4. Important Notes
🔹 Observe price reactions at FVG and OB before taking action.
🔹 If the price exceeds 3988, the decline scenario is temporarily invalidated.
🔹 The main direction remains to buy following the Smart Money trend – only look for short sells with confirmation.
🌷 5. Conclusion & Interaction with LanaM2
Gold is still on the right track of the Smart Money Flow,
patiently wait for the price to reach a favourable area to act 💪
This is not investment advice, just a personal perspective based on the ICT method.
If you find it useful, please 💛 like – 💬 comment – 🔔 follow LanaM2
to stay updated with the latest gold insights every day.

Gold Price Action: Healthy Pullback Within Broader UptrendGold is currently trading within a well-defined range on the daily timeframe, consolidating between 3,910 and 4,025 on a closing basis. Over the past several sessions, we've witnessed multiple attempts by buyers to reclaim the psychological 4,000 level, but sellers have consistently stepped in during intraday rallies, keeping the price action contained within this range.
From my perspective, this consolidation is likely to persist for a while longer. Looking ahead, I anticipate the range could potentially extend between 3,850 and 4,200 over the coming weeks as market participants digest recent moves. It's worth noting that we should prepare for a worst-case scenario where price breaks below 3,850 on a closing basis, especially given that volatility tends to pick up during year end trading.
That said, My view in this current phase as a healthy correction within the broader bull market. My bias remains tilted toward the buy side, and I'm expecting a potential resumption of the uptrend somewhere in the next 1-2 months, possibly around mid-January. The key here is patience with money management allowing this consolidation to play out while staying ready to capitalize on the next directional move. As always, proper risk management is crucial, particularly with year-end volatility on the horizon.

LiamTrading - $XAUUSD$: NEW WEEK TRADING SCENARIO...LiamTrading - OANDA:XAUUSD $: NEW WEEK TRADING SCENARIO – PRIORITISE SELLING After BREAKING THE TRENDLINE
Hello traders community,
The new week opens with a clear strategy: Prioritise SELLING after Gold has broken the previous upward trendline.
Although fundamental economic news (like interest rate policies and politics) supports Gold potentially reaching the $5,000$ USD mark, we must trade according to the current Price Action. The technical selling pressure is strong. We will SELL at key resistance zones and continue SELLING as the price breaks the downward structure.
📰 FUNDAMENTALS & LONG-TERM OUTLOOK
$5,000$ Prospect: Fundamental and political factors continue to support the scenario of Gold reaching $5,000$ USD in the long term (due to geopolitical risks and potential loss of Fed independence).
Short Term 🔴: Gold is under technical selling pressure after breaking through the $4,000$ USD mark.
📊 TECHNICAL ANALYSIS: TRENDLINE BREAK
Structure: Gold has exited the upward price channel and is retesting the broken trendline.
Priority: SELL at the retest resistance zone $4024$.
🎯 DETAILED TRADING PLAN (ACTION PLAN)
🔴 SELL Scenario (SELL Primary) - Preemptive Resistance
Entry 1: $4024$ (Sell retest trendline zone)
SL: $4032$
TP1/TP2: $4012$ | $4000$
TP3: $3989$
Entry 2 (Continuation SELL): When price breaks the next trendline at $3992$
SL: $4000$
TP: $3940$
🟢 BUY Scenario (BUY Reversal) - Buy at Strong Support
Logic: Only buy when price hits strong liquidity support, potential for a short-term rebound.
Entry (BUY): Around $3960$ (Buy Scalping Zone)
SL: $3954$
TP1/TP2: $3972$ | $3988 FWB:TP3 : $4000$
📌 SUMMARY & DISCIPLINE (Liam's Note) Don't let the $5,000$ USD prospect affect short-term risk management. Trade according to Price Action. Adhere to SL and prioritise SELL positions at resistance zones.
Are you ready for the SELL strategy at the start of this week?

Gold Continues to Struggle at 4000We're seeing a familiar story play out in gold as it makes multiple attempts to reclaim and hold above the 4000 level, but none of these efforts are showing the conviction we need to see from buyers. The price action on the hourly chart is particularly telling ,we're witnessing similar structural patterns repeating themselves, which often indicates indecision or a lack of strong directional commitment from either side. Once again, we've seen the rising support trendline get broken, which is not ideal for the bullish case in the short term.
However, there's a small silver lining worth noting. Today's CPR is showing an ascending structure, which typically carries some positive implications for intraday sentiment. It's not a game-changer by itself, but it does suggest that the technical setup isn't completely bearish. The key level to focus on for today's session is the CPR BC at 3971. This becomes our pivotal point ,if bulls can sustain trading above this level throughout the day, we could see another recovery attempt materialize toward the higher side. The ability to hold above 3971 would at least keep the door open for further upside exploration.
On the flip side, if we fail to maintain support at 3971 during the intraday session, it could trigger another leg down toward lower levels. Given the repetitive failed attempts at 4000 and the breakdown of support trendlines, the market is clearly at a crossroads here. We need to see some decisive action one way or the other to break out of this choppy, repetitive pattern.
As for my positioning, there's no change to my approach. I'm still holding my buy positions and actively managing the trades as this price action develops. The patience game continues, and while these repeated failures at 4000 are testing that patience, the broader picture still supports the long-term bullish thesis.

Gold Struggles at 4000: Managing Longs in Corrective PhaseYesterday's session brought some disappointment for the bulls as gold tested the psychological 4000 level but failed to sustain above it on the larger timeframes. After reaching a high around 4028, we saw sellers step in with conviction, leading to a breakdown of the ascending trendline that had been supporting the recent recovery attempt. The rejection at these levels was swift, and now we're trading back at lower levels, which puts the immediate bullish case on hold for the time being.
For today's trading session, the CPR range positioned between 3943-3968 represents the intraday battleground. This zone is now acting as resistance, and bulls will need to prove themselves here if they want to regain any meaningful momentum. To shift the current selling sequence and get back into control, price needs to reclaim the broken trendline support and more importantly, break above yesterday's high at 4028. Until that happens, the path remains to the downside, and we need to respect what the market is telling us for current short term structure.
On the support side, the 3880-3900 zone that we have to watch and losing control here could open the door for more corrections toward lower levels and can make attempt towards 3850 (50% Fib Level).
From a fundamental perspective, we're also dealing with some interesting cross-currents. The China-US trade deal developments are currently providing some headwinds for gold, giving short-term sellers additional reasons to press their advantage. However, zooming out to the bigger picture, yesterday's Federal Reserve decision to cut rates by another 25 basis points and signal the end of Quantitative Tightening is structurally bullish for gold over the medium to long term. This transition to monetary easing typically creates a favorable environment for precious metals.
As for my positioning, I'm continuing to manage my existing long positions. My broader view remains to buy the dip because the longer-term structure still favors the bulls. These short-term corrections, while uncomfortable, are part of the journey in trending markets. The key is staying patient and not getting shaken out by near-term volatility when the fundamental and structural backdrop remains supportive.

Gold Breaks Trendline: 4000 Back in FocusYesterday's trading session brought further downside pressure as gold pushed lower to test the 3880 zone, which is just above the monthly open. We have seen a decent recovery bounce from there, suggesting some buying interest is emerging at these lower levels. However, it's important to maintain perspective here while we're seeing short-term stabilization, the reversal signs on higher timeframes haven't materialized yet. We need to see more convincing price action and stronger closes on the larger timeframes before we can confidently call this as reversal to bullish case.
Also today we have extremely narrow CPR positioned at 3954. When we see such tight CPR levels, it often signals either an impending trend reversal or the potential for a high volatility session ahead. The early Asian session has already given us something to work with price is attempting to reclaim this CPR zone, which is a constructive development. Adding to the bullish case, we've also seen a breakout from the descending trendline structure that had been capping rallies over the past few sessions.
From a tactical perspective, the immediate support zone to monitor is 3900-3910.... If buyers can defend and sustain price action above this level, we could see gold make an attempt toward the first meaningful hurdle at 4000-4010. This target zone is particularly significant as it aligns with today's R1 pivot and the prior week's low, creating a confluence resistance area. A daily close above 4000-4010 would be an encouraging sign that momentum is genuinely shifting back in favor of the bulls and could open the door for further upside.
As for my positioning, I'm maintaining my existing buy positions and continuing to manage them as the price action develops. The risk-reward from these levels still appears favorable given the technical setup unfolding.

Gold Under Pressure: Critical Support Lost, 4040 Reclaim Needed Yesterday's session provided clear confirmation of the bearish pressure building in gold as price faced strong resistance around the CPR area between 4094-4108. The early Asian session rejection was particularly telling, as buyers simply couldn't get enough strength to push through this zone. What followed was a decisive breakdown below the psychologically important 4000 level, which had been acting as major support throughout the recent price action.
For today's session, CPR zone positioned at 4001-4040. This is now our critical battleground. Bulls need to reclaim at least 4040 (CPR TC) to suggest any meaningful recovery is underway. Without a clean breakout above this level, the path of least resistance remains to the downside, and bears are firmly in control of the near-term direction. The current price structure suggests sellers are gaining confidence, especially after yesterday's breakdown.
On the downside, the first intraday support level for today is to watch at 3933. This could provide a temporary bounce zone if we see continued selling pressure. However, given the momentum shift and the loss of 4000 support, we need to approach any long positions cautiously here. The market is clearly favoring the bears at this point, and it would take a significant shift in sentiment to change that dynamic in the immediate term.
My Position : I am still managing my buy entries and currently in floating loss ,max extension that I am expecting in lower side is at around 3800-50 area and that is manageable as per my current lot sizing.

Gold Bulls Unstoppable Another All-Time High! Gold continues its unstoppable march north, printing fresh all time highs almost daily. Despite a brief shakeout over the past couple of sessions, buyers stepped in aggressively, confirming strong demand on every dip.
From a technical perspective, the uptrend remains firmly intact. Price is comfortably holding above the 4,200 zone, which now acts as immediate support. The volume profile shows a significant cluster around 4,190–4,205, indicating strong buying interest in this area this is the level to watch for short term structure.
On the fundamental side, the macro backdrop continues to support gold: geopolitical tensions, central bank accumulation, and lingering inflation expectations all add fuel to the rally.
Bulls are clearly in control, and as long as gold sustains above 4,200, the path of remains up also watch two rising trendline carefully in case of breakdown we can expect pullback ., the move is getting a bit extended, so we have be cautious with fresh entries at these stretched levels.

Gold Holds Above 3850 But Faces Resistance at 3890–95 ZoneAfter printing a rejection candle on Wednesday, gold followed up with further weakness yesterday, but once again bulls managed to defend and push the price back above 3850, securing a daily close above this level. This makes 3850 the immediate support to watch, and only a confirmed H4 close below it could open the door for a deeper test of the 3810–3800 zone, which remains the next key support area. The current price action suggests that the much-expected pullback is underway, though it looks more like a healthy cooldown rather than a reversal, as the broader structure remains bullish. On the upside, the 3890–3895 zone is acting as immediate resistance and will be the key hurdle for bulls in the short term.

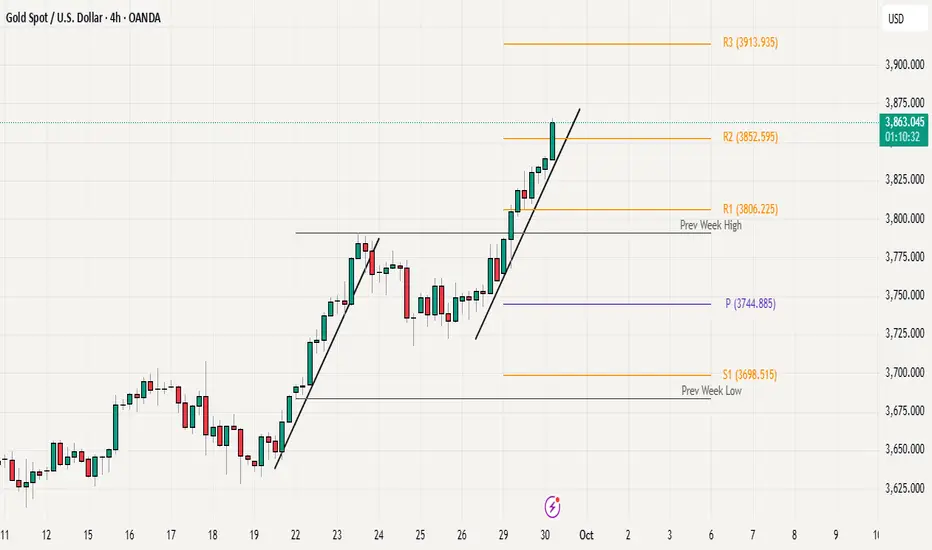
Gold Sets Record Close, Will Bulls Push Toward 3900 Next?Gold printed another all time high yesterday and closed with the strongest daily, monthly, and quarterly close on record. As expected with month-end and EOQ flows, we saw a phase of profit booking, but price quickly found support around the psychological 3800 level and Weekly R1 (3806), which is holding as a key demand zone for now. The overall structure remains bullish, and today gold is attempting to break above the previous day high / previous month high. A confirmed H4 close above this level would likely fuel continuation toward the next psychological milestone at 3900. On the downside, a breakdown below 3800 could open room for a corrective move into lower supports. For the near term, the market is trading within a range of 3810–3865/70, and a decisive breakout from this band will likely define the next directional leg.

Gold Strength Persists: Trendline Support Key Into EOQ ClosingGold continues to show impressive strength, holding its bullish momentum without any major signs of rejection from higher levels. Price action is moving with a steady pace, consistently finding support on the rising trendline, which remains a key technical guide for intraday moves. The immediate horizontal support is now seen around 3850, and as long as price holds above both the trendline and this level, bulls are expected to remain firmly in control.
For bears to gain traction, they would need to drag price under the trendline and 3850 on a closing basis(H4 or Higher), which could open the door for a pullback. Until then, momentum clearly favors the upside. note that today marks month-end and quarter-end closing (EOQ), which may bring additional volatility and sharp intraday swings.
Overall, the bias remains bullish above 3850, with the trendline acting as dynamic support and a key zone to watch heading into the new month.