Gold Holds Above 3850 But Faces Resistance at 3890–95 ZoneAfter printing a rejection candle on Wednesday, gold followed up with further weakness yesterday, but once again bulls managed to defend and push the price back above 3850, securing a daily close above this level. This makes 3850 the immediate support to watch, and only a confirmed H4 close below it could open the door for a deeper test of the 3810–3800 zone, which remains the next key support area. The current price action suggests that the much-expected pullback is underway, though it looks more like a healthy cooldown rather than a reversal, as the broader structure remains bullish. On the upside, the 3890–3895 zone is acting as immediate resistance and will be the key hurdle for bulls in the short term.
Forex

XAUUSD – Maintaining the Core Uptrend (BUY Bias)
Hello traders,
On the H4 timeframe, gold continues to show a steady upward trend. After testing the upper trendline, price bounced back and is now consolidating around the 386x region. This suggests the market may be in an accumulation phase, awaiting major news.
Fundamental Context
Tomorrow, the market will look towards the release of the Nonfarm Payrolls (NFP) data, an event that often brings strong volatility to gold prices.
In addition, concerns around the potential US Government shutdown are adding to the macro uncertainty, further supporting gold’s safe-haven appeal.
At present, there is little evidence to suggest gold will decline, particularly when other markets are also breaking higher.
Technical Analysis
Price continues to trade within the ascending channel on H4, with buyers holding the advantage.
MACD remains above the zero line, showing no clear signs of weakness.
Price is likely to consolidate further in the 3860 – 3870 range before a sharp move triggered by news.
Trading Plan
Buy Setup (preferred – trend following)
Entry: 3829 – 3832
SL: 3825
TP: 3845 – 3862 – 3877 – 3890
Sell Scalping (counter-trend, higher risk)
Entry: 3927 – 3930
SL: 3934
TP: 3915 – 3900 – 3882 – 3865
Note: Sell setups should be treated only as short-term scalps, as the primary bias remains on the buy side.
Conclusion
Gold is holding firmly within the uptrend structure, with no significant weakness yet. Given the backdrop of political uncertainty and the upcoming NFP release, the priority remains buying at suitable support zones. Any sell trades should be viewed as quick reactions rather than core positions.
👉 Follow me to get the latest updates as soon as price structure changes.

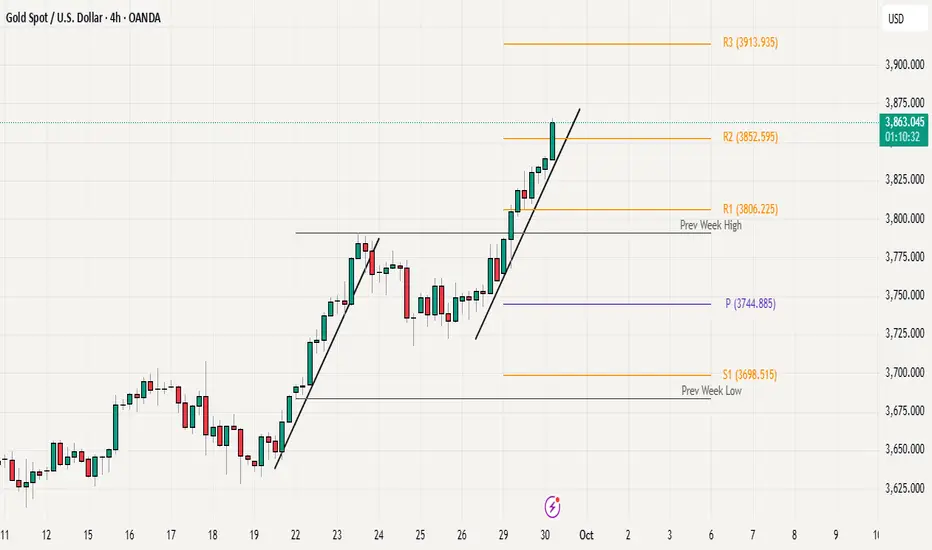
Gold Sets Record Close, Will Bulls Push Toward 3900 Next?Gold printed another all time high yesterday and closed with the strongest daily, monthly, and quarterly close on record. As expected with month-end and EOQ flows, we saw a phase of profit booking, but price quickly found support around the psychological 3800 level and Weekly R1 (3806), which is holding as a key demand zone for now. The overall structure remains bullish, and today gold is attempting to break above the previous day high / previous month high. A confirmed H4 close above this level would likely fuel continuation toward the next psychological milestone at 3900. On the downside, a breakdown below 3800 could open room for a corrective move into lower supports. For the near term, the market is trading within a range of 3810–3865/70, and a decisive breakout from this band will likely define the next directional leg.

Gold Strength Persists: Trendline Support Key Into EOQ ClosingGold continues to show impressive strength, holding its bullish momentum without any major signs of rejection from higher levels. Price action is moving with a steady pace, consistently finding support on the rising trendline, which remains a key technical guide for intraday moves. The immediate horizontal support is now seen around 3850, and as long as price holds above both the trendline and this level, bulls are expected to remain firmly in control.
For bears to gain traction, they would need to drag price under the trendline and 3850 on a closing basis(H4 or Higher), which could open the door for a pullback. Until then, momentum clearly favors the upside. note that today marks month-end and quarter-end closing (EOQ), which may bring additional volatility and sharp intraday swings.
Overall, the bias remains bullish above 3850, with the trendline acting as dynamic support and a key zone to watch heading into the new month.
XAUUSD – Will ATH Diminish Gold's Value?Hello Traders,
Gold once accounted for up to 21% of total global assets, but now this figure is only about 5%. Two perspectives are clearly visible:
Gold is gradually losing its relative importance in the financial system.
The total value of global assets has increased significantly (the denominator has expanded), causing gold's proportion to decrease, while the absolute value of gold still plays an important role.
Technical Analysis
In today's Asian session, gold continues to set higher price levels, indicating a very strong upward momentum.
The upward price channel on H1 has touched the upper boundary, showing slight hesitation, but the main trend remains bullish.
The H1 and H4 frames maintain strong buying pressure, with market sentiment heavily leaning towards buyers, ready to push prices to higher levels.
According to Elliott Wave, the price is currently in wave 5 (market sentiment wave). The current task is to observe the reaction when this wave completes, to prepare for the ABC correction cycle.
Regarding Fibonacci, the next important resistance area is at 3880, where a bearish reaction is likely to occur.
Trading Scenario
Sell (at Fibo resistance 3880):
Entry: 3880
SL: 3886
TP: 3866 – 3850 – 3835
Buy (trend-following preferred):
Entry: 3813 – 3816
SL: 3809
TP: 3828 – 3843 – 3860 – 3878
👉 Note: Smaller frames H1 – M15 will provide additional confirmation signals to optimize entry points.
Conclusion
The bullish trend of gold is still prioritized, wave 5 is not yet complete, and the scenario aiming for 4000 – 4050 is entirely feasible.
Short-term selling at strong resistance areas can be considered, but risk management must be tight.
Traders need to closely follow support – resistance areas in smaller frames to maximize profits.
Follow me for the fastest updates when the price structure changes and to discuss more scenarios in the community.

Cryptocurrency : The New Normal & The World of Leverage Trading.📌 Cryptocurrency: The New Normal & The World of Leverage Trading ⚔️ ( A Sweet Killer! )
🌍 Why Are Traders Shifting to Crypto? COINBASE:BTCUSD BITSTAMP:ETHUSD COINBASE:SOLUSD
✔️ Lower capital required compared to stocks
✔️ Fewer gaps (24/7 market = no overnight gap-up/down shockers)
✔️ High leverage opportunities (control bigger trades with smaller margin)
✔️ Global accessibility (Binance, Bybit, OKX, CoinDCX, Mudrex etc.)
📊 Types of Trading in Crypto
💠 **Spot Trading** → In India, 30% tax on capital gains ( check according to your country ).
💠 **Options & Futures** → Taxed as *Business Income* ( like F&O in stocks ). No flat 30% rule.
⚡ What is Leverage?
👉 Leverage means using *small capital* to control a *large trade size* , because the exchange lends you money.
Think of it like **margin trading** in stocks — but much more aggressive.
🔹 Example 1 : Normal Trade style ( No Leverage )
suppose you have 💰 Capital = ₹10,000
Bought BTC at Price = ₹10,000,000
* You can buy 0.001 BTC ( 10000 ➗ 10,000,000 ).
* If BTC rises 10% → Profit = ₹1,000 (+10%)
* If BTC falls 10% → Loss = ₹1,000 (-10%)
👉 Risk & reward move in proportion to your capital.
🔹 Example 2 : Leverage Trade style ( 10x Leverage )
suppose you have 💰 Capital = ₹10,000
opted Leverage = 10x
New Trade Size ( margin ) = ₹1,00,000 ( you can now utilize this margin amount for trading )
* You can buy 0.01 BTC ( 10000 ➗ 10,000,000 ).
* If BTC rises 10% → Profit = ₹10,000 (+100% return)
* If BTC falls 10% → Loss = FULL ₹10,000 ( Liquidation 🚨 )
👉 A 10% move = your account will be blown.
🔹 Example 3:
suppose you have 💰 Capital = ₹10,000
opted Leverage = 50x (Extreme ⚠️)
New Trade Size ( margin ) = ₹5,00,000 ( you can now utilize this margin amount for trading )
* You can buy 0.05 BTC ( 50000 ➗ 10,000,000 ).
* If BTC rises just 2% → Profit = ₹10,000 (+100% return)
* If BTC falls just 2% → FULL ₹10,000 loss ( Liquidation 🚨 )
* If BTC rises just 10% → Profit = ₹50,000 (+500% return)
* If BTC falls just 10% → FULL ₹10,000 loss ( Liquidation 🚨 )
👉 Tiny moves in high volatile asset class = jackpot or wipeout/blown.
⚔️ Key Takeaways :
1️⃣ Leverage multiplies profits 💸 but also multiplies losses too💀 ( a sweet killer! )
2️⃣ Crypto is *highly volatile* (10–20% daily moves are common) → High leverage is extremely risky, if not managed well.
3️⃣ Beginners should **never use more than 2x–3x leverage**
👉 In simple words: **Leverage is a double-edged sword ⚔️**
Used wisely → You’re a king 👑
Used recklessly → You’re broke 🥀
🚘 Liquidation Explained ( ex: Car Analogy )
Imagine you pay ₹10,000 to rent a car worth ₹1,00,000. (That’s 10x leverage).
* The car is in your hands, but ₹90,000 still belongs to the owner of car (exchange).
* If the damage goes beyond your ₹10,000 margin → the owner takes back the car immediately.
👉 That’s liquidation: when your loss = your margin.
🔹 Case 1: Normal Trade style ( No Leverage )
Margin = ₹10,000 → Buy BTC.
If BTC drops 10% → Loss = ₹1,000.
You still have ₹9,000 left.
✅ No liquidation. Just a normal loss.
🔹 Case 2: 10x Leverage Trade style
Margin = ₹10,000
New Trade Size ( margin ) = ₹1,00,000
* BTC rises 10% → Profit = ₹10,000 (+100%)
* BTC falls 10% → Margin wiped = Liquidation 🚨
🔹 Case 3: 20x Leverage Trade style
Margin = ₹10,000
New Trade Size = ₹2,00,000 ( margin )
* BTC rises 5% → Profit = ₹10,000 (+100% return)
* BTC falls 5% → Margin wiped = Liquidation 🚨
👉 Just 5% against you = Account gone.
🔹 Case 4: 50x Leverage Trade style (High-Risk Zone ⚠️)
Margin = ₹10,000
New Trade Size = ₹5,00,000 ( margin )
* BTC rises 2% → Profit = ₹10,000 (+100% return)
* BTC falls 2% → FULL ₹10,000 loss = Liquidation 🚨
👉 Just 2% against you = Blown account = Game over.
🎯 Final Word
Leverage = Power ⚡
But in crypto’s volatile world, it’s also a **trap for the impatient**.
* Smart traders use small leverage.
* Impulsive traders burn out with high leverage.
💬 Question for you: What’s the **highest leverage** you’ve ever used in a trade? Drop it below 👇 (Be honest—we’ve all been tempted!)
If this Idea gave you a value information then please, Boost it, share your thoughts in comments, and follow for more practical trading!
Happy Trading & Investing!
@TradeWithKeshhav and team

Gold Hits Fresh ATH fresh Support at 3790, Bulls Eye 3806 & 3850Gold printed a fresh all time high today and, so far, there are no signs of rejection on higher timeframes. The immediate level to watch on the downside is last week’s high near 3790, which now acts as key support. As long as price holds above this level on a 4H or higher close, bulls remain in control and may attempt a move toward the next resistance zone at 3800–3806, which is aligned with the weekly R1 and psychological round number resistance. A sustained breakout above this zone could open the door for a push toward 3850 (weekly R2). On the flip side, if sellers manage to drag price back below 3790 on a closing basis, we could see a deeper pullback before the next leg higher.

LiamTrading – Medium-term Gold Outlook H4Let's prepare the scenario for the new week, folks!
In my opinion, gold in the coming week may start to show a medium-term correction phase. However, it is important to note that nothing is absolutely certain on a larger timeframe. If you are trading intraday, stay closely aligned with price action to ensure higher accuracy.
Gold closed the weekly candle at 3759.85 – a price level that clearly indicates hesitation. The end-of-week session showed a rejection of price increase, mainly due to profit-taking pressure, so it cannot be immediately confirmed that a downtrend will begin.
The upward price channel is still strong, so it is essential to maintain a buying trend mindset to ensure the confidence in holding profits remains firm.
The upward structure is still stable, but the RSI has reflected a weakening in buying sentiment. To confirm a medium-term correction, gold needs to break 3720. At that point, a reasonable strategy would be to wait to sell around 3737–3740 (retracing to the trendline), targeting the support area coinciding with the highest volume profile cluster at 3645.
Conversely, the buying scenario will occur when:
- Price touches the 3735 boundary and a candle rejection reaction appears.
- Or gold breaks above the minor resistance at 3780, in which case you can buy immediately, with expectations towards the 3850 area.
Next week, be patient and wait for market confirmation to increase the probability of success. I will continue to share detailed scenarios in each trading session for everyone to stay updated.

XAUUSD – New Week Scenario on D1 FrameXAUUSD – New Week Scenario on D1 Frame: Prioritise buying, the 3790 – 3720 zone decides the trend
Hello Trader,
Trading is a journey, and the most important destination is conquering oneself.
On the D1 frame, gold has experienced a series of consecutive strong increases, indicating that buyers still maintain the advantage. The buying force shows no clear signs of weakening, even though gold has recently reacted with a slight decrease around 3790. Currently, the price is accumulating around 3760 – the closing candle zone for this week.
Basic Outlook
Political pressure from President Trump on the Fed is increasing, as the market expects an easing move soon. However, Chairman Powell remains cautious, prioritising price stability over inflation issues.
This factor may continue to keep gold in the position of an important safe-haven asset, especially in the context of policy uncertainty.
Technical Outlook
The price zone of 3790 – 3720 will play a decisive role in the medium-term trend for next week.
If 3790 is broken, gold will have the opportunity to advance to the Fibonacci Extension zone of 3822. Further, strong resistance lies around 3840 – 3860.
If 3720 is breached, selling pressure will retest the strategic support zone at 3650. This is also the confluence area with the upward trendline on D1.
MACD Indicator: continues to support buyers, the histogram remains positive, not showing a clear decrease signal.
Volume: no significant selling pressure has appeared, indicating that gold is entering an accumulation phase, waiting for a breakout.
Trading Scenario for Next Week
Buying Scenario (priority):
Buy around 3650 – 3660 (if there is an adjustment).
SL: below 3640.
TP: 3720 – 3790 – 3822.
Selling Scenario at Resistance:
Sell around 3822 – 3830 (Fibo + strong resistance).
SL: above 3840.
TP: 3790 – 3760 – 3720.
Conclusion
In the medium term, the upward trend still prevails. Next week, gold will revolve around the 3790 – 3720 mark, and reactions here will pave the way for the next trend. The priority strategy is to buy at the support zone of 3650, while observing reactions at 3822 to consider short-term selling orders.
Short-term scenarios will be updated during the day, helping you be more proactive with market fluctuations.
Follow me and the community to update the earliest scenarios

EURUSD – Bearish Channel Continuation on H1EURUSD – Bearish Channel Continuation on H1
Market Overview
EURUSD continues to move steadily within a descending channel, confirming a bearish market structure. Recent recovery attempts have been capped at supply zones, while liquidity remains concentrated at lower price levels. As long as the pair trades inside this channel, the preferred strategy is to look for selling opportunities.
Technical Context
The bearish channel remains intact, with strong seller defence in the 1.1720–1.1790 zone.
Key resistance levels: 1.1753 and 1.1820. Only a clear break above 1.1820 would weaken the bearish scenario.
Downside liquidity targets sit around 1.1630, with extended potential toward 1.1575 if selling pressure accelerates.
Trading Scenarios
🔻 Priority – Sell Setups (with the channel trend)
Sell Setup 1
Entry: 1.1720 – 1.1730
Stop Loss: 1.1750
Take Profit: 1.1695 – 1.1670 – 1.1652 – 1.1630
Sell Setup 2
Entry: 1.1780 – 1.1790
Stop Loss: 1.1810
Take Profit: 1.1755 – 1.1730 – 1.1700 – 1.1675
🔹 Alternative – Buy Setup (countertrend, lower probability)
Buy Setup
Entry: 1.1630 – 1.1620
Stop Loss: 1.1600
Take Profit: 1.1660 – 1.1680 – 1.1700
Note: This setup is only valid if price tests the demand zone around 1.1620–1.1630, which could trigger a short-term corrective bounce.
Risk Management & Outlook
Primary Bias: Stay bearish while price action remains within the channel.
Invalidation: A confirmed H1/H4 close above 1.1820 invalidates the bearish view.
Target: A decisive breakdown below 1.1630 could pave the way towards 1.1575.
✅ Conclusion:
EURUSD remains in a clear downtrend. The main strategy is to sell rallies into resistance zones, targeting lower liquidity areas. Long positions can be considered only at strong demand levels, and should be treated as short-term corrective trades rather than a trend reversal.

AUDNZD Trading Idea – Momentum & Liquidity OutlookThe pair has been in a clear expansion phase, showing strength after multiple structure breaks. Momentum has favored the upside, while recent consolidation reflects market participants taking profits and rebalancing orders.
A corrective wave appears to be unfolding, which is typical after strong impulsive moves. Such phases often allow liquidity collection before the next directional expansion. The broader sentiment suggests that buyers are still active, but short-term volatility may create temporary pullbacks.
Educational Note: Markets move in cycles of impulse and correction. Recognizing these phases helps traders avoid chasing moves and instead prepare for continuation opportunities once the correction stabilizes.

LiamTrading – Gold may fake a move before dropping
Gold is trading around the 375x region and might exhibit a "fake breakout" upwards before adjusting downwards. The price structure on the H4 chart shows:
Strong resistance is located at the 3770–3773 region, coinciding with the 0.786 – 1.0 Fibonacci extension area. This is a confluence zone prone to a downward reaction.
The main trendline remains upward, but the RSI is gradually weakening, indicating that the buying force is not as strong.
Short-term support is at 3710–3713, also the 0.5 – 0.618 fibo zone, suitable for buy scalping orders.
A larger support area is at 3688–3691, where it converges with the trendline bottom and important Fibonacci, considered a sustainable "buy zone."
Trading Plan Reference
Sell: 3770 – 3773, SL 3778, TP 3756 – 3743 – 3725 – 3710
Buy scalping: 3710 – 3713, SL 3705, TP 3725 – 3736 – 3748 – 3760
Buy zone: 3688 – 3691, SL 3684, TP 3699 – 3710 – 3725 – 3736 – 3745 – 3760
In summary, gold may create a false upward move to the resistance zone 3770–3773 before reversing to adjust. Traders should patiently wait for confirmation signals at key price zones to enter optimal orders and manage risks tightly.
This is my personal view on XAUUSD. If you find it useful, follow for the fastest updates on upcoming scenarios, continuously updated at comulity

LiamTrading XAUUSD Scenario Today Fibo & Volume Profile AnalysisLiamTrading XAUUSD Scenario Today:Fibo & Volume Profile Analysis
Gold, after testing the 375x zone, has shown clear signs of weakening. On the H1 chart, the price structure is forming an adjustment phase aligning with key Fibonacci and Volume Profile levels. This is the time when the market starts to “filter” liquidity, creating opportunities for both short sell orders and buy orders at strong support zones.
Technical Analysis
Fibonacci indicates the 0.786 – 1.0 zone around 3756–3758 coincides with strong resistance and FVG, with a high potential for a reversal.
Volume Profile points out the POC area around 3735–3740, if breached, it will pave the way for deeper downward pressure.
The confluence support zone of 0.618 fibo + large volume around 3688–3691 is suitable for scalping buy.
Further, the area 3648–3651 is reinforced by VAL and the bottom of the volume profile, making it a strong long-term “Buy zone.”
Trading Plan Reference
Sell zone: 3756 – 3758, SL 3763, TP 3750 – 3748 – 3736 – 3710 – 3690 – 3655
Buy scalping: 3688 – 3691, SL 3685, TP 3701 – 3715 – 3728
Long-term Buy zone: 3648 – 3651, SL 3640, TP 3670 – 3688 – 3700 – 3718 – 3733 – 3755
In summary, gold is moving in accordance with the technical structure confirmed by Fibonacci and Volume Profile. Today's scenario prioritises observing reactions around the sell zone 3756–3758 to find short opportunities, and waiting to buy at value zones 369x and 365x for the recovery wave.
This is my personal view on XAUUSD. If you want the fastest updates on the next gold scenarios, follow me and join the community to stay informed.

XAUUSD – Wolfe Waves continue on H4XAUUSD – Wolfe Waves continue on H4, price returns below trendline: prioritise correction scenario
Hello Trader,
Based on the Wolfe Waves structure on the H4 frame and current price behaviour, gold has returned to trading below the trendline, indicating a weakening short-term uptrend and paving the way for a downward correction before the market decides the next trend. The upper zone has created a clear “sell zone”; below, two defensive buy zones appear suitable for both scalping and medium-term.
Main Technical Picture
Wolfe Waves: wave 5 completes near resistance, then price falls back below the trendline — aligning with the correction scenario along Wolfe's target line 1–4.
Trendline & price box zone: the close below the rising trendline indicates “acceptance” below; immediate resistance lies at the 375x–376x cluster (sell zone).
Momentum: H4 MACD slows, histogram narrows → high probability of a pullback – retest before a new decision.
Detailed Trading Scenarios
1) Sell according to correction trend (priority)
Entry: 3756 – 3759
SL: 3764
TP: 3745 → 3732 → 3715 → 3690 → 3672
Reason: the 375x zone coincides with the sell zone + upper trendline; selling at retest offers a good R:R ratio.
Confirmation/Negation: if H4 closes above 3764 and holds, the short-term sell scenario weakens.
2) Buy scalping in buffer zone
Entry: 3701 – 3703
SL: 3695
TP: 3715 → 3732 → 3745 → 3766
Note: this is just a rebound in the correction phase; lock each step and move SL according to TP1.
3) Buy medium-term (strong base zone)
Entry: 3648 – 3651
SL: 3644
TP: 3672 → 3698 → 3708 → 3722 – 3727
Reason: the 365x zone coincides with the demand/accumulation volume on H4; suitable for catching a deep rebound along with the larger trend.
Management: this is a medium-term order, so divide volume, lock each step and move SL to breakeven after TP1.
Refer to my scenario if you find it reasonable, trade accordingly, and if you enjoy trading gold with high-quality scenarios, follow me.

XAUUSD – The downward trend continues to be prioritisedThe downward trend continues to be prioritised (Wolfe Waves Pattern H4)
Hello Trader,
Gold is following the Wolfe Waves structure on the H4 chart, after bouncing off the upper resistance zone and returning below the trendline. This indicates that the short-term upward momentum has weakened, and the scenario of a downward adjustment continues to be prioritised at this stage.
Technical Analysis
Wolfe Waves are clearly formed, wave 5 has hit resistance and a reversal signal has appeared.
The price failed to hold above the upper trendline, while the MACD shows weakening upward momentum.
The 3746 – 3748 zone is considered the main “sell zone” in the short term.
Nearby support zones: 3709 – 3711 and deeper at 3675 – 3678. Further, the area around 3650 is an important “buy zone” in the medium term.
Trading Scenario
Sell following the trend (priority)
Entry: 3746 – 3748
SL: 3754
TP: 3733 → 3720 → 3702 → 3690
Buy Short-term Scalping
Entry: 3709 – 3711
SL: 3705
TP: 3722 → 3730 → 3745
Buy Deep Support Scalping
Entry: 3675 – 3678
SL: 3670
TP: 3688 → 3696 → 3710 → 3725
Medium-term Buy Zone
Entry: around 3650
This is a high-volume accumulation zone, coinciding with strong support on H4. This area is suitable for considering medium-term buy orders if the price adjusts deeply.
Conclusion
In the short term, the bearish scenario continues to be prioritised, especially when the price remains below the 3748 zone.
Buy strategies should only be considered in the form of scalping or at the important buy zone around 3650.
The current gold market is still in a distribution phase, so patience is needed to observe candle confirmations at entry zones to optimise the R:R ratio.
This is today's XAUUSD trading scenario according to Wolfe Waves on H4. You can refer to and combine with personal strategies for the best risk management.
Follow me to receive the latest scenarios when the price structure changes.

XAUUSD Facing Downward PressureHello traders, XAUUSD is currently facing downward pressure following recent economic news. The lower-than-expected unemployment claims data suggests economic stability, reducing the demand for gold. The higher-than-expected PCE core index increases the likelihood that the Fed will maintain high interest rates, putting pressure on gold prices. While the US GDP remains stable , there is no strong breakthrough.
Technically, XAUUSD is in an uptrend but has encountered resistance at $3,790 . The price of gold is currently testing support at $3,700. If this level is broken, gold could fall to the $3,635 region.
Given the current fundamental and technical factors , the likelihood of XAUUSD continuing to decline is high. If support doesn't hold, gold could continue to drop.
Wishing you successful trading!

GBPUSD – Medium-Term H1/H4 Technical Outlook
Overview: GBPUSD has recently broken below its ascending trendline/channel after failing to sustain momentum near the 1.3530–1.3575 supply zone. At present, price is testing the 0.618 retracement (~1.3366), while the RSI (5) is heavily oversold (~13–14). This signals the possibility of a short-term bounce before the broader bearish bias resumes.
For Indian traders who follow GBPUSD closely, the focus should remain on selling rallies into resistance while being open to buying intraday dips at clearly defined liquidity levels.
Market Structure & Key Observations
Trendline Break: The bullish channel has been violated, shifting momentum to a “sell-the-rally” strategy.
Resistance Zones: 1.3537 and 1.3453–1.3428 (strong supply levels).
Support Zones: Initial support at 1.3366 (Fib 0.618) and 1.3319; major demand lies at 1.3143–1.3093.
Momentum Check: Deep oversold RSI could trigger corrective recoveries, making intraday scalps attractive.
Trading Plan
Sell the Rally – Primary Bias
Entry: 1.3500 – 1.3510
Stop Loss: 1.3550
Take Profit: 1.3480 – 1.3466 – 1.3445 – 1.3430
📌 Idea: Short entries on retest of broken structure. Only invalid if we see a 4H close above 1.3550.
Buy the Dip – Intraday Scalping
Entry: 1.3310 – 1.3330
Stop Loss: 1.3290
Take Profit: 1.3355 – 1.3368 – 1.3390 – 1.3410
📌 Idea: Quick long trades from liquidity near 1.3319, targeting minor resistance.
Buy Deeper Liquidity Sweep – Swing Setup
Entry: 1.3090 – 1.3110
Stop Loss: 1.3050
Take Profit: 1.3135 – 1.3160 – 1.3200 – 1.3240
📌 Idea: If the market flushes into the 1.3143–1.3093 demand zone, expect stronger bounce potential.
Risk Management & Invalidation
Above 1.3550 (4H close) → Bearish bias invalidated.
Strong breakdown below 1.3310 → Skip scalps, focus on deeper buy zones.
Partial profit booking at each target is recommended to protect capital.

LiamTrading – XAUUSD IN-DEPTH ANALYSIS OF CURRENT TRENDLiamTrading – XAUUSD Scenario Today: Opportunities at Key Price Levels
Gold continues its strong upward momentum, currently fluctuating around the 376x–377x range after a series of breakthroughs. The technical structure on the H1 chart shows the market is forming clear resistance and support zones, suitable for short-term trading plans.
Technical Analysis
RSI is cooling off from high levels, indicating the possibility of a short-term correction.
The upper price range around 3818–3821 is a strong confluence of resistance, coinciding with wave peaks and Fibonacci extensions, making it prone to selling reactions.
Conversely, the support zones at 373x and 370x exhibit dense liquidity, serving as potential buying points when prices adjust.
The short-term Dow structure still leans towards an uptrend, but attention is needed for the sell confirmation zone if gold fails at the peak.
Reference Trading Plan
Sell Zone: 3818 – 3821, SL 3828, TP 3805 – 3785 – 3760 – 3732 – 3650
Buy Scalping: 3728 – 3731, SL 3723, TP 3750 – 3777 – 3790
Buy Zone: 3706 – 3709, SL 3700, TP 3725 – 3738 – 3750 – 3777 – 3790
In summary, the main trend still leans towards an increase, but with gold approaching strong resistance zones, the likelihood of a correction is very high. Traders need to patiently wait for reactions at the marked zones for optimal entries, while managing risk tightly.
This is my personal view on XAUUSD. If you're interested in gold scenarios, follow me for the fastest updates.

Gold Finds Support at R1 , buy the Dip stills looks good We have seen a solid pullback (of over 72 points from the highs) in yesterday’s session, yet the broader structure on the H4 and higher timeframes remains firmly bullish, maintaining its HH-HL pattern. Price has so far rejected the 3720 zone (Weekly R1), confirming it as near-term support, and is now retesting the immediate resistance at 3750 along with the descending trendline overhead.
As long as gold holds above the PWH / 3700–3680 demand zone, this looks like a healthy consolidation rather than a trend reversal. A sustained breakout above 3750 and the descending trendline could trigger momentum toward the 3790–3800 zone once again.
For the short- to mid-term outlook, buying dips remains the preferred strategy, with invalidation coming only on a clean breakdown and H4 close below 3700 with strong volume.

Gold Neowave UpdateFX:XAUUSD Namaskaram Everyone
Welcome to intelligent investor, we provide market insights by synchronising and combining all the price action waves from different time frames and gives you single trend.
GOLD & BTCUSD Video Analysis
How To Read My Charts...Click Below

Gold & BitCoin (Neowave Forecast)Namaskaram Everyone
Welcome to intelligent investor, we provide market insights by synchronising and combining all the price action waves from different time frames and gives you single trend.
How To Read My Charts...Click Below

Gold Soars: Will a Weak USD Open the Door for New Highs?Hello traders, it’s clear that gold is rising sharply, supported by the weakening of the USD. Can gold continue to conquer new highs?
On the chart, the price is moving within a clear upward channel. The key support level at 3,750,000 has been tested multiple times, and if the price holds above this level, gold could continue rising towards 3,827,000. The areas near recent highs also show an increase in trading volume, reinforcing the bullish trend.
Forecasts indicate that the U.S. labor market is slowing down, with 233K jobs created, slightly higher than the previous 231K. This weakens the USD, creating an opportunity for gold to continue its rise, as gold typically benefits from a weaker USD.
With strong technicals and a weakening USD, XAU/USD could continue its upward momentum. Get ready for some exciting opportunities!

LiamTrading – XAUUSD H1LiamTrading – XAUUSD H1: Adjustment structure formed, awaiting confirmation below 3685
After the surge to 375x, gold is entering a correction phase in line with the structural pattern. On H1, the price clings to the upper edge of the rising wedge, with RSI cooling off from overbought levels, indicating that supply pressure is starting to dominate. Today's plan focuses on the adjustment structure, prioritising selling upon confirmation signals.
Key price zones (as per the attached chart)
Sell strong resistance 3775–3785: confluence of channel top + 2.618 extension. Look for weakening reactions to initiate short/medium-term sell orders.
Buy zone volume 3726–3720: a thin support area providing momentum for a rebound. Holding this zone could push the price to retest 3750–3775; conversely, losing 3720 may lead to a deeper decline.
Resistance + FVG 3715–3698: as the price drops, this area turns into supply; a failed retest here is an early signal for further decline.
Confirm sell 3688–3685: closing H1 below this zone confirms a short-term downtrend, targeting a lower buy zone.
BuyZone 3652–3646: confluence of channel bottom + old liquidity, expecting a strong bullish reaction if revisited.
Reference trading scenarios (adhering to risk management)
Sell reaction at peak: 3778–3783, SL 3792, TP 3755 → 3738 → 3722.
Sell on confirmation: wait for H1 to close below 3685, enter sell 3684–3682, SL 3696, TP 3673 → 3656 → 3648.
Buy scalp by volume: 3726–3720, SL 3715, TP 3738 → 3750 (only short-term if the larger structure remains corrective).
Buy swing at strong zone: 3652–3646, SL 3639, TP 3673 → 3698 → 3712 → 3740.
Operational notes
Prioritise waiting for rejection/closing signals at the mentioned zones; avoid chasing orders in between.
Order volume should be allocated according to confirmation levels (confirmation zone < breakdown < failed retest).
Avoid excessive leverage; adjust SL according to structure when in profit.
This is a personal perspective, not an investment recommendation. If you want the quickest updates on the next XAUUSD scenarios, follow me and join my community for discussions.
