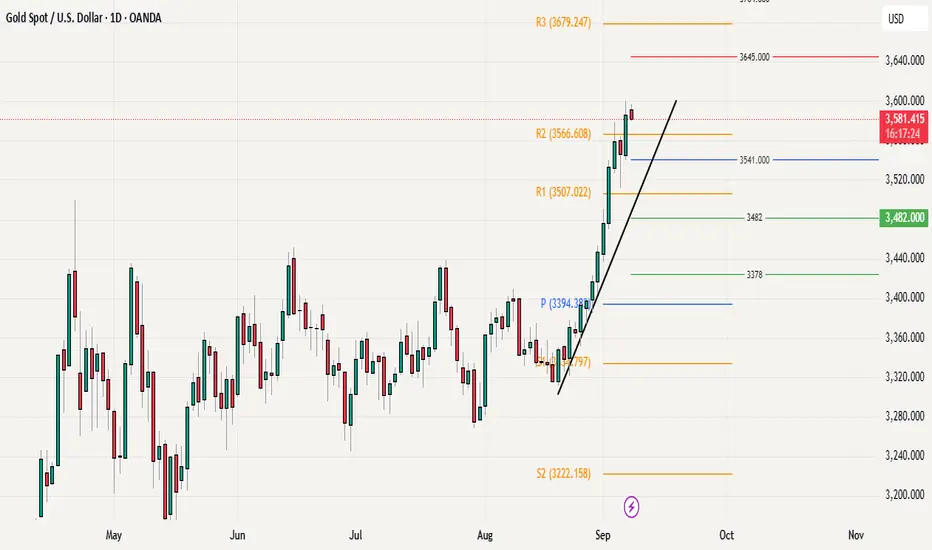
Gold Marks New ATH at 3600 – Bulls Still in ControlGold closed last week on a very strong note, posting its highest daily and weekly close and also printing a new all-time high at 3600, which now stands as an important psychological resistance Level. The overall price action structure continues to favor the bulls, with no major signs of reversal visible on any time frame.
For this week, the weekly pivot at 3541 will be going to act as the first line of support, followed by the previous ATH at 3500 as the secondary and more critical level to hold. While some consolidation or pullback from current levels cannot be ruled out given the stretched rally and overbought conditions (daily,H4) these dips can be viewed as healthy rather than bearish. As long as gold holds above 3500 on a closing basis, the broader trend remains bullish, and any corrective moves are likely to attract buying interest.
In short, unless bears can force a decisive break below 3500 (Daily close or week), gold bullish momentum remains intact, with scope for continuation above 3600 once consolidation is done.
Forex
Gold Trading Strategy XAUUSD September 5, 2025Gold Trading Strategy XAUUSD September 5, 2025: Gold rebounds after correction, market eyes on NFP data and Donald Trump's surprise statement for the week.
Fundamentals: Spot gold prices experienced extreme volatility on Thursday, with intraday swings reaching $53 before closing lower, currently trading at $3,557/oz, representing a gain of about $11 on the day. Gold's slight decline also reflects traders taking profits from the recent incredible rally. Investor focus now shifts to today's Non-Farm Payrolls report, which is expected to provide clues on the Federal Reserve's policy direction.
Technical analysis: Yesterday's strong decline showed investors' short-term profit-taking, but the current gold price is still trading above 3500. We continue to trade according to the main trend, waiting for support areas for long-term trading.
Important price zones today: 3525 - 3520 and 3495- 3500.
Today's trading trend: BUY.
Recommended orders:
Plan 1: BUY XAUUSD zone 3515 - 3517
SL 3512
TP 3520 - 3530 - 3550 - 3580.
Plan 2: BUY XAUUSD zone 3498 - 3500
SL 3495
TP 3503 - 3513 - 3530 - 3550.
Wishing you a safe, effective and profitable weekend trading day.🥰🥰🥰🥰🥰

Gold (XAUUSD) forming wonderful sell scenarioGoldUSD price is moving at higher side and showing weakness. It is also forming double top kind of scenario. We may see a good short trade if liquidity sweep is witness at the resistance level with the additional confirmation of higher volume. Overall trend is still upside but buyers seems exhausted. We may find a good sell trade if Liquidity sweeps at resistance and everything goes as we planned.
1. Price is approaching 4H resistance zone. Which may act as a strong supply zone.
2. Buying is slow and weak.
3. Most probably price will take liquidity of resistance zone and break trend line.
4. After breaking trend line it should pullback till resistance/trend line or any newly created OB/FVG.
All these combinations are signalling a high probability and high Risk and Reward (1:8) trade scenario.
Note – if you liked this analysis, please boost the idea so that other can also get benefit of it. Also follow me for notification for incoming ideas.
Also Feel free to comment if you have any input to share.
Disclaimer – This analysis is just for education purpose not any trading suggestion. Please take the trade at your own risk and with the discussion with your financial advisor.

Gold Trading Strategy XAUUSD September 4, 2025Gold Trading Strategy XAUUSD September 4, 2025: New all-time high of $3,578, gold eases to $3,536/oz as US ADP data takes center stage.
Fundamentals: Spot gold hit a record high on Wednesday as weaker-than-expected US jobs data weighed on the US dollar. Gold bulls are betting on further gains. The US Department of Labor's Bureau of Labor Statistics released its Job Openings and Labor Turnover Survey (JOLTS) report on Wednesday, showing that job vacancies, an indicator of labor demand, fell by 176,000 to 7.181 million on the last day of July. Economists surveyed by Reuters had previously forecast the number of vacant jobs in the United States at 7.378 million in July.
Technical analysis: After creating the latest ATH of 3578, the gold price corrected strongly to the 3511 area and then continued to increase; this can be considered a short-term profit-taking wave of the gold price. However, the selling pressure is still not strong. The multi-frame RSI is in the overbought area and shows signs of entering the buying zone. We continue to wait at the support areas combined with MA, Fib and FVG zones.
Important price zones today: 3495 - 3500 and 3475 - 3480.
Today's trading trend: BUY.
Recommended order:
Plan 1: BUY XAUUSD zone 3495 - 3497
SL 3492
TP 3500 - 3510 - 3530 - 3550 - OPEN.
Plan 2: BUY XAUUSD zone 3475 - 3477
SL 3472
TP 3480 - 3490 - 3520 - 3550 - OPEN.
Plan 3: SELL XAUUSD zone 3549 - 3551
SL 3554
TP 3546 - 3536 - 3516 - 3500. (small volume, effective before US session).
Wish you a safe, effective and profitable trading day.🌟🌟🌟🌟🌟

XAUUSD – Gold Stalls as USD Regains StrengthThe ISM Services PMI was reported at 50.9, higher than the previous 50.1 and still above the 50 threshold – indicating that the U.S. services sector remains in expansion. This is a sign that the U.S. economy is still resilient, and the USD immediately benefited. With a stronger dollar, it’s natural for gold to come under corrective pressure.
On the 8H chart, after a sharp rally, XAUUSD was capped at the 3,579 USD resistance . From there, price showed a reversal signal and started to retreat. The nearest support lies around 3,465 USD, and if this level is broken, the probability of a deeper decline increases significantly – especially as the fundamentals continue to favor the greenback.
In the short term , I favor a bearish scenario: sell while price stays below 3,579, targeting 3,465. Only a clear close above 3,579 would bring the bullish outlook back, but for now, gold looks set for a correction.

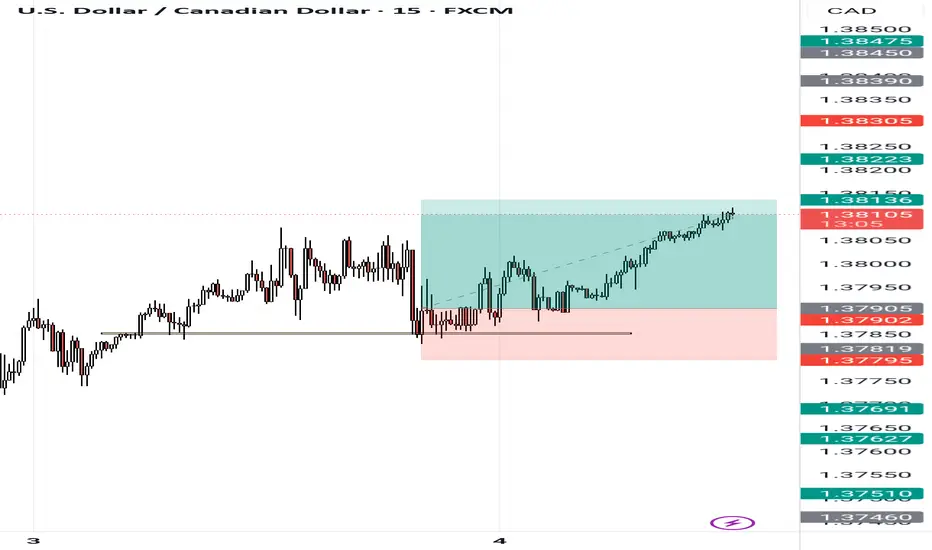
BreakOut Retest Strategy Price came back to a fresh supply zone.
First candle went bullish, second candle (50% wick / 50% body) showed rejection + sellers entering.
You entered sell after confirmation.
Stop above zone, TP far below → 1:8 RR achieved.
Key: fresh zone + rejection + patience → high probability trade.
Healthy Pause in Gold’s Rally, Bulls Still in ControlGold has finally started to show a healthy daily correction after its sharp rally and breakout above 3500. This pullback was not unexpected, as intraday charts were looking overstretched in the last sessions. Despite today’s dip, the broader structure remains strong with momentum still favoring the upside as long as key supports hold. For the short term, 3500 (previous high) will be the immediate level to watch, followed by 3450 as secondary support. Holding above these levels will keep the bullish trend intact, and any stabilization here can set the stage for another leg higher. Overall, the correction looks more like a consolidation phase rather than a reversal, keeping the bigger picture positive.

Breakout ReTest StrategyI see my GBPUSD short setup with the supply zone marked and stop-loss above the rejection area.
👉 A few thoughts on this trade:
I respected my zone + rejection entry rule (good).
Strong bearish impulse followed after my entry, so the idea was correct.
The sharp drop suggests momentum was in my favor, likely news-driven or liquidity sweep.
My stop placement looks safe above structure (not too tight).
✅ This looks like an A+ setup execution — clean zone, rejection confirmation, and follow-through.

Bullish trend intact, waiting for PMI to spark the next waveCaptain Vincent – Gold Plan XAU/USD
1. Market Waves 🌍
The USD continues to weaken as investors grow more confident that the FED will cut rates in the coming months. With the greenback losing appeal, large flows are leaving cash and moving into safe-haven assets → gold stands out as the number one choice .
👉 This supports gold’s sustainable bullish trend . If USD selling pressure persists, the market could see fresh breakouts into year-end.
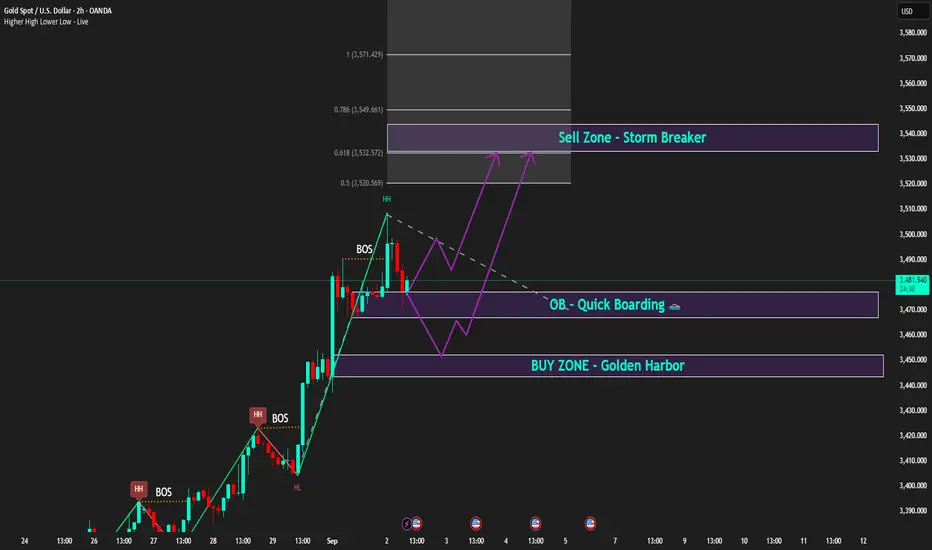
2. Technical Outlook ⚙️
H2 Chart: gold just created a Higher High after BOS , confirming bullish dominance.
Golden Harbor 🏝️ (Buy Zone 3,450 – 3,452): aligned with previous FVG , heavy liquidity zone.
Quick Boarding 🚤 (OB ~3,470): intermediate support, ideal for quick pullback entries.
Storm Breaker 🌊 (Sell Zone 3,538 – 3,540): resistance at Fibo 0.618 – 0.786 , strong chance of profit-taking if tested.
Intraday bias: Wait for pullback to Buy. Short-term Sell only if price hits Storm Breaker.
3. Captain Vincent’s Map – Key Levels 🪙
Golden Harbor 🏝️ (Buy Zone): 3,450 – 3,452
Quick Boarding 🚤 (OB Support): 3,470
Storm Breaker 🌊 (Sell Zone): 3,538 – 3,540
4. Trade Scenarios 📌
🔺 Golden Harbor 🏝️ (BUY – Priority)
Entry: 3,450 – 3,452
SL: 3,444
TP: 3,455 → 3,458 → 3,462 → 3,465 → 34xx
🔻 Storm Breaker 🌊 (SELL Reaction)
Entry: 3,538 – 3,540
SL: 3,548
TP: 3,535 → 3,532 → 3,529 → 35xx
5. Captain’s Note ⚓
“The gold sail is still filled with bullish wind, but Storm Breaker 🌊 above may create counter waves. Stay patient at Golden Harbor 🏝️ for precise entries, and watch the PMI at 21:00 – the catalyst for the next wave.”
High probability 1:7 Gold buy scenario.Gold is developing nice scenario for upside move. Currently it is under consolidation. We are expecting manipulation toward FVG (1 and 15m overlapping) and then upward movement after liquidity sweep. Below is detail
1. Price has created Break of Structure.
2. Displacement happened, which created FVGs in 5 and 15m overlapping.
3. FVGs are formed in Discount and OTE zone.
4. FVGs are overlapping BB on 5m.
5. HTF bias is also upside.
All these combinations are signalling a high probability and high Risk and Reward (1:7) trade scenario.
Note – if you liked this analysis, please boost the idea so that other can also get benefit of it. Also follow me for notification for incoming ideas.
Also Feel free to comment if you have any input to share.
Disclaimer – This analysis is just for education purpose not any trading suggestion. Please take the trade at your own risk and with the discussion with your financial advisor.

All-Time High Achieved: Can Gold Hold Above 3500?Gold has successfully tested the 3500 level, printing a fresh all-time high, and momentum remains strong. However, looking at the H4 chart, price action appears slightly stretched, hinting at the possibility of a short-term pullback. A retest toward the previous month’s high / previous week’s high zone (around 3450–3460) cannot be ruled out, and that level will be key to watch for a bullish bounce. As long as gold manages to hold above the 3400 daily close support, any retracement can be seen as a healthy dip-buying opportunity within the broader bullish trend. For now, 3500 stands as immediate resistance, while 3450 is short-term support, and 3400 remains a major level to defend. A sustained daily close above 3500 will open the door for further upside continuation and fresh breakout territory.

XAU USD 1 HRS BULLISH CHART Xau USD given a very decent move in last some days from 3383 to 3480 , There is Round number Resistance near 3500 if crossed 3500 with volume or Bullish Candle then Rally can continue. Otherwise there may be some retracement up to 3350-55. Be Cautious & careful. But Still it's bullish . Any Retracement will be Good opportunity.

Xau USD Bullish Structure Xau USD is making Higher High pattern . From 3325 it's moving upward with Higher High pattern . It's moving up . From here I m seeing again 10 -15 point movement . It's bullish Structure at higher level . We can wait for retracement if you are safe player. Consult your financial advisor before making any position in stock market.

1:7 RnR trade opportunity on GBPCADGBPCAD is forming a great price action and scenario. Which may lead to high risk and reward trade. Below are the signals noticed ...
1. Price has broken 10 days’ consolidation of trend line and nearby resistance as well.
2. Created BOS and FVG on 1-hour time frame in discount area.
3. Price is running above VWAP and 21 EMA. And 21 EMA crossing over VWAP.
4. Now we can expect a pullback till FVG area.
All these combinations are signalling a high probability and high RnR (1:7) trade scenario.
Note – if liked this analysis, please boost the idea so that other can also get benefit of it. Also follow me for notification for incoming ideas.
Disclaimer – This analysis is just for education purpose not any trading suggestion. Please take the trade at your own risk and with the discussion with your financial advisor.

XAUUSD Gold Trading Strategy September 1, 2025XAUUSD Gold Trading Strategy September 1, 2025: Gold reversed its decline and surged to its weekly target, boosted by U.S. PCE data and concerns about Fed independence.
Fundamentals: Gold prices reversed course in the U.S. trading session last week, erasing all losses and rising to a new high. After the US Personal Consumption Expenditures (PCE) inflation report largely met expectations, the precious metal traded near $3,454, its highest level since June 16. The weakening dollar supported gold prices, while traders continued to bet on the Federal Reserve's monetary easing measures in September.
Technical analysis: Gold prices, after breaking the 3,420 - 3,425 area, rose sharply to the 3,485 area and are heading towards the old ATH area of 3,500. We will now trade in an uptrend, waiting for a trading point at the combined support zones of MA, Fib and FVG.
Important price zones today: 3,420 - 3,425 and 3,445 - 3,450.
Today's trading trend: BUY.
Recommended orders:
Plan 1: BUY XAUUSD zone 3445 - 3447
SL 3442
TP 3450 - 3460 - 3480 - 3500.
Plan 2: BUY XAUUSD zone 3420 - 3422
SL 3417
TP 3425 - 3435 - 3455 - 3500.
Wish you a new week of safe, effective trading and lots of profit.🌟🌟🌟🌟🌟

EURUSD – Wave 5 Long SetupIdea: EURUSD has completed a clean Elliott Wave (1-2-3-4) structure on the 1H chart and is now setting up for the final Wave (5) push to the upside. Price has broken above short-term resistance and is aiming for the next liquidity zone.
🔹 Entry: 1.16609
🔹 Target: 1.17015 🎯
🔹 Stop Loss: 1.16271 ❌
✅ Reasons for Long Bias:
Clear Elliott Wave progression with Wave 5 in play.
Strong recovery from Wave 4 support zone.
Next resistance aligns with Wave 5 target around 1.1700 psychological level.
Favorable R:R ratio, keeping risk well defined.
⚠️ Risk Management: Always trade with position sizing that suits your account. Stop loss is placed below Wave 4 to protect from invalidation.
📌 Disclaimer
This is purely for educational purposes and not financial advice. Please do your own research before entering any trades.

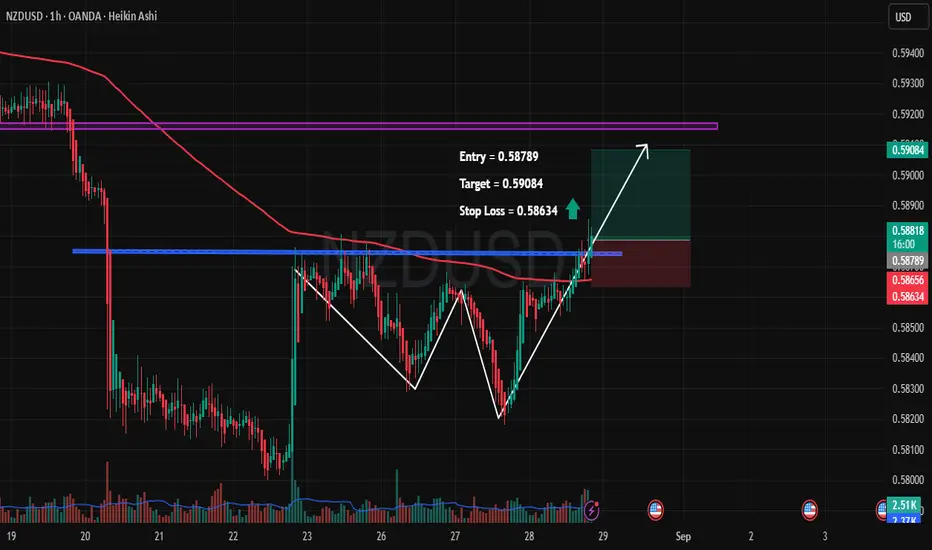
NZDUSD – Breakout Confirmation with Upside Potential🔹 Pair: NZDUSD (1H, Heikin Ashi)
🔹 Entry: 0.58789
🔹 Target: 0.59084 🎯
🔹 Stop Loss: 0.58634 🛑
🔑 Trade Rationale:
✅ Double Bottom Formation – Price respected key support twice, signaling potential reversal.
✅ Breakout Above Resistance – Clean breakout above horizontal resistance (blue line).
✅ 200 EMA Retest – Price is now pushing above the EMA, adding strength to the bullish case.
✅ Volume Spike – Recent surge in buying volume supports the upside move.
📊 Trade Plan:
I’m going long from 0.58789, looking for a quick move toward 0.59084. Risk is limited with a tight SL at 0.58634.
This setup offers a favorable R:R with a technical confluence of breakout + pattern confirmation.
⚠️ Disclaimer: This is not financial advice. Trade at your own risk. Always use proper risk management.
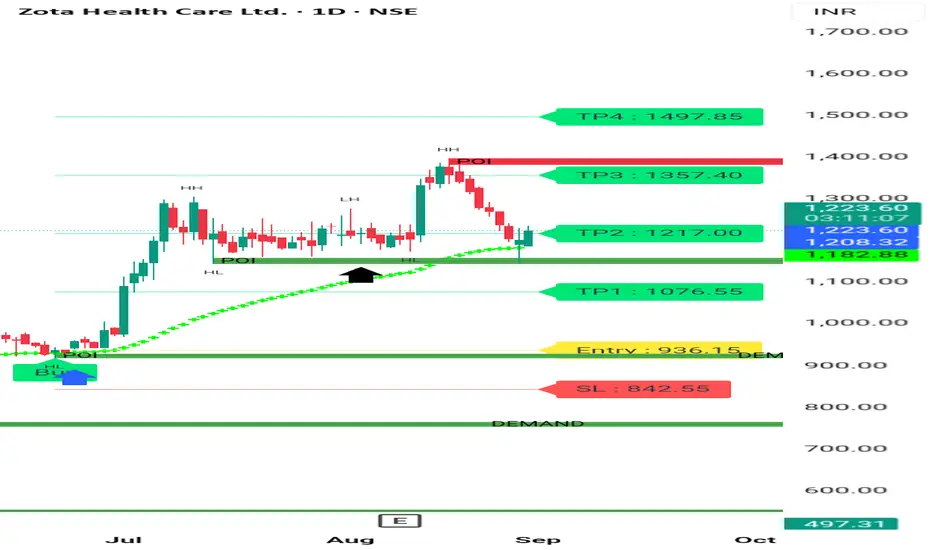
ZOTA HEALTHCARE BULLISH CHART Zota healthcare is good Growth company. It's a good buy at cmp for swing trading of 5%-6% profit. It's taking Reversal after Retracement. U can look into this. Thanks .
Consult your financial advisor before making any position in stock market.
Steady Climb: Gold Confirms Breakout, Support Shifts to 3400We have seen impressive strength on gold with a slow but steady breakout above 3400, confirming a bullish tone in the market. Price has also cleared the previous swing high near 3410, turning this zone into fresh support (3400–3410). Alongside this, the rising trendline support (black line) continues to guide the uptrend, adding confidence to the move.
From a price action perspective, this breakout looks healthy and signals that buyers are gaining control. The next big level to watch is the 3450 zone, which stands as the key breakout area for a larger move higher. On the flip side, as long as 3400–3410 holds, the bullish outlook remains intact.
With both the monthly and weekly closing happening today, the candle close will be crucial in setting the tone for the next leg. A strong close above 3410 would further validate the bullish breakout, while any failure to hold above support could bring some profit-taking. For now, the overall structure favors the bulls.

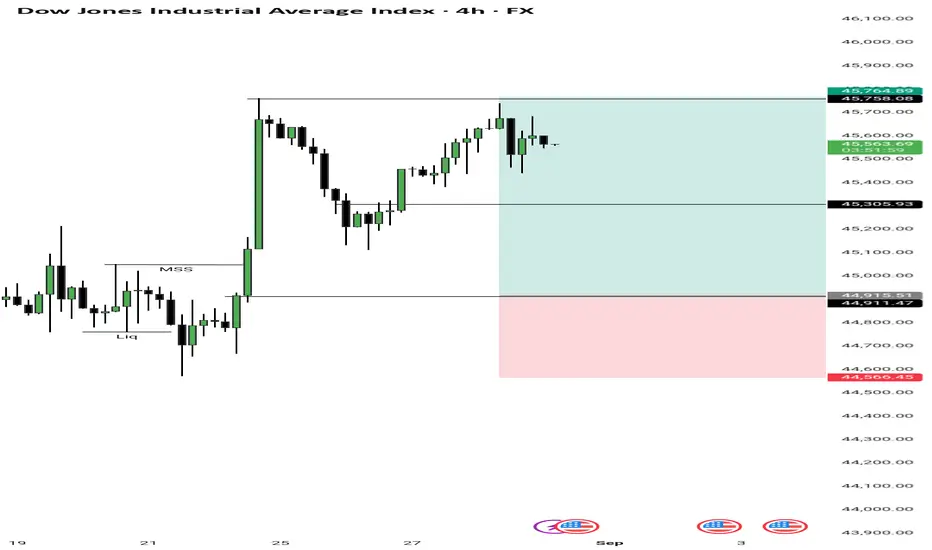
Dow Jones (DJI) – 4H Chart AnalysisMarket Structure:
Price grabbed liquidity (Liq) below recent lows.
A Market Structure Shift (MSS) occurred, confirming bullish intent.
Price rallied strongly after liquidity sweep, indicating smart money accumulation.
Entry Zone:
Entry placed near 45,305.93 (demand zone after MSS).
This aligns with bullish order block / demand zone where buyers previously stepped in.
Stop Loss:
SL at 44,566.45 (below liquidity sweep).
Protects against deeper liquidity hunts.
Target / Take Profit:
TP at 45,764.89 (recent swing high).
Clear liquidity resting above, providing a logical target.
Risk-to-Reward (RR):
Approx 1:2 RR (Risking ~740 points for a potential gain of ~460 points).
Good balance between safety and profitability.
XAUUSD: Maintaining Support, Gold Aims for New Highs!Based on the latest data and chart for XAUUSD, it can be seen that gold is in an uptrend after holding strong above the key support level at 3,373.70. The chart indicates that if gold maintains above this support zone, the next target will be 3,413.00, with the potential to continue rising higher if the current support area is not broken.
Technical Analysis: XAUUSD is currently trading near the support zone at 3,373.70 and resistance at 3,413.00. If the price remains above 3,373.70, the uptrend will continue with the target at 3,413.00. The nearest support levels are 3,373.70 and 3,362.00.
Fundamental Signals: Weaker economic data from the U.S., especially the higher-than-expected PCE index and lower-than-expected jobless claims, have increased expectations that the Fed will cut interest rates. This has put pressure on the USD and supported gold’s recovery.

Gold Holds Trendline All Eyes on 3400 & GDP DataGold continues to move higher , on H4 we can see that price respecting the rising trendline support that has been guiding the move since last week’s breakout. Yesterday, bulls made an attempt to push through the 3400 level, but failed to sustain above it, confirming this zone as the immediate resistance for now. On the downside, supports remain unchanged first at the previous week high (3378), followed by the weekly pivot (3353).
For today, the key focus will be on the GDP data release, which could trigger volatility and provide the needed catalyst for gold to either break above 3400–3410 resistance or slide back towards its support zones. Until then, price action suggests a slow but steady bullish bias, with sellers only likely to gain momentum if the trendline breaks decisively.

Bitcoin Bear OutlookHas the Bitcoin bull run ended? From my outlook, I see a strong push to the downside, followed by a potential retracement back up that could form a head-and-shoulders pattern, adding more confluence to my bearish view.
