Option TradingIndia’s financial markets are rapidly evolving, and the participation of retail investors, institutions, and foreign players has significantly increased over the past two decades. Among various investment avenues, option trading, equity investing, and gold trading have become the most prominent ways of wealth creation and hedging against risks. Each of these segments has its unique importance, strategies, and regulatory frameworks in India.
This guide will help you understand the core concepts, market structure, strategies, and risks associated with Indian Option Trading, Equity Investing, and Gold Trading in a simple and practical manner.
Forex

XAUUSD 23/06 – Bears Losing Steam as FVG Zone Returns to PlayXAUUSD – Gold Sets Up for a Strategic Bounce Amid Fed Dovish Shift and Yield Retreat
📊 MACRO & FUNDAMENTAL INSIGHTS – WEEK AHEAD
Gold enters the final week of June with renewed investor focus amid softening Fed rhetoric and weakening US Treasury yields. Here's what Indian traders need to watch:
🔻 Fed Signals & Rate Cut Bets Rising
Jerome Powell’s upcoming speech and comments from FOMC members will shape the tone. Market now prices in a 65% probability of a rate cut in September, according to CME FedWatch.
If Powell leans dovish, expect renewed demand for non-yielding assets like gold. Conversely, hawkish surprises may pressure prices downward.
📉 US Dollar and Bond Yields Losing Momentum
The US Dollar Index (DXY) is retreating after peaking, while 10-year yields hover near 4.23% but fail to break higher.
Weakening yields and profit-taking on the dollar strengthen the safe-haven narrative for gold, particularly attractive to Indian investors during times of global volatility.
🌍 Geopolitical Tensions & Capital Flow Rotation
Ongoing concerns in the Middle East, Ukraine, and Indo-Pacific increase gold’s appeal as a hedge.
Institutions have started rotating capital from equities to safe-haven assets. ETF inflows and central bank reserves—particularly from China and India—underline long-term accumulation.
🧠 TECHNICAL ANALYSIS – STRUCTURE & SENTIMENT
On the H1 chart, XAUUSD remains within a broader descending channel but has printed a potential reversal setup from the BUY ZONE (3327–3325).
The recent drop filled a Fair Value Gap (FVG), offering strong confluence support.
Price action shows early signs of accumulation with bullish divergence on RSI and price holding above the trendline support.
Immediate resistance is seen at 3355–3360, with stronger supply anticipated near the SELL ZONE (3398–3400), aligning with a high-timeframe trendline.
🎯 TRADING PLAN – UPDATED FOR SHORT/MEDIUM TERM
🔵 BUY ZONE: 3327 – 3325
SL: 3320
TP: 3330 → 3335 → 3340 → 3345 → 3350 → 3355 → 3360 → ???
This zone aligns with key structural support and the base of FVG. A break above 3360 may trigger acceleration toward 3375–3390.
🔴 SELL ZONE: 3398 – 3400
SL: 3405
TP: 3395 → 3390 → 3386 → 3380 → 3375 → 3370 → 3360
Ideal area to fade potential spikes driven by news or sentiment. Look for rejection wicks or RSI divergence before entering.
⚖️ STRATEGY OUTLOOK
With central banks tilting toward easing, gold may reclaim dominance as a macro hedge. India’s gold imports are expected to increase if prices consolidate below 3350. Patience and discipline around key zones are critical—let price validate direction.

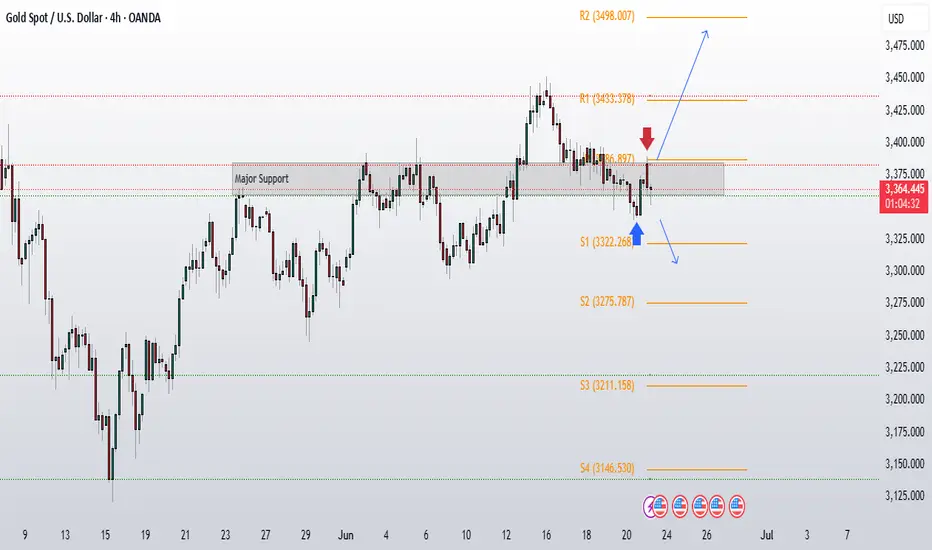
Gold Gap Up But Range Remains IntactThe price is still facing resistance at that key 3385 level we talked about in our weekly analysis video. This 3385 level is our monthly pivot (marked with the red arrow), and it's crucial for the gold bulls to not just break above this level but also sustain above it. Only then can we expect to see some fresh buying momentum kick in.
On the downside, we've a solid support zone around 3350-3360 that's worth keeping an eye on.
We did see a gap-up opening this morning, which is due to the ongoing war situation creating some safe-haven demand for gold. However, from price action perspective, gold is still trading within its range, and we need to wait for breakout from this range .
Until this range breaks definitively one way or the other, . No point in forcing trades when the market is clearly telling us it's still deciding which direction to go.but above 3360 level bulls are still in control (on Daily close).
GBPUSD - 15M OUTLOOKFOREXCOM:GBPUSD
Hello traders , here is the full multi time frame analysis for this pair, let me know in the comment section below if you have any questions, the entry will be taken only if all rules of the strategies will be satisfied. wait for more Smart Money to develop before taking any position . I suggest you keep this pair on your watchlist and see if the rules of your strategy are satisfied...
Keep trading
Hustle hard
Markets can be Unpredictable, research before trading.
Disclaimer: This trade idea is based on Smart money concept and is for informational purposes only. Trading involves risks; seek professional advice before making any financial decisions. Informational only!!!

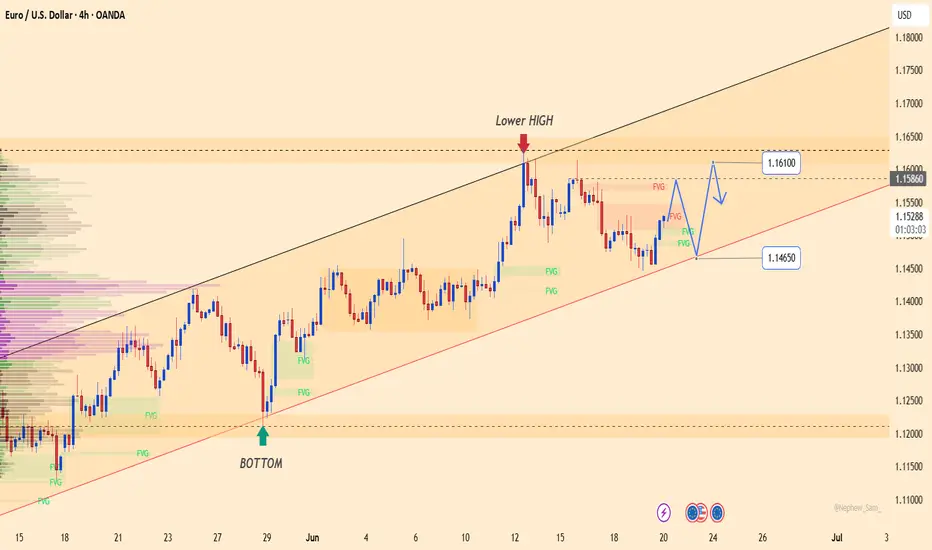
EURUSD – Rejected at Lower High, Bearish Bias BuildsEURUSD has printed a clear lower high near the 1.16100 resistance zone, failing to reclaim the previous swing high. Price is now retreating, approaching the dynamic trendline support intersecting with FVG zones around 1.14650. The structure suggests potential for a short-term bounce—but as long as price remains below the 1.15860–1.16100 resistance zone, the broader setup leans bearish.
On the macro side, the ECB’s dovish tilt—hinting at rate cuts due to subdued inflation—has weighed heavily on the euro. Meanwhile, the Fed maintains its hawkish stance, reinforcing dollar strength, especially amid renewed geopolitical tensions that are pushing USD further as a safe haven.
If the ascending trendline fails to hold, we may see an accelerated decline toward the 1.13800 area. Watch for a failed retest of 1.15860 as confirmation for short entries.
Institutions Option Database Trading Part-5 Risk Management in Option Trading
Even with data, risk control is key:
Max 2% capital risk per trade.
Hedge with opposite option.
Avoid low liquidity options.
Always track IV, PCR, OI live.
Building a Custom Option Scanner
With databases and logic, you can create a personal scanner for:
High IV options
OI breakout zones
PCR + Max Pain alert
Theta-rich expiry trades

Institutions Option Database Trading Part-4Advanced traders use machine learning to forecast:
Option price movement
Volatility changes
IV spikes before events
Popular Models:
Random Forest → Trend direction.
LSTM (Deep Learning) → Predict future IV.
Logistic Regression → Probability of ITM expiry.
These are trained on millions of past trades using structured databases.

Institutions Option Database Trading Part-6Deep Dive into Options Basics (For Data Traders)
Options are contracts giving the right but not the obligation to buy or sell an asset at a certain price before a set date. They are used for hedging, speculation, and generating income.
🛠️ Two Types:
Call Option: Right to buy an asset.
Put Option: Right to sell an asset.
Backtesting means testing a strategy using past data to check performance. Key for data-driven option trading.
Example:
Load 1-year option chain data for BANKNIFTY.
Apply rules: Buy Call when IV drops by 10% & PCR < 0.8.
Check PnL for each trade.
Filter for success rate > 65%.

Institutions Option Database TradingDatabase Option Trading is a powerful blend of market logic and data science. With structured data, intelligent scanning, and strategic execution, traders gain a massive edge over emotional/manual decisions. This approach is ideal for traders aiming for consistent performance, lower drawdowns, and systematic growth. The more you code, automate, and analyze—the better you trade.
Sample Strategy - PCR + OI Spike
Strategy Logic:
If PCR > 1.3 and Call OI Spike at ATM > 15%, initiate a Put Sell.
Exit when PCR drops below 1.1 or OI unwinds.
Backtest Results (NIFTY Options):
Win Rate: 72%
Avg Profit per Trade: ₹4800
Max Drawdown: ₹9800

Long Term Database TradingHow Institutions Use Option Databases
🔍 Institutional Insights:
Banks & HFTs (High-Frequency Traders) run option strategies over petabytes of data.
Real-time arbitrage opportunities are found using option databases.
They model Vega, Theta & IV impact per stock and expiry.
Example Institutional Workflow:
Pull 10 years of NIFTY options.
Train ML model to predict next-day IV.
Execute based on high-probability straddles/strangles.
Exit before expiry using trailing delta hedge.

Database Trading Introduction to Database Option Trading
Database Option Trading is an advanced strategy where traders use massive historical and real-time market data stored in structured databases to identify profitable option trades. Unlike conventional trading, this approach focuses on data-driven decision-making—leveraging algorithms, statistics, and pattern recognition rather than pure technical/fundamental analysis.
2. The Role of Data in Option Trading
Types of Data Used:
Option Chain Data: Strike prices, premiums, LTP, OI, IV, volume.
Historical Data: Past price action, volatility, Greeks, PCR.
Sentiment Data: FII/DII positions, news sentiment.
Real-Time Market Feeds: Tick-by-tick updates.
Macroeconomic Data: Interest rates, inflation, events.

XAU/USD Bullish Breakout from Flag PatternBullish Flag Formation: The price consolidated in a downward-sloping flag after a sharp bullish move. A breakout has occurred, signaling renewed buying pressure.
Support Zone: The breakout aligns with the horizontal support area around 3,392, reinforcing the bullish bias.
Upside Targets: Based on price structure and measured move projection:
First target: 3,435 – 3,452
Final target zone: 3,500+
Momentum Confirmation: The Ichimoku cloud supports bullish continuation as price trades above it, showing strong upward momentum.
Conclusion:
Gold appears to be resuming its uptrend after a brief consolidation. As long as price holds above the breakout level (around 3,392), the bullish targets remain valid. Ideal scenario for continuation traders looking for entries on minor pullbacks

XAUUSD – Gold Wobbles, Breakdown Risk IntensifiesGold is currently testing the lower boundary of the ascending channel after pulling back from the 3,398 USD resistance zone. The recent breakdown from a triangle pattern signals growing bearish pressure.
If the price fails to reclaim the 3,397 USD area, a continued move down toward 3,307 USD becomes likely — a level that coincides with key technical support. The latest FOMC minutes reaffirmed a “hawkish” stance, boosting the USD and adding downside pressure on gold.
The bearish outlook will strengthen if gold fails to hold the current support zone.

GBPUSD – Breakout Confirmed, Downtrend Targeting 1.33170GBPUSD continues to display a clear bearish structure on the 4H timeframe after breaking below a key horizontal support and the pink trendline. The pair is now attempting a retest of the resistance zone near 1.34600, which aligns with the previous support-turned-resistance and a nearby supply area. If price gets rejected here with weak bullish momentum, a strong downward continuation is likely, with the next target around 1.33170 – a zone marked by a long-term diagonal support and previous swing lows.
On the news front, the British pound is under pressure after the Bank of England (BoE) disappointed markets by holding interest rates steady at 4.25%. Meanwhile, the Federal Reserve maintains its “hawkish” stance, boosting USD strength and increasing downward pressure on GBPUSD.

EURUSD – Weakening Trend, Risk of Deeper CorrectionThe EURUSD pair is gradually losing its bullish momentum after failing to hold above the 1.1510 level, forming a series of lower highs. The recent decline is dragging the price back toward the long-term ascending trendline. If buyers fail to defend the support area around 1.1380 — a confluence of the trendline and the most recent swing low — the previous uptrend structure could be invalidated.
On the news front, the euro is under pressure following cautious remarks from the ECB, while recent PMI and inflation data from the Eurozone suggest slowing economic growth. Meanwhile, the Federal Reserve in the US maintains a hawkish stance, reinforcing USD strength and applying double pressure on EURUSD.

Learn Institution Trading Part -6Introduction to Institutional Option Trading
Institutional option trading refers to the sophisticated strategies used by hedge funds, mutual funds, insurance companies, proprietary trading firms, and foreign institutional investors (FIIs) to manage portfolios, hedge risks, and generate consistent alpha from the derivatives market. Unlike retail traders, institutions operate with large capital, access to advanced technology, and deep market insights, allowing them to structure complex trades.
2. Why Institutions Trade Options
Institutions don’t usually trade options for quick profits. Their trades are designed to meet broader objectives:
Hedging Equity Portfolios
Volatility Trading
Generating Yield on Holdings
Market Making and Arbitrage
Directional or Non-directional Speculation
3. Core Institutional Option Strategies
Let’s explore the most popular strategies that institutions use with real-world logic behind them.
A. Covered Call (Buy-Write)
Use: Income generation from long-term stock holdings
Structure: Buy stock + Sell Call Option (OTM or ATM)
Institutional Use Case:
A mutual fund holding Reliance shares might sell monthly call options against its holdings to generate monthly income (premium), enhancing total returns.

Option Trading How Institutions Operate:
Use Option Greeks (Delta, Gamma, Theta, Vega) for precise positioning
Follow OI (Open Interest) data for liquidity zones
Monitor FIIs/DII data from NSE reports
Combine options with futures arbitrage or cash segment hedging
🔹 Tools Used by Institutions:
Bloomberg Terminal
Custom-built Quant Models
NSE Option Chain + IV Analysis
Algo-driven trading based on volatility signals

Learn Institution Trading What is Institutional Option Trading?
It refers to large-scale option strategies used by hedge funds, banks, and FIIs to manage risk, hedge portfolios, or create directional bets with high precision.
🔹 Key Institutional Strategies:
Buy-Write (Covered Call):
Holding stocks and selling calls to earn premium.
Protective Put:
Buying puts as insurance to hedge stock positions.
Multi-leg Spreads (Iron Condor, Butterfly):
Neutral strategies to profit from range-bound markets.
Put-Call Ratio Analysis (PCR):
Gauging market sentiment from institutional flow.

Advanced Divergence Trading What is Divergence?
Divergence happens when the price moves in the opposite direction of an indicator (like RSI, MACD, or Momentum). It signals a possible trend reversal or trend weakening.
🔹 Types of Divergence:
Regular Divergence (Trend Reversal):
Bullish: Price makes lower lows, but indicator makes higher lows → Reversal up
Bearish: Price makes higher highs, but indicator makes lower highs → Reversal down
Hidden Divergence (Trend Continuation):
Bullish: Price makes higher lows, indicator makes lower lows → Trend continuation up
Bearish: Price makes lower highs, indicator makes higher highs → Trend continuation down
🔹 Advanced Tips:
Use on higher timeframes for accuracy
Confirm with volume, trendlines, or price action
Combine with support/resistance or Fibonacci zones
🔹 Pro Tools to Use:
RSI (Relative Strength Index)
MACD (Moving Average Convergence Divergence)
Stochastic Oscillator
OBV (On Balance Volume)

Support and Resistance ExplainedWhat is Support?
Support is a price level where a stock tends to stop falling due to increased buying interest. Traders view it as a demand zone where bulls often enter the market.
Example: If Reliance repeatedly bounces from ₹2,700, that level is acting as support.
🔹 What is Resistance?
Resistance is a level where a stock tends to stop rising due to selling pressure. It's a supply zone where bears usually take control.
Example: If Nifty keeps failing to cross 23,500, it's a resistance level.
🔹 Why They Matter:
Help in identifying entry and exit points
Show where trend reversals may occur
Aid in setting stop-loss and targets
🔹 How to Spot Them:
Look for price bounces or rejections
Use tools: horizontal lines, moving averages, Fibonacci retracements
Confirm with volume spikes
🔹 Key Strategy:
Buy near support (low risk)
Sell near resistance (high probability)
Trade breakouts or reversals with confirmation

Support and Resistance Support Level:
A price level where demand is strong enough to prevent the price from falling further. It's like a floor—buyers enter here expecting prices to rise.
Example: If Nifty falls to 22,000 repeatedly and bounces back, 22,000 becomes a support level.
🔹 Resistance Level:
A price level where selling pressure overcomes buying, preventing prices from rising. It's like a ceiling—sellers dominate at this level.
Example: If Bank Nifty rises to 50,000 but fails to move above, 50,000 is resistance.
📊 How to Identify Them:
Historical price charts
Trendlines
Moving averages
Fibonacci levels
Volume analysis
📈 Use in Trading:
Buy near support
Sell near resistance
Use breakout strategy when price breaches either level

GOLD GEARS UP FOR THE NEXT MOVE? All Eyes on Middle East & FedXAUUSD – GOLD GEARS UP FOR THE NEXT MOVE? All Eyes on Middle East & Fed
🌐 MACRO VIEW – WHAT'S MOVING GOLD?
🔺 Fed stays on hold, but Powell remains hawkish – His recent speech signals that inflation may persist due to ongoing geopolitical risks and rising commodity costs...
🔥 Middle East tensions could be the game-changer for gold prices:
If the US steps in as a mediator to de-escalate tensions between Israel and Iran, gold could see a deeper correction toward the 3,357–3,345 support zone, possibly lower...
On the other hand, Trump’s reported alignment with Israel and possible airstrikes on Iran would likely send gold soaring back to 3,417–3,440 levels, acting as a safe haven trigger.
📉 TECHNICAL SETUP (M30)
Gold is moving inside a descending channel, compressing within key EMAs (13–34–89–200).
A potential inverse head & shoulders pattern is forming at the bottom, signaling possible bullish breakout if confirmed.
Support remains firm around 3,345–3,357, while price struggles to break above the upper trendline.
✅ TRADING PLAN
🔵 BUY ZONE: 3,345 – 3,357
Entry: Look for bullish rejection and confirmation
SL: Below 3,342
TP: 3,373 → 3,384 → 3,403 → 3,417 → 3,440
🔴 SELL ZONE: 3,417 – 3,440
Entry: Wait for rejection and bearish confirmation near resistance
SL: Above 3,445
TP: 3,403 → 3,384 → 3,373 → 3,357
💬 FINAL THOUGHTS FOR INDIAN TRADERS
Even though the broader trend remains bullish, gold is not yet ready for a breakout – consolidation continues. Smart traders should stay patient, watch for clean setups, and manage risk well. Keep an eye on political developments, especially involving Iran, Israel, and the US, as they could trigger sharp moves in gold.
Trade smart. Let the market come to you.

Advanced Institutions Option Trading - Part 10Option Pricing Models
Institutions rely on theoretical models to value options precisely.
Models Used:
Black-Scholes Model: Most common for European Options
Binomial Model: For American options
Monte Carlo Simulations: For complex path-dependent options
Bachelier Model: For negative rate scenarios
These models help forecast fair value, hedge ratios, and profit probabilities.
🔹 17. Algorithmic and Quant Option Trading
Institutional desks often use automation for efficiency.
Tools & Techniques:
Python, R, C++ for strategy coding
Machine Learning for volatility prediction
Option Flow Analysis (Unusual Orders)
Real-time Gamma Exposure Mapping
Quant desks track Volga, Vanna, Charm, and other second-order Greeks for precise hedging.
